Part III. Lagging Indicators

Commander in Pips: And the last part in this chapter will be dedicated to lagging indicators. Here my view coincides with common one. Although common approach classifies as “lagging” trend indicators items such as Moving Averages and MACD, so I agree with that, but I also think that some of the oscillators that we’ve discussed in previous part are lagging as well. Despite the fact that their lag behind the price action could be smaller than of trend indicators. Sometimes trend indicators are called “Momentum Indicators”.
Pipruit: And what common approach tells about advantages and disadvantages of lagging indicators?

Commander in Pips: Let’s take a look at how it works:
Chart #1 | GBP/USD Weekly. MA and MACD
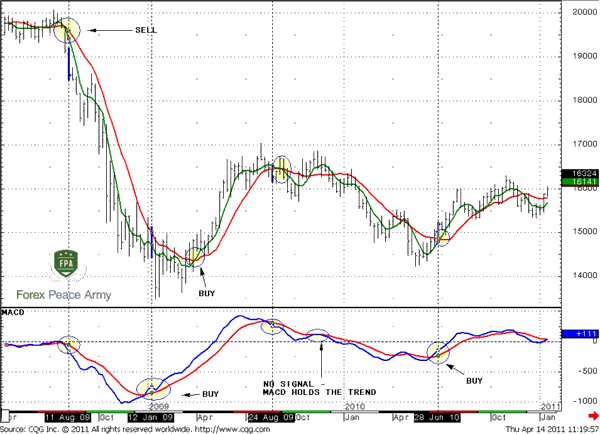
As you can see, in August 2008 a sell signal has come simultaneously from MACD and MA crossover on the chart. It has finished with an excellent down thrust. In the beginning of 2009 MACD has given a buy signal a bit earlier than moving averages, but still both of them have turned in the same direction. A very interesting situation has happened at the end of 2009 – although MA has shown bullish crossover – MACD has held a down trend and negated this buy signal. And finally, in June 2010 MACD and MA has given signal to enter the market at long side.So, you can see that sometimes MACD gives signals a bit earlier, while MA still hold the previous trend. For example, as it has happened in January 2009. As you can see, after MACD has generated a signal the market has shown solid retracement down. Potentially such price action could turn to losses or you will be nervous at such price action. AS with other indicators we must use MACD or MA, but only as a tool in an overall trading plan. For instance, if your trading plan suggests that you must enter on retracement low, after confirmed a buy signal from MACD – then you have entered almost at the extreme low and caught anoutstanding move up then. I just want to say that we should not trade blindly based on any single indicator, despite how it could be attractive to you and the grade of your fascination with them.
Personally, I like MACD as a trend indicator, but I do not use it in the simple way – “up cross – buy, low cross – sell”. I prefer to use it during thrusting moves, look for cross angle, look where this cross has happened, what kind of price action was before the MACD signal, does price action support the trend or not and so on…
In other words – a trading plan is that you should follow. Indicators are just tools that help you to understand the overall picture and decide – do you wish to take the trade or is it better to wait for another chance…
Comments

Hamza Samiullah
6 years ago,
Registered user
Good One...
O
One-fm
5 years ago,
Registered user
Excellent.
Table of Contents
- Introduction
- FOREX - What is it ?
- Why FOREX?
- The structure of the FOREX market
- Trading sessions
- Where does the money come from in FOREX?
- Different types of market analysis
- Chart types
- Support and Resistance
- Candlesticks – what are they?
- Mysterious Fibonacci
- Introduction to Moving Averages
- Bollinger Bands
- Leading and Lagging Indicators
- Basic chart patterns
- Pivot points – description and calculation
- Elliot Wave Theory
- Intro to Harmonic Patterns
- Divergence Intro
- Harmonic Approach to Recognizing a Trend Day
- Intro to Breakouts and Fakeouts
- Again about Fundamental Analysis
- Cross Pair – What the Beast is That?
- Multiple Time Frame Intro
- Market Sentiment and COT report
- Dealing with the News
- Let's Start with Carry
- Let’s Meet with Dollar Index
- Intermarket Analysis - Commodities
- Trading Plan Framework – Common Thoughts
- A Bit More About Personality
- Mechanical Trading System Intro
- Tracking Your Performance
- Risk Management Framework
- A Bit More About Leverage
- Why Do We Need Stop-Loss Orders?
- Scaling of Position
- Intramarket Correlations
- Some Talk About Brokers
- Forex Scam - Money Managers
- Graduation!