Part II. Ways to Place Stop-Loss Orders


Commander in Pips: This is the simplest way to place stop, and as you probably guessed – the most reckless. In fact, it depends on risk threshold and money management system of each particular trader. The trader just determines maximum loss level in every trade and place stops accordingly. Those who feel comfortable with greater risk level could use 10% as stop loss value in every trade, while wise traders usually use not greater than 2% in each trade. Depending on the position size a trader calculates the price level where he or she should place stop. For example, if you have 10,000 USD with assets and trade 1 standard lot of EUR/USD, choose risk level as 5% in every trade, then your stop will be 50 pips away from your entry point.
Pipruit: Hm, why have you said that this is a reckless way to place stops? This approach agrees with money management and we’ve said that money management is a must… So what’s wrong with this approach?
Pipruit: Hm, I'm curious and what about money management and other stuff?
Chart #1 | EUR/USD 60 min
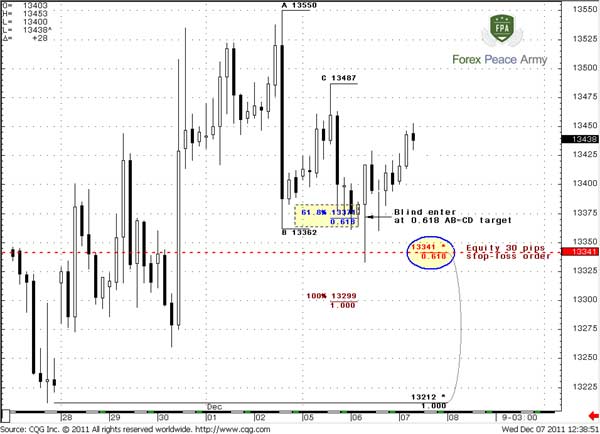
Later you will see that you have placed your stop not at invalidation area, but in a most unwelcome place – just below the previous low. Some time after, you can see an excellent Wash and Rinse pattern that has triggered upward continuation. Your stop should take into account the technical picture to be placed at a really crucial point. So, that if the market will reach it you can say – “That’s all, buddy, the market has passed the point of no return - there is no road back for now and it’s time to get out”…
Pipruit: Well, here I think, I have to place stop at least below 0.618 support, or even below AB-CD completion point of 1.33, since in this case it still could be “222” pattern.
Pipruit: Now I see. Indeed, here is no contradiction – I can, for instance, reduce my lot size a bit, but place stop correctly – below the 0.618 Fib support or even reduce it a bit more and place stop below AB=CD 1.33 target. At the same time I will not lose more than 1.5% in this trade and my money management system will hold and work properly. Excellent stuff!
Technical or chart stop
Since we apply charts in both short-term and long-term analysis and even traders who mostly use fundamental analysis still use charts to estimate potential areas where to enter the trade, we have to use them also for stop placing. If the market tells us what it intends to do by charts, so, it makes sense to use charts to understand where to place stops. In fact, chart stop could be placed with two possible ways, depending on what is your triggering scenario. As we know this could be either some pattern or trend, or maybe their combination also.
Stop-loss placing with patterns trading
If your triggering scenario is some pattern then the invalidation point will be the pattern’s failure. Hence, stop should be placed somewhere beyond this point – just to get 100% confidence that pattern has failed and your attempt wasn’t successful. Let’s take a look at following examples:
Chart #2 | EUR/USD 60 min
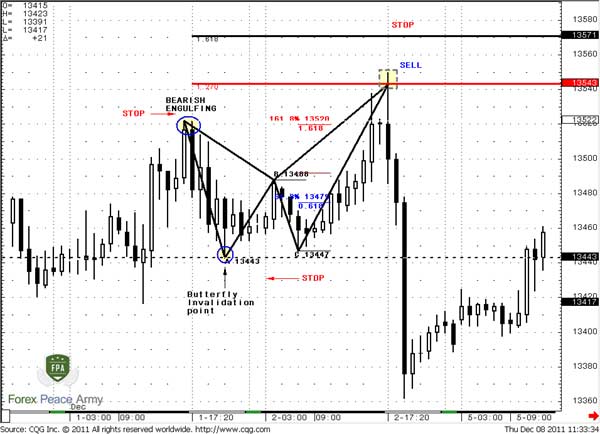
Here you can see three possibilities for trading that are based on some patterns. First, it could be “sell” by a bearish engulfing pattern. So, if you intend to sell with it you have to place stop above the high of this pattern, since we know that the invalidation point of this pattern is that high. Second, let’s suppose that you decide to anticipate a Butterfly “Sell” pattern in C point at 1.3447. You see, that it very close to 1.3443 low and risk/reward ratio is tremendous. The invalidation point of Butterfly precisely is 1.3443 low, as we know it, because if the market will break it – it will erase the initial X-A swing of butterfly. And finally, you decide to sell on the 1.27 butterfly – very well, but you have to place stop above the 1.618 extension since, as we’ve discussed, if the market moves above it, then the probability of an upward continuation becomes significantly higher and in most cases the butterfly fails. So, as you can see that it is very simple to place stops with different patterns, because any pattern has its own well-known and definite failure points and target level.The second step is to adjust your position value, according to risk management rules. For instance, if you apply 1.5% maximum loss in any trade and your account is 10,000 USD, you can place, say 1.3595 stop loss and sell at 1.27 butterfly’s level at 1.3543. This is approximately a 50 pips stop, hence you can trade it with 0.3 lot – not bad, if we will take into consideration the following move…
Pipruit: Sounds very logical and clear, thanks. But what is about the second scenario?
Stop-loss placing with trend trading
Commander in Pips: The second scenario is more sophisticated since the triggering moment here is trend with a combination of support/resistance lines – as classical as Fibonacci. We will look at it with more details. Still it is very simple to understand the invalidation point – this will be a trend break in the opposite direction. But to clearly understand the total framework we have to specify different tools as strictly as possible:
1. To trade the trend we need corresponding momentum. This will give us more confidence and the trade will be safer. Momentum is determined by the thrust.
2. We will treat thrust as the number consecutive bars – 8-10 at minimum, so that it does not close below 3x3 DMA, as in the picture. You may apply different rules – softer or stricter:
Chart #3 | EUR/USD 60 min
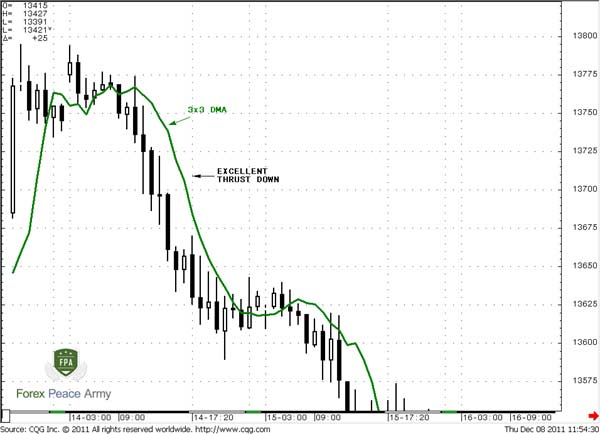
Actually, the market could penetrate 3x3 DMA but should not close above it. If it even does not touch it as on the picture – much better. A gradual thrust is better than interrupted –when the market shows 1-2 thrusting candles then consolidation and then again 1-2 thrusting candles. Although this also will be a thrust, if uncrossing condition holds, but this kind of thrust is a bit worse than a gradual one as on the picture #3.3. We need two time frames to trade the trend – call them as “Context time frame” (higher) and “Entering time frame” (lower). Thrust should be seen on “Context time frame”. Higher time frame will show us the trend direction, while the lower time frame we will use for estimation of entry point. Possible combinations are: Monthly-weekly; Weekly-daily; Daily – 4-hour; Daily-hourly; 4-hour-30-min; hourly-15-min; 30-min-5 min and so on.
4. We will use MACD as trend indicator at both time frames. You may use any other indicator, for example moving average – the framework and technique will stay the same.
So, how will it be on practice? This is daily EUR/USD chart. We see 8-bars thrust, based on 3x3 DMA. So, downward momentum is nice:
Chart #4 | EUR/USD Daily
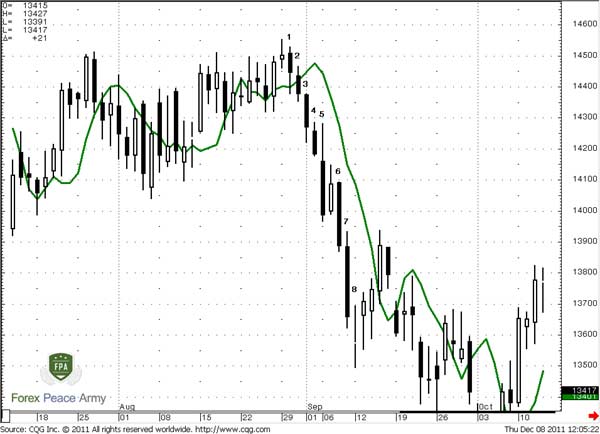
Now we have to look at trend by MACD. For simplicity I will use the DiNapoli MACD Predictor. We already have spoken about it when discussing market pressure pattern. This indicator is derivative from the simple MACD. When MACD shows line crossing and trend shifting – MACD predictor crosses the price chart. I intentionally will have them both on the chart. When price stands below the red line of MACD Predictor – the trend is bearish, when above it – bullish.So, on chart #5 we clearly see that the trend is strongly bearish. And we see that the market is starting to show upward retracement after the 8th bar of thrust – that is our chance to enter short. By the way if you will make overbought/oversold analysis here with Detrended oscillator or Momentum you will find out that the market has hit daily oversold with the 8th bar. Let’s suppose that we have two possible areas to enter – 0.382 resistance or 0.618 (they could be different and not necessary Fib levels). Since the daily oversold has been corrected when market has hit 0.382 resistance at 1.39 we can think about entering short. But what will be our invalidation point? As we’ve said this is trend breakeven – if the daily trend will turn bullish our context will be broken. MACD Predictor shows, that this point is 1.4067 for 16th of September – slightly below 0.618 resistance. Pay attention that this point will be dynamic, because MACD value will change day by day and this point will drift lower. But how do we know that market will not proceed any higher and that we have to enter right here? For that purpose we need lower time frame…
Chart #5 | EUR/USD Daily and MACD - “Context time frame”
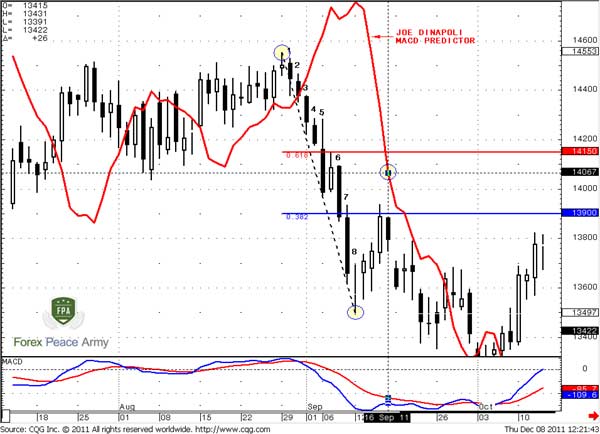
Chart #6 | EUR/USD 4-hour - “Entering time frame”
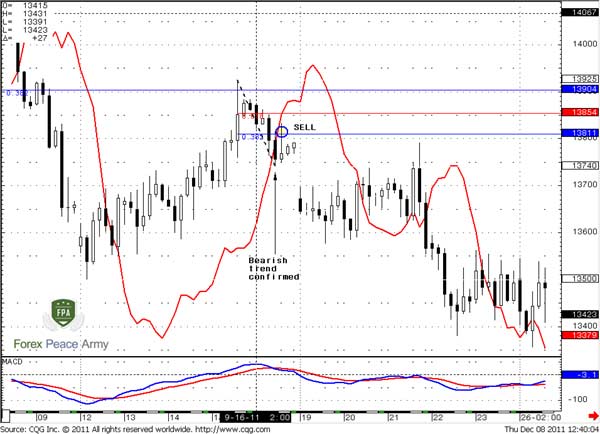
We will use the 4-hour time frame as “Entering” one. To estimate should we enter short here or not, we need 4-hour trend turning in the same direction as our context trade, i.e. daily and down. Here we see, that right from the point, when the market has hit oversold – 4-hour trend has turned bullish. This tells us that retracement is still under way. Then market has hit 0.382 daily resistance at 1.3904 and price has turned south. The market was not at oversold at this time. A bit later the 4-hour trend has turned bearish by close – that is what we want.
Chart #6 | EUR/USD 4-hour - “Entering time frame”
We will use the 4-hour time frame as “Entering” one. To estimate should we enter short here or not, we need 4-hour trend turning in the same direction as our context trade, i.e. daily and down. Here we see, that right from the point, when the market has hit oversold – 4-hour trend has turned bullish. This tells us that retracement is still under way. Then market has hit 0.382 daily resistance at 1.3904 and price has turned south. The market was not at oversold at this time. A bit later the 4-hour trend has turned bearish by close – that is what we want.
To enter short we need nearest 0.382 resistance from the most recent swing down on 4-hour time frame – 1.3811 and enter short. Initial stop we have to place above 1.4067 – MACD daily trend breakeven point as we’ve estimated higher.
While the market has started move in your favor – you may tight stop by daily MACD or even manage them based on 4-hour time frame, move it to breakeven and so on.
Pipruit: Well, this is really cool stuff! But can I place the stop a bit differently – for example above the MACD Predictor on a 4-hour chart by close?
Pipruit: And should I use any patterns on lower time frames to estimate where to enter on 4-hour?
Pipruit: Something else?
Comments
O
Onyebuchim C. Obike
11 years ago,
Registered user
Thanks for this part. "Commander in Pips: Right, I’m glad that you’ve got it. Stop is not an issue that tells you how much you’re ready to lose – this is a question of money management. Stop is an area that tells you that the market will continue move against you with high probability."
I've been in the Forex for quite a very long time and the explanation below broadend my knowledge about stops.
I have a question or observation:
It is popularly known that some brokers manipulate their systems to test your stops no matter how good your system is. What do you think about this ? and what do you advice because some say its better to hide your stops or use mental stops which can also be bad.
Thanks.

Sive Morten
11 years ago,
Registered user
> Thanks for this part. "Commander in Pips: Right, I’m glad that you’ve got it. Stop is not an issue that tells you how much you’re ready to lose – this is a question of money management. Stop i..
Well, I see couple of solutions:
First - choose broker with solid reputation and test their action with small position initially. If you suspect that it hunts your stop - make correpsonding conclusions;
Second - trade on currency futures. There could not be any "occasional" price. You can check all quotes and trades for any session to the tick.
Speaking about mental stop - yes, this is possible, but this demands really huge experience and hard rock discipline. Usually this approach is used by solid and highly experienced traders. Personally, I do not use it.

Pharaoh
11 years ago,
Registered user
Even if you have incredible mental discipline and can always close exactly where you've placed your mental stop, having an "emergency SL" somewhere a little further out can save your account if you lose your connection to the broker. Even a broker that hunts stops isn't likely to try to grab more than 5 or 10 pips, so an emergency SL 20+ pips beyond your mental stop can keep you covered while you shop around for a better broker.
R
rajesh bhujbal
11 years ago,
Registered user
hi Sive, thank you very much for you incredible affords. this education is really helping me alot.
My question is about the the butterfly pattern stop placement.
it is totally logical that placing the stops beyond 1.618 target. but HOW MUCH BEYOND 1.618 LEVEL?
i know its judgement call, but how much further do YOU put your stops ? (suppose we are on 1 hour chart.)
is stops at 10 Pip further is ok?
also there is great volatility at important levels.
also , we have to put our order few pips billow the 1.27 level. again HOW MUCH BELLOW 1.27 LEVEL? in order to make sure that our order gets filled..
i see that you have put your stops 25pips away from 1.618 level.
i actually do Not feel comfortable with stop loss at MORE THAN 50 PIP away from the entry , because of reward/risk ratio.
so if i put order and sl 25 pip billow and further respectively in this case, then total risk for the trade will be much more.
also same thing about any support or resistance level. How much further do you usually keep your stops to avoid WASH N Rinse ? there has to be some rage (pips) to compensate with W&R..?
Sive Morten
11 years ago,
Registered user
> hi Sive, thank you very much for you incredible affords. this education is really helping me alot.
My question is about the the butterfly pattern stop placement.
it is totally logical that placing th..
Hi Rajesh,
if you've read this chapter carefully, you should remember the term as "harmonic" number. On Eur it stands about 35-40 pips. That is the major distance for stop placing, when you trade harmonic patterns. Also, as you decrease time frame, you may apply fraction of it. For example, on 5-min chart, I suppose 20 pips will be enough. Probably on hourly you can use 20 pips as well, but in recent time volatiliy has increased and safer still to apply 35-40 pips.
Speaking about entry orders - you can place it just some pips before the level 5-7 pips will be OK, I suppose.
Speaking about W&R - here is no any rule of thumb about stop placing to avoid it. Usually there are some reasons for W&R - obvious long-term top/bottom, some Fib extension target that stands slightly higher/lower or something of that sort. In this case it's better to wait of W&R and only after that take action.
F
forbroker
9 years ago,
Registered user
It seems that the first 3 were rather wastful time wise since thee is only one way to set the risk .....and even trade ratio although the later is never perfect.
I would like to know where /what are trhe details of that spot on Mac D you show on the last lesson...I have only ever seen lagging ones....
I would like to know where /what are trhe details of that spot on Mac D you show on the last lesson...I have only ever seen lagging ones....
Table of Contents
- Introduction
- FOREX - What is it ?
- Why FOREX?
- The structure of the FOREX market
- Trading sessions
- Where does the money come from in FOREX?
- Different types of market analysis
- Chart types
- Support and Resistance
- Candlesticks – what are they?
- Mysterious Fibonacci
- Introduction to Moving Averages
- Bollinger Bands
- Leading and Lagging Indicators
- Basic chart patterns
- Pivot points – description and calculation
- Elliot Wave Theory
- Intro to Harmonic Patterns
- Divergence Intro
- Harmonic Approach to Recognizing a Trend Day
- Intro to Breakouts and Fakeouts
- Again about Fundamental Analysis
- Cross Pair – What the Beast is That?
- Multiple Time Frame Intro
- Market Sentiment and COT report
- Dealing with the News
- Let's Start with Carry
- Let’s Meet with Dollar Index
- Intermarket Analysis - Commodities
- Trading Plan Framework – Common Thoughts
- A Bit More About Personality
- Mechanical Trading System Intro
- Tracking Your Performance
- Risk Management Framework
- A Bit More About Leverage
- Why Do We Need Stop-Loss Orders?
- Scaling of Position
- Intramarket Correlations
- Some Talk About Brokers
- Forex Scam - Money Managers
- Graduation!