Part II. How to interpret different candlesticks?

Pipruit: Sir, I’ve found that there could be different candles – with big and small bodies, also with long and short shadows. Also some candles seem skewed, because have different shadows. Sometimes the lower shadow is longer than upper one, sometimes vice versa. Does it make any sense? Should we pay attention to this?
Commander in Pips: We must do it, especially on longer time frames. In fact, any candle shows us about the price action during the period, and if this period is a month – then this information will be significant. The greater the period is - the more important this information. Although a particular candle, say, on a 5-min chart is not of as much importance as on a monthly, the repeating of some types of candles (i.e. price action), still could be very important, even on small time-frames. So we have to study how to understand the information that is brought by a candlestick.
Pipruit: So, I’ve suspected something like that…
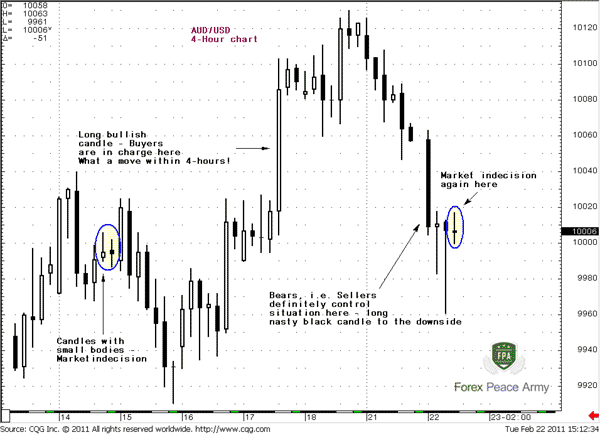
Commander in Pips: Let’s talk about candle bodies first. The longer the body is, the greater difference between open price and close price. It means that depending on the direction of price movement (up candle or down candle), buyers or sellers were stronger than usual. If this is an up candle – it means that price has risen more than usual. It tells us that buyers were more active and strong during this period and were able to raise price significantly. Buyers definitely have taken control during this period and buying intensity on the market was high.
The same is true for down candles. Long body on a down candle (black, as a rule) means that price has fallen more than usual. It tells us that sellers were more active and strong during this period and were able to reduce price significantly. Sellers definitely have taken control during this period and selling intensity on the market was high.
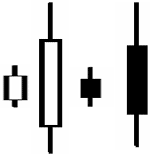
Short bodies assume little buying or selling activity. Very often such bodies are treated as “market indecision”, because there is no prevailing by either bulls (i.e. buyers) or bears (i.e. sellers). Here is what they look like:
Long and short candles
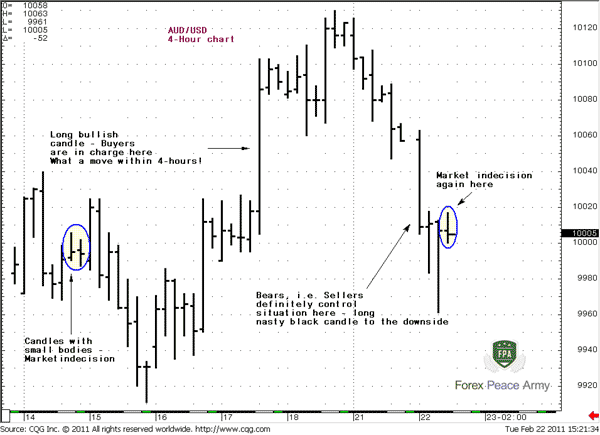
And here how it looks like on real charts:
Commander in Pips: Of course, you’re absolutely right. This approach is absolutely suitable for bar charts as well. The major reason why it usually applies with candlesticks is because it’s much easier to see with candles – this is just more comfortable. Here it is – take a look by yourself:
Commander in Pips: Ok, first of all I have to remind you that shadows carry very important information. The top of upper shadow shows the highest price of trading period, while the bottom of lower shadow – lowest price of trading period.
So, let’s clarify, what means the differences between shadows? Let’s take a look at next candles, what is different and what is common for them?
Commander in Pips: Excellent, but can you tell me the same, but in terms of shadows…
Commander in Pips: Great. Now imagine the price action that has happened as these candles were forming… What do long lower shadows mean?
Commander in Pips: You are absolutely right. In the beginning of this period that is indicated by this candle, bears (i.e. sellers) were stronger – they could move prices till the level of lower shadow that shows the lowest price of trading period. But then due to some reasons (for example, macro data release), bulls have come in play and force bears back till the end of trading period. As a result the close price is very close to the high on the right candle.
Speaking about left candle, we can see that it’s not so “bullish” compared to the other one, because it has a close price not so near the high. It means that although bulls were able to return their positions from the lowest price and have driven price up again – the bears power increases closer to the end of the trading period and they were able partially push the bulls lower. On the example of this candle you can understand why candles with close price near the open one and equal shadows are named as “indecision”. Because bulls return back from lowest price and drive right to the highs, but then bears were a bit stronger and returned price back again. So, as a result – almost parity – shadows have almost equal length and close price is very near the open one.
By the way, if our left candle has a bit lower close price we also can call it like that.
Commander in Pips: Well, the candle with long shadows tells us, that the solid part of trading action was beyond the close and open price, while the candle with short shadows shows that the major action was inside open-close price range.
Commander in Pips: Now take a look at next picture – this is the reverse situation of white candles and it could be treated accordingly:
The long upper shadow tells that initially buyers prevail and push price to the high (that is showed by the upper shadow), but due to some reason sellers with overwhelming power have stepped in and pushed buyers right back to the open price or even lower – so that market even has closed lower than open.

Commander in Pips: Well, this will be another lesson. We will talk about it when we will discuss single candlestick patterns. There we will clarify that. But I think that this is enough for today.
And here how it looks like on real charts:
#1 4-Hour AUD/USD
Pipruit: Well, Sir, does this kind of analysis make sense for bar charts? I’ve just thought, although they look a bit different, bar chart shows the same information as candle one, doesn’t it?
#2 the same AUD/USD chart but now with bars
See – the candle chart is much more evident than the bar one. Because candles are thicker then bars and colored – this makes them more comfortable for analysis and perception. But both of them – as bar chart, as candle could be used, because they carry the same information.Pipruit: I see thanks. But now I have a question about the shadows…Speaking definitely – couple of questions.
1. Is it important the difference in length between upper and lower shadows?
2. How important the length of shadows itself?
1. Is it important the difference in length between upper and lower shadows?
2. How important the length of shadows itself?
Commander in Pips: Ok, first of all I have to remind you that shadows carry very important information. The top of upper shadow shows the highest price of trading period, while the bottom of lower shadow – lowest price of trading period.
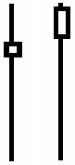
So, let’s clarify, what means the differences between shadows? Let’s take a look at next candles, what is different and what is common for them?
Pipruit: Well, common for them is that they have a closing price near the top. Difference is that the right candle has a close price right near the high, while left candle a bit lower than the high price.
Commander in Pips: Excellent, but can you tell me the same, but in terms of shadows…
Pipruit: Ok, I’ll try. Both of them have a long lower shadows, but right has very shallow up shadow, while the left candle has a more normal upper shadow, although it still shorter than the lower one.
Commander in Pips: Great. Now imagine the price action that has happened as these candles were forming… What do long lower shadows mean?
Pipruit: I suppose during this period sellers push prices down, but later buyers struggle sellers back and has returned their positions. We can see that by the position of the close price – it near the high.
Commander in Pips: You are absolutely right. In the beginning of this period that is indicated by this candle, bears (i.e. sellers) were stronger – they could move prices till the level of lower shadow that shows the lowest price of trading period. But then due to some reasons (for example, macro data release), bulls have come in play and force bears back till the end of trading period. As a result the close price is very close to the high on the right candle.
Speaking about left candle, we can see that it’s not so “bullish” compared to the other one, because it has a close price not so near the high. It means that although bulls were able to return their positions from the lowest price and have driven price up again – the bears power increases closer to the end of the trading period and they were able partially push the bulls lower. On the example of this candle you can understand why candles with close price near the open one and equal shadows are named as “indecision”. Because bulls return back from lowest price and drive right to the highs, but then bears were a bit stronger and returned price back again. So, as a result – almost parity – shadows have almost equal length and close price is very near the open one.
By the way, if our left candle has a bit lower close price we also can call it like that.
Pipruit: That’s fine; I understand the answer about the first question. But how we should understand the different length of shadows?
Commander in Pips: Well, the candle with long shadows tells us, that the solid part of trading action was beyond the close and open price, while the candle with short shadows shows that the major action was inside open-close price range.
Commander in Pips: Now take a look at next picture – this is the reverse situation of white candles and it could be treated accordingly:
The long upper shadow tells that initially buyers prevail and push price to the high (that is showed by the upper shadow), but due to some reason sellers with overwhelming power have stepped in and pushed buyers right back to the open price or even lower – so that market even has closed lower than open.
Pipruit: Yes, I think I’ve got it. Commander and is it important the color of the body? Say, if this last candle was white instead?
Commander in Pips: Well, this will be another lesson. We will talk about it when we will discuss single candlestick patterns. There we will clarify that. But I think that this is enough for today.
Comments
A
Adan Martinez Rocha
3 years ago,
Registered user
This is an extraordinary source of information, thank you again Sive!

MikeHenri
3 years ago,
Registered user
Thank you for your lessons, Mr. Morten.
Table of Contents
- Introduction
- FOREX - What is it ?
- Why FOREX?
- The structure of the FOREX market
- Trading sessions
- Where does the money come from in FOREX?
- Different types of market analysis
- Chart types
- Support and Resistance
- Candlesticks – what are they?
- Mysterious Fibonacci
- Introduction to Moving Averages
- Bollinger Bands
- Leading and Lagging Indicators
- Basic chart patterns
- Pivot points – description and calculation
- Elliot Wave Theory
- Intro to Harmonic Patterns
- Divergence Intro
- Harmonic Approach to Recognizing a Trend Day
- Intro to Breakouts and Fakeouts
- Again about Fundamental Analysis
- Cross Pair – What the Beast is That?
- Multiple Time Frame Intro
- Market Sentiment and COT report
- Dealing with the News
- Let's Start with Carry
- Let’s Meet with Dollar Index
- Intermarket Analysis - Commodities
- Trading Plan Framework – Common Thoughts
- A Bit More About Personality
- Mechanical Trading System Intro
- Tracking Your Performance
- Risk Management Framework
- A Bit More About Leverage
- Why Do We Need Stop-Loss Orders?
- Scaling of Position
- Intramarket Correlations
- Some Talk About Brokers
- Forex Scam - Money Managers
- Graduation!