Part II. Major EW patterns – Impulse move

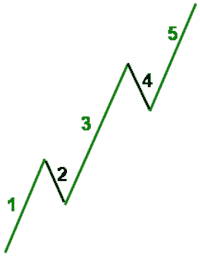
Elliot’s work tells us that a trending market moves in 5-3 wave pattern. First a 5 wave pattern is called “impulsive”, while the last 3 wave pattern is called “Corrective”.
So let’s take a look at the picture first, since it will be easier to explain it:
Pipruit: Hm, I’m hardly understanding what you’re talking about. But I hope that it will become clear later on. But Commander, why did Mr. Elliot think that market trending, or “impulse” move develops precisely or as usual with such pattern?
Commander in Pips: Well, actually this kind of developing of overall market sentiment is very logical. And to make it clear for you also, let’s pass through market mechanic of each wave, as we did in previous chapters with other patterns:
Wave 1
This is initial move up. It happens just because number of investors/market participants thinks that some currency or asset (if you will apply it to other markets, say, commodities) is undervalued and should rise during the nearest time. The number of traders, who think like that relatively small, and their thoughts about reasons for such growth could be absolutely different – fundamental, technical or imagined. This leads some currency to slight growth, which is wave 1.
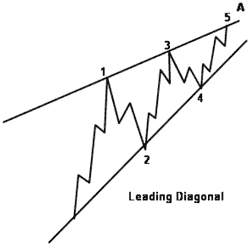
Leading Diagonal
This type could takes place in a position of 1st wave, although you will not see it very often. That’s why it calls “leading”. It will be simpler if I just give you the picture:
Wave 2

Second Wave’s low/high could not be lower than first wave low/high on bull/bear trend!
Wave 3
This wave usually the strongest and longest among 1st, 3rd and 5th waves. Because initial swing up and shallow retracement tells that there is some upside power and energy in this currency, since price couldn’t return back to the low of wave 1. This moment attract the attention of the public and other large participants who have not entered on wave 1 and wait for retracement (read wave 2) to step in. Almost as we did – “buy deeps”, remember? Since the mass public and other participants are stepping and stepping in, this leads to strong and sustainable move up. As a rule wave 3 exceeds the highs of wave 1.
Third Wave could not be smallest trending sub-wave!
Wave 4
This is just a profit taking retracement. Some participants decide to exit and take profit, since the currency has shown solid growth and probably they have changed their assessment of the attractiveness of holding positions. Usually the 4th wave is weakest among all others. Because many trades wait to “buy at deep” again and step in with long positions. Many professionals decides to exit precisely at 4th wave, because public has tremendous enthusiasm to Buy, and they (public) provide excellent demand and liquidity at good prices to sell huge professional’s positions. It is not very important on FOREX, where liquidity is always high, but this is significant for the stock market.
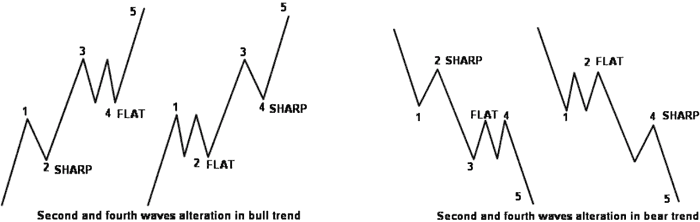
Now a couple of words are about second and 4th waves. They have a tendency to take one of two different forms – “flat” or “sideways” retracement or “sharp” retracement. They are always alternate between these two ways of retracement. Here is how this it looks like:
Wave 5
This is a period of sick fascination of currency growth. But here is easier to imagine the psychology of 5th wave on some stock. If you see, how your grandma has read in some magazine about this stock and put her money in, and the Executive of this company tells almost every day on CNBC about huge long term perspectives, or he/she has become a Person of the year with “People” magazine or some other, numerous brokers, traders and investors start to coming up with a lot of reasons (sometimes curious) why this currency or stock is undervalued and has to be bought – you should know – it’s time to get out. This is the time, when stock/currency is strongly overpriced. Also during the 5th waves contrarians start to initiate short positions. That’s why very often 5th wave could be flat or has unstable shape – the move up happens but very irregular. This initial shorting later leads to ABC retracement pattern.
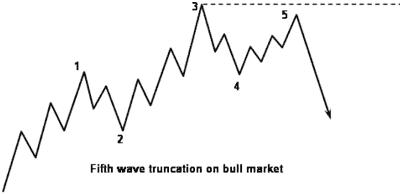
Since 5th wave very often develops in Overbought (on bull trend) or Oversold (on bear trend), it falls in “Truncation”. This is a situation, when high of 5th wave can’t establish new high and remains lower than the high of third wave – look at the picture:
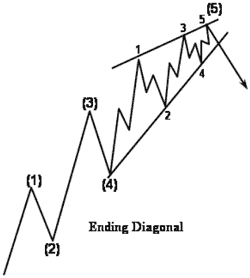
Ending Diagonal appears during 5th wave. This occurs much oftener than leading diagonal, and as you can see consists of 5 3-wave corrective patterns. Here is you also could see another example of Fractal – 5th larger wave that marked as (5) consists of 5 smaller waves, although they have 3-wave structure.
Pipruit: Looks like EW theory has as much exceptions as general rules. Because it’s only a start point, but I already can’t capture it in my head.
Commander in Pips: Well, in general, you’re right. EW approach to the market analysis has a lot of nuances. But since you will follow it – much of them will put in mind fast. Don’t worry.
Comments
D
dave edwards
12 years ago,
Registered user
thanks
Thanks again. I hope it will become clearer to me later on. Have a good weekend
Dave
Cape Town :)
Thanks again. I hope it will become clearer to me later on. Have a good weekend
Dave
Cape Town :)
U
Unumba1
12 years ago,
Registered user
Unumba1 - Florida
Fantastic! I love this! Thank you. Makes sense. And it looks like you see the fractals on different time-length charts.
Fantastic! I love this! Thank you. Makes sense. And it looks like you see the fractals on different time-length charts.
F
fran alvarez
12 years ago,
Registered user
Thank you
Ok, I don´t have words to say you thanks for all this fantastic information...
Greetings from Colombia for you Chief, and all the recruits in this crusade
Ok, I don´t have words to say you thanks for all this fantastic information...
Greetings from Colombia for you Chief, and all the recruits in this crusade
T
Tank
12 years ago,
Registered user
ew
looks easy and makes sense drawn like that but its probably the field of analysis where people disagree the most. i find it extremely difficult to identify the wave numbers on real charts in real time especially. 1 trader will highlight a section and say its wave 3, another will say its wave 5 and another might say something else..
hope it becomes clearer. fib, pivots and MA's are just so much simpler and used by allot more traders probably

Sive Morten
12 years ago,
Registered user
> looks easy and makes sense drawn like that but its probably the field of analysis where people disagree the most. i find it extremely difficult to identify the wave numbers on real charts in real tim..
Hi Tank,
you're absolutely right, and appoint on the root of EW. I'm also not a big fan of EW analysis. But this is school, we must show the core of this theory and overall guidance. Who knows, may be for somebody this will be major analysis tool and he/she will succeed with this.
Hi Tank,
you're absolutely right, and appoint on the root of EW. I'm also not a big fan of EW analysis. But this is school, we must show the core of this theory and overall guidance. Who knows, may be for somebody this will be major analysis tool and he/she will succeed with this.

Hamza Samiullah
6 years ago,
Registered user
nice lesson
O
One-fm
5 years ago,
Registered user
It is getting clearer. Thanks
Table of Contents
- Introduction
- FOREX - What is it ?
- Why FOREX?
- The structure of the FOREX market
- Trading sessions
- Where does the money come from in FOREX?
- Different types of market analysis
- Chart types
- Support and Resistance
- Candlesticks – what are they?
- Mysterious Fibonacci
- Introduction to Moving Averages
- Bollinger Bands
- Leading and Lagging Indicators
- Basic chart patterns
- Pivot points – description and calculation
- Elliot Wave Theory
- Intro to Harmonic Patterns
- Divergence Intro
- Harmonic Approach to Recognizing a Trend Day
- Intro to Breakouts and Fakeouts
- Again about Fundamental Analysis
- Cross Pair – What the Beast is That?
- Multiple Time Frame Intro
- Market Sentiment and COT report
- Dealing with the News
- Let's Start with Carry
- Let’s Meet with Dollar Index
- Intermarket Analysis - Commodities
- Trading Plan Framework – Common Thoughts
- A Bit More About Personality
- Mechanical Trading System Intro
- Tracking Your Performance
- Risk Management Framework
- A Bit More About Leverage
- Why Do We Need Stop-Loss Orders?
- Scaling of Position
- Intramarket Correlations
- Some Talk About Brokers
- Forex Scam - Money Managers
- Graduation!