Part I. Candlesticks – what are they?

Commander in Pips: Today we will start to study the details of Japanese Candlesticks. Do you remember what they are?
Pipruit: Sure, Commander. What else can we learn here? We’ve already talked about them and I know how to read candlestick charts…

Commander in Pips: That’s good. But do you know that candlesticks can form different combinations, i.e. patterns that could help you in a making a decision about further market moves? Some group of candles, from 1 to 3 of them, could create continuation and reversal patterns, and when they appear in the right place (for example at support or resistance areas) - could give you some confidence about these areas and your analysis of further price action.
Pipruit: Cool! I didn’t know that. Let’s start with it now…
Commander in Pips: As you wish…Sire… So, the history of technical analysis as application of price charts to monitor price action dates back at least 1000 years and was first documented by Japanese. They used rice as a gauge to estimate supply and demand. Their patterns and charting way, using candlesticks was generally unknown in Europe and US until the 50s. But their popularity has risen significantly to 80s-90s and now candlesticks are highly used in technical analysis.
It worth noting here that Steve Nison has made a major work for popularization of the Japanese approach to technical analysis in US and Europe. His books “Japanese Candlesticks”and “Beyond Candlesticks” remained as bestsellers in this sphere for many years. When we will learn them and you will find on your own experience that candlesticks are suitable for you –we strongly recommend to read these books. They are not so large, by the way, and have a lot of charts. So, you will quickly read them…
But now let’s shift to candles directly. Sometimes they are called like “candles” instead of “Candlesticks” for short.
Let’s remember the previous picture that we’ve already seen before:
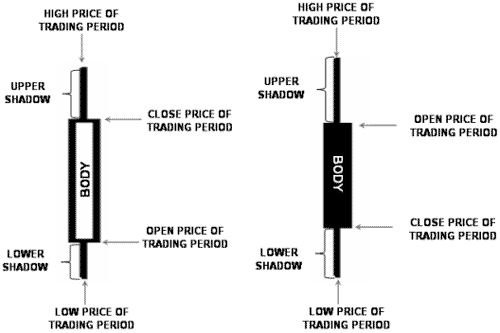
1. Any candle shows the high, low, open and close price for a single trading period, depending on time frame. Say, on monthly chart each single candle presents a single month, on a 5-minute chart – one 5-minute period.
2. If close price is above the open one, i.e. during this particular period that represents by candle, price increases – then the candle has a hollow body (usually painted white or green);
3. If, vice versa, close price below the open one, i.e. during this particular period that is represented by this candle, price decreases – then the candle has a colored (filled) body (usually painted black (Rolling Stones forever!) or red);
4. The colored (filled) part of candle is called “Body”;
5. The spikes (lines) that comes from the body to the upside and downside – thin lines are called “Shadows” and point at:
- high price by the top of upper shadow;
- Low price by the bottom of the lower shadow of a particular period that is represented by the candle.
Comments
Table of Contents
- Introduction
- FOREX - What is it ?
- Why FOREX?
- The structure of the FOREX market
- Trading sessions
- Where does the money come from in FOREX?
- Different types of market analysis
- Chart types
- Support and Resistance
- Candlesticks – what are they?
- Mysterious Fibonacci
- Introduction to Moving Averages
- Bollinger Bands
- Leading and Lagging Indicators
- Basic chart patterns
- Pivot points – description and calculation
- Elliot Wave Theory
- Intro to Harmonic Patterns
- Divergence Intro
- Harmonic Approach to Recognizing a Trend Day
- Intro to Breakouts and Fakeouts
- Again about Fundamental Analysis
- Cross Pair – What the Beast is That?
- Multiple Time Frame Intro
- Market Sentiment and COT report
- Dealing with the News
- Let's Start with Carry
- Let’s Meet with Dollar Index
- Intermarket Analysis - Commodities
- Trading Plan Framework – Common Thoughts
- A Bit More About Personality
- Mechanical Trading System Intro
- Tracking Your Performance
- Risk Management Framework
- A Bit More About Leverage
- Why Do We Need Stop-Loss Orders?
- Scaling of Position
- Intramarket Correlations
- Some Talk About Brokers
- Forex Scam - Money Managers
- Graduation!