Part VI. Detrended Oscillator and Momentum Indicator

Commander in Pips: During previous chapters I’ve said that this or that indicator has some lack in estimating Oversold/Overbought conditions on the market. But today we will discuss a couple of indicators that are perfect for that purpose. I’ve decided to take a look at couple of them, because not all software has them both. So, you will not be frustrated, because at least one of them usually exists. These indicators are very simple. They are – Detrended Oscillator (DOSC), aka just Oscillator, and Momentum. Personally, I use DOSC for estimation of oversold and overbought condition on the market. Also it has some additional ways That it could be used. Metatrader 4 comes with Momentum as one of its built in indicators.

Pipruit: Cool! Finally, because I even thought that I will never find the perfect indicator for oversold/overbought recognition.
Commander in Pips: In the beginning I want to say, that my preferred indicator is DOSC. So, I will talk particularly about it. But, if it turns that your software does not have it – use Momentum. All that I will say about DOSC is absolutely applicable to the Momentum Indicator as well.
So, both DOSC as well as Momentum consist of just a single line. It’s simple. Their math is very simple:
DOSC=Close Price – Some MA (N);
Momentum = Close Price – Close Price N days ago
So, as you can see, there is only one difference – DOSC uses average value of close prices for some period, and momentum pure close price some days ago. Personally, I use for DOSC N=7 and simple MA for averaging, so my formula of DOSC:
DOSC = Close Price – SMA (7);
Pipruit: Commander and why are you so fascinated with them? They are quite simple…
Commander in Pips: Indeed! And this is excellent, that they are perfect. But the major advantage of these indicators is that they are not scaled in the range! So they much better show overbought and oversold during really solid thrusts. I’ll show you:
Chart #1 | EUR/USD weekly DOSC(7); Momentum (7); Stochastic (8; 3; 3
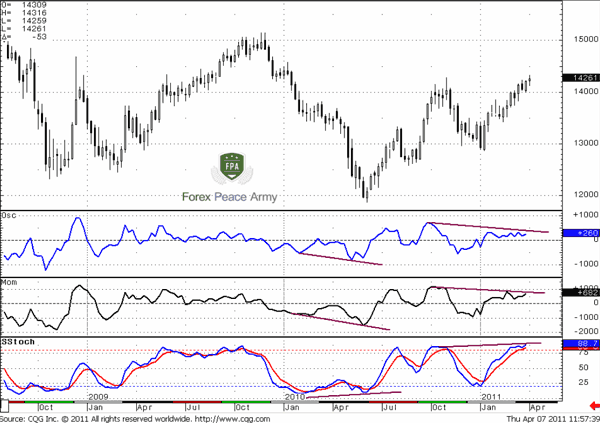
On chart #1 you see obvious comparison scaled Stochastic with non-scaled DOSC (blue line) and Momentum (black line). You should remember this chart – we’ve used it much in current chapter. So, take a look at strong down trend in the beginning 2010. When the market accelerates to the downside in April – both DOSC and Momentum establish new lows and a stronger level of oversold. And now look at what Stochastic has shown – It even has risen! The same is happening now. Take a look – both DOSC and Momentum show that the market is not in overbought condition, but Stochastic is above 75! We can replace Stochastic with any scaled indicator and we will get the same result. I hope that these examples should be enough and the conclusion is obvious – scaled indicators skew the real level of overbought and oversold conditions.Pipruit: But Commander, how we will use DOSC or Momentum, since they are not scaled? How we will estimate when the market is oversold or overbought?
Commander in Pips: This is an excellent question son. But the answer is simple – we will use their historical extreme values:
1. We have to estimate the extreme high (or average of 2-3 highest highs) and the extreme low (or average of 2-3 lowest lows);
2. When DOSC or Momentum will reach an extreme high – then the market is overbought. When it will reach an extreme low – then the market is oversold;
3. You may not use 100% of these extreme high or low of DOSC. You may apply, for instance 80-90% of these levels to make a conclusion that market is overbought or oversold. For instance, if historical DOSC extreme high is 850 points – you may use 90%*850 = 765 points level as overbought. The same is for oversold – if extreme low is, say, “-650” – you may use 90%*(-650) ~ -585 points as oversold;
4. These critical DOSC levels have a tendency to change when market renews DOSC high or low. So when it will happen – you will have to recalculate your extreme levels. This is another great advantage of non-scaled indicators – they are always tracking current market volatility and allow you assess it more clearly.
5. These levels will be different for different time frames and pairs. So, the weekly period has its own oversold/overbought in difference to monthly and daily time frames. You have to calculate them for each time frame that you trade at.
Pipruit: And how far back in history should I apply to estimate extremes?
Commander in Pips: Well, I suppose – not less than 130-150 trading periods (candles). If you will take too much, then it could lead to skewing of real level of overbought and oversold. Because volatility could change in recent times, and applying too far historical volatility data that was much lower/higher could lead to wrong levels for targeting overbought/oversold levels.
Pipruit: Could you give me an example?
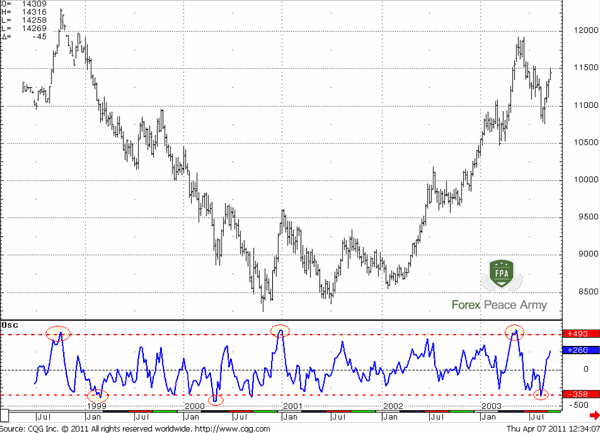
Commander in Pips: Sure, let’s take a look at this EUR/USD weekly chart # 2. We have to use a historical chart, just to see then – how estimated levels have worked in future. According to our algorithm we have to estimate extreme levels for DOSC. I prefer to use not just single value but average of 2-3 extremes. So, I’ve pointed by red ellipses the extreme highs for that historical period and the extreme lows, that we will use for calculation of levels overbought and oversold:
1. Overbought = (532.86 (10.05.1998) + 553(02.01.2001) + 559(05.19.2003))/3 = 548.28 ~548 points
2. Oversold = (-386.71 (03.01.1999) - 442(05.01.2000) – 365(08.18.2003))/3 = -397.90 ~ -398 points
3. We will use 90% from both of them. Hence our overbought = 548*90% = 493 points and oversold = -398*90% = -358 points.
So, let’s mark this level on the chart. When market will approach to these areas – we will suggest that it overbought or oversold.
Chart #2 | EUR/USD weekly DOSC(7)
And now we will check how it works – the green vertical line shows where our future has begun.Chart #3 | EUR/USD weekly DOSC(7)
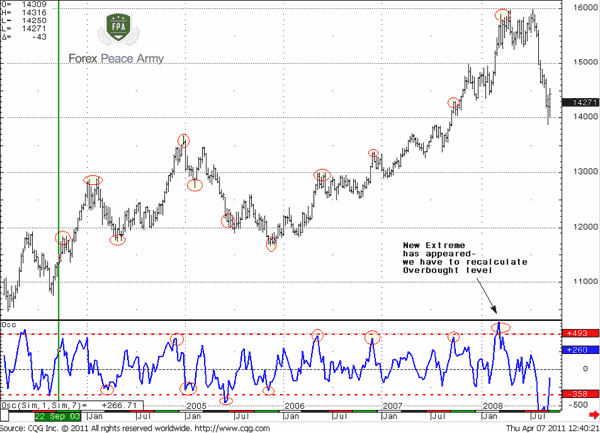
Results you can evaluate by yourself…
Pipruit: This is tremendous results, especially if we take into consideration really strong upward trend. Every time, when DOSC shows overbought level – when it reaches the upper border at 493 points, the market shows some pause in move or retracement, till DOSC corrects lower. The same is true for oversold. DOSC catches every peak in uptrend! This is really outstanding.
Commander in Pips: I’m glad that you like it.
Pipruit: And how we can apply it? Sell at overbought and buy at oversold?
Commander in Pips: Not quite. DOSC is a fine tuning tool and demands more delicate uses. You can’t just buy or sell due DOSC because it doesn’t show trend! This will be a mistake if you’ll do this. You should use it as additional tool in your overall trading context. Here is how it could be done.
DOSC APPLICATION
Overbought/oversold estimation
1. When DOSC reaches 75-100% of oversold/overbought level, i.e. its extremes – close position. Let’s suppose that you hold Long position. After some time market shows significant thrust up and DOSC hits 90% from it extreme high. It’s time to take profit;
2. Level of oversold/overbought should be estimated on daily or higher time frames. This is just safer. You can apply DOSC on intraday charts also, but there is has a tendency to change extremes much more often;
3. If, for instance you trade on intraday charts, and daily DOSC is close to extreme - then you should apply the nearest intraday profit targets. It could be intraday 0.618 Fib extensions or previous highs – they hardly will be taken out due to daily overbought condition. The same is true for oversold.
4. If market reached Oversold or Overbought and does not bounce – stays with it or continues to creep higher/lower, then it tells us that the market is very strong in that direction and this move should continue. Forex is financial market and financials very rare stand at overbought/oversold levels for a long time.
5. Higher time frames overrule lower time frames. Assume that market is oversold on weekly time frame. In this case it could lead to significant break of daily overbought level, so daily DOSC could establish new highs during an upside retracement on the weekly time frame.
Filter entry points
You should not enter long when DOSC is near extreme high and shows that the market is overbought. As well as you should not enter short when DOSC is near an extreme low and shows that the market is oversold.
Check it here – assume that you use 25-period SMA for trend identification. When price is above the MA – the trend is bullish and you search for the possibility to enter long, when price is below the MA – the trend is bearish, and you want to go short. But what’s a pity – where to enter?
DOSC allows you to filter unwelcome entry points. Check chart #4 – every time, when trend holds but DOSC at an extreme – the market shows solid retracement, that you do not want to enter. But when DOSC is not at extreme – entry points are much safer.
Chart #4 | EUR/USD weekly DOSC(7) and SMA(25) – filtering entry points
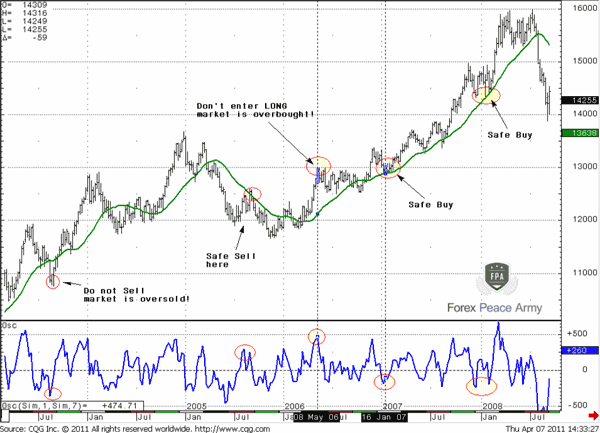
I’ve pointed not all points – just some of them, to show how you could apply DOSC (or Momentum) in this way.Stop placing
You can use extreme values for estimation the levels for stop placement. For instance if you intend to enter Long and DOSC shows that market is 70% oversold. You may place stop beyond 100% oversold. But control your risk, because depending on volatility this stop could be really far away. I better call this stop as “for catastrophe”. Also, if you trade intraday – you may choose daily levels of overbought/oversold to place stops beyond them. Understand, this stop will not be triggered too often. Only if the market will break its level of overbought/oversold. But if it will happen – it means that situation on the market has changed drastically and your position has turned to the wrong one anyway.
Another way to apply DOSC in this way is to build it not on close prices but on high prices or low prices. If, for instance, you intend to enter Short and market is overbought, then you can draw DOSC, based on high prices = High – SMA (7) by highs. It will be slightly higher than DOSC based on close prices. If you will place stop above this level – it will be very logical, because market will not trigger it occasionally, only if really something bad happens. The same is for DOSC based on Low prices.
Combination of Overbought/oversold and Support/resistance levels
This strategy is relatively simple. Joe DiNapoli calls it “Stretch”.
1. If the market reaches overbought based on DOSC value right at some resistance (simple line or Fibonacci level) – then there is high probability, that the market will bounce down from this area or at least turn to sideways, despite the trend direction, that could be strongly upward.
2. If the market reaches oversold based on DOSC value right at some support (simple line or Fibonacci level) – then there is high probability, that the market will bounce upward from this area or at least turn to sideways, despite the trend direction that could be strongly downward.
3. It counts that this combination is still in play, until DOSC will not reach zero level. So, if you have taken this signal and entered, say, short from (overbought + Fib resistance) combination – you will have to close position when DOSC will reach the zero level, despite at current profit or loss on your position. Because the market can stand in the range but DOSC moves to zero anyway. In this combination you will probably get some loss.
Check this chart and all will become clear:
Chart #5 | EUR/USD weekly DOSC(7) and SMA(25)

Look – trend is bullish, because market is strongly above 25-period SMA. But here you suddenly see that market has hit 0.618 Fib resistance and DOSC hit at the same time high extreme. So market is overbought at a Fib resistance level! You’ve entered short. When DOSC decrease to zero - you’ve exited from short trade – trend is still bullish! So you have no reason to hold short position any longer.By the way – this is weekly chart, so 300 pips for couple of weeks, not bad ha?
4. Since this kind of trade is always in opposite direction to the major trend – you should exit quickly. In fact, we may call it a “scalp” trade compared to the time frame. In other words – this trade is just an attempt to play on retracement under some predefined circumstances - a combination of DOSC extreme and some support/resistance level at the same time. If something goes wrong – exit immediately – because your position here is against the major trend!
5. This signal works better if there is a combination of 0.618 level rather than 0.382 Fib level
Volatility Breakout (VOB)
This strategy is better applied for long-term charts (monthly, weekly). If DOSC for a long time shows and holds some level of overbought/oversold and then suddenly breaks it by estimating new extreme levels (preferably if DOSC doubles its previous extremes), then we should wait for a 0.618 retracement after the DOSC breakout and enter in the direction of the breakout. The reason is that Volatility change of pace is usually faster than price, so a Volatility extreme appears earlier than price one. As a target you may use the new extreme DOSC level, some Fib extensions or others.
Pipruit: Thanks, Commander. This is outstanding material.
Commander in Pips: You’re welcome. I hope it helps.
Pipruit: I see. And why are you so fascinated with DMA?
Comments

AsstModerator
12 years ago,
Registered user
I have a surprise for you. Here is Sive's personal version of the DOSC indicator for MT4. He paid to have it custom written. He's checked the math and is sure that it works.
https://www.forexpeacearmy.com/community/attachments/dosc-ex4.3797/
To use this copy of DOSC, do the following...
Download the file. You will need to be logged into your forums account to do this.
Put it in the experts/indicators subfolder of your copy of MT4.
Restart MT4.
Pick the chart you want to attach it to.
Click Charts, Indicators, Custom. Select DOSC.

fanioz
12 years ago,
Registered user
Hi Sive,
The example for weekly chart above uses 7 bar. Would you recommend, the DOSC period number to be used on daily chart. Or perhaps H4.
Thanks
The example for weekly chart above uses 7 bar. Would you recommend, the DOSC period number to be used on daily chart. Or perhaps H4.
Thanks

Sive Morten
12 years ago,
Registered user
> Hi Sive,
The example for weekly chart above uses 7 bar. Would you recommend, the DOSC period number to be used on daily chart. Or perhaps H4.
Thanks
Hi Fanioz,
I use 7-period parameter for all time frames, but, I rare look at overbought/oversold on intraday charts. You may try others - it could be different, depending on trading style.
A
adedayo
12 years ago,
Registered user
estimating extreme using momentum
Hi Sive,
To estimate extreme using momentum say on a weekly chart do I follow exactly the same method you used for the DOSC?
That is average 2-3 extreme and use 90%?
Thanks.
Hi Sive,
To estimate extreme using momentum say on a weekly chart do I follow exactly the same method you used for the DOSC?
That is average 2-3 extreme and use 90%?
Thanks.
Sive Morten
12 years ago,
Registered user
> Hi Sive,
To estimate extreme using momentum say on a weekly chart do I follow exactly the same method you used for the DOSC?
That is average 2-3 extreme and use 90%?
Thanks.
Yes, method is the same. You can vary as with DOSC the percents from extreme. But it should be not less than 75-80%.
To estimate extreme using momentum say on a weekly chart do I follow exactly the same method you used for the DOSC?
That is average 2-3 extreme and use 90%?
Thanks.
Yes, method is the same. You can vary as with DOSC the percents from extreme. But it should be not less than 75-80%.

DJG
12 years ago,
Registered user
Thanks Sive! much appreciated ! :)
DG
DG
J
Jacques Pienaar
12 years ago,
Registered user
Thank you very much
L
LeFrog
12 years ago,
Registered user
Many thanks for your generous gift.
Kind thought
Kind thought
S
Sazu
12 years ago,
Registered user
Detrend Oscillator for NinjaTrader or Trade Navigator
Hello Sive,
Is there a way I can get this Indicators to work on either NinjaTrader or Trade Navigator?
Thanks Sazu
Hello Sive,
Is there a way I can get this Indicators to work on either NinjaTrader or Trade Navigator?
Thanks Sazu
Sive Morten
12 years ago,
Registered user
> Hello Sive,
Is there a way I can get this Indicators to work on either NinjaTrader or Trade Navigator?
Thanks Sazu
Hi Sazu,
Hm, I do not know about Ninja trader, but Trade Navigator has to have it. Probably it could call as just Oscillator.
Besides, in Trade Navigator you can subscribe to whole DiNapoli indicators pack.

grahamFPA
12 years ago,
Registered user
Individual Time Frames
Most people will probably already know this but for those who don't:
If you apply the indicator to the chart, work out the extreme levels and enter them in the "Levels" tab (ie +222, 0, -290) and then tick/check the specific time frame in the "Vizualization" tab. The indicator with those setting will only appear on that specific time frame.
You can then select another time frame, apply the indicator again and go through the same process again.
This way the high/low indications will be correct for each time frame.
I hope this helps :)
J
Jyotiprakash Pal
12 years ago,
Registered user
:) its an amazing indicator .. leathal with b.band
Screenr - Papi: Amazed!
here is the video .. for visual backtest!
amazing and easy .. thanks sive sir! :D
Screenr - Papi: Amazed!
here is the video .. for visual backtest!
amazing and easy .. thanks sive sir! :D
M
MBPAC94
12 years ago,
Registered user
how do you apply this to the metatrader chart once downloaded? ie what folder do I copy it into?
thanks
thanks
G
gibson
12 years ago,
Registered user
Hello Mr. Sive
Thanks for this your efforts in educating us. I am really grateful. God will surely reward you.
Please Sive, I want to know how to set overbought and oversold number (493 and -358) in my meta4.
also, the zero point (0) i see in your chart is not in my own chart after ploting the DOSC.
thanks
Thanks for this your efforts in educating us. I am really grateful. God will surely reward you.
Please Sive, I want to know how to set overbought and oversold number (493 and -358) in my meta4.
also, the zero point (0) i see in your chart is not in my own chart after ploting the DOSC.
thanks
S
Sazu
12 years ago,
Registered user
Di Napoli
Hello Sive,
Thank you for taking the time to respond about the Detrend Osc. I do use the the DiNapoli tool set but up until recently I was having a hard time setting them up properly. Thanks to you I have been able to understand and set them up with favorable results.
However, I am still not convinced that the tool set is worth the money I am paying to rent them. The only real advantage I see with the Di Napoli Fib tool is that it makes it simple to determine a confluence level. I like using the Original Fib Retrace tool as it makes me really think about where I am placing the reference points, thus I feel I learn a little better.
Regardless watching you I have been able to put it all together.
Thanks again,
Sazu
R
ron lawley
12 years ago,
Registered user
Detrended oscillator file
Hi Sive,
Thanks for your forex instruction course. It is the best I have seen so far.
I have a problem with the DOSC file. Although I have pasted it into the indicators folder it does not appear on the MT4 platform indicators list.
I notice that all the other indicators in the list have another file that goes with them. It is a metaquotes language 4 file with a yellow sign with an exclamation mark in the middle.
I have had this problem before with downloaded files.Any ideas on how to fix it.
Maybe it is a problem with my computer.
Thanks for your help so far, it is much appreciated.
Yours
Ron
R
ron lawley
12 years ago,
Registered user
DOSC file
Sorry false alarm .
When I first installed the file it didn't work but now I have tried again after turning off the computer and starting up again it does work so thats great. I will have fun trying it out.
All the best
Ron
Sorry false alarm .
When I first installed the file it didn't work but now I have tried again after turning off the computer and starting up again it does work so thats great. I will have fun trying it out.
All the best
Ron

Howard G.
12 years ago,
Registered user
Hello Sive,
As always, thank you for your time and expertise. I have downloaded your custom indicator and will be using it and studying the results immediately. Would I be correct to assume good results on an intraday chart (1hr, 4hr) if it is in harmony with the daily and weekly as well? Or, are you saying that regardless, the results would be unreliable on intraday charts or for scalpers? As to my style of trading, I review and use the analysis from the higher timeframes, but I do not trade long-term positions normally. I'm hoping this indicator will be of benefit to day trading and short-term swing trading.
Thank you.
All the best,
Howard

Pharaoh
12 years ago,
Registered user
> Sorry false alarm .
When I first installed the file it didn't work but now I have tried again after turning off the computer and starting up again it does work so thats great. I will have fun trying ..
Restarting MT4 would probably have been enough. Then again, 90% of all computer issues can be resolved by rebooting the computer.
:D
Sive Morten
12 years ago,
Registered user
> how do you apply this to the metatrader chart once downloaded? ie what folder do I copy it into?
thanks
Hi MBPAC94
experts/indicators - read the first post right below educational text for more details.
> Thanks for this your efforts in educating us. I am really grateful. God will surely reward you.
Please Sive, I want to know how to set overbought and oversold number (493 and -358) in my meta4.
..
Hi Gibson,
to draw a zero line, you just need to enter in tuning menu of indicator and add zero level: right click on indicator's line chart, then DOSC properties, then Levels - Add - and appoint what level would you like to add.
Speaking about setting numbers, I do not quite understand you, probably.
DOSC shows you extremes, you just have to choose 2-3 ultimate extremes from them, find their average and draw horizon lines to mark oversold and overbought levels. You may do it via the same menu as to plot zero line.
May be it makes sense to re-read educational material - this procedure was described there in details.
> Hello Sive,
Thank you for taking the time to respond about the Detrend Osc. I do use the the DiNapoli tool set but up until recently I was having a hard time setting them up properly. Thanks to you..
Well, Sazu, D-Levels have two advantages - first they do not make your chart heavy, when you have to watch over large number of them, second, it's much easy and fast to read them at fast charts, say 5-min, when you need time to think and act but not to draw levels.
But in general, yes, you can use simple Fib levels.
> Hello Sive,
As always, thank you for your time and expertise. I have downloaded your custom indicator and will be using it and studying the results immediately. Would I be correct to assume good ..
Hi Howard,
of cause you may. The major reason why I rare apply it on intraday charts is that they renew extremes much oftener and this "renew" could be significant. On calm market DOSC work well with any time frame. But when Market turns in some solid move then daily+ time frame will dominate over intraday charts.
Besides, there will be another levels of overbought/oversold for intraday charts, particularly for any timeframe they will be unique.

CanAm
12 years ago,
Registered user
Hi Sive
I downloaded using the link in the post but when I try to open it I get an error message trying to go to a gmail address - has the file become corrupted/hacked (my machine is clear).
Cheers
Seth
I downloaded using the link in the post but when I try to open it I get an error message trying to go to a gmail address - has the file become corrupted/hacked (my machine is clear).
Cheers
Seth
AsstModerator
12 years ago,
Registered user
I rechecked and it seems normal.
Don't open it. Download it and copy it to the correct folder given in the instructions.
Don't open it. Download it and copy it to the correct folder given in the instructions.
M
Mike42
12 years ago,
Registered user
> I have a surprise for you. Attached is Sive's personal version of the DOSC indicator for MT4. He paid to have it custom written. He's checked the math and is sure that it works.
To use this copy..
I tried to load this and it did not work, can you post this as an mq4 file or explain how to get a .ex4 to work ... restarted mt4...even restarted the computer... there is an expert folder and an indicator folder within the expert folder, have no "expert/indicator" folder by itself. I tried both folders and neither worked. Putting it in expert folder makes it show up on the expert advisor list and putting it in the indicator folder makes it show up on the custom indicator list but it will not show any lines when clicking and opening a new indicator window. Thanks, Mike
fanioz
12 years ago,
Registered user
:)
hello Sive, thanks for the "DOSC", I've download it and it works.
About the setting. Using momentum or DPO the parameter needed was bar period. But DOSC has Slow MA and Fast MA. Is it something like ma cross or divergence here ?
hello Sive, thanks for the "DOSC", I've download it and it works.
About the setting. Using momentum or DPO the parameter needed was bar period. But DOSC has Slow MA and Fast MA. Is it something like ma cross or divergence here ?
fanioz
12 years ago,
Registered user
> ......putting it in the indicator folder makes it show up on the custom indicator list but it will not show any lines when clicking and opening a new indicator window....
Hi Mike, That's the correct setup already, while the line color is blue, make sure your chart background isn't blue, or just change the DOSC color line instead :)
Hi Mike, That's the correct setup already, while the line color is blue, make sure your chart background isn't blue, or just change the DOSC color line instead :)
Sive Morten
12 years ago,
Registered user
> :)
hello Sive, thanks for the "DOSC", I've download it and it works.
About the setting. Using momentum or DPO the parameter needed was bar period. But DOSC has Slow MA and Fast MA. Is it something ..
No Fanioz,
this is just difference between MA's - we've specified formula in education text.
hello Sive, thanks for the "DOSC", I've download it and it works.
About the setting. Using momentum or DPO the parameter needed was bar period. But DOSC has Slow MA and Fast MA. Is it something ..
No Fanioz,
this is just difference between MA's - we've specified formula in education text.
M
Mike42
12 years ago,
Registered user
> Hi Mike, That's the correct setup already, while the line color is blue, make sure your chart background isn't blue, or just change the DOSC color line instead :)
Thanks, fanioz. but the indicator lines don't show, mt4 will crash with the indicator window open while changing time frames. Perhaps the build I'm using for mt4 has a problem with .ex4 files, because this has happened with other .ex4 files I've tried to load. Anyway, I searched online and found the Dinapoli Price Oscillator which works and appears similar in action. Like it so far ... with a little tweaking ... will see.
Thanks, fanioz. but the indicator lines don't show, mt4 will crash with the indicator window open while changing time frames. Perhaps the build I'm using for mt4 has a problem with .ex4 files, because this has happened with other .ex4 files I've tried to load. Anyway, I searched online and found the Dinapoli Price Oscillator which works and appears similar in action. Like it so far ... with a little tweaking ... will see.
M
Muyen
12 years ago,
Registered user
Hi Sive Please how can I Put levels upper and lower on the DOSC indicator window?
Thanks.;)
Thanks.;)
Sive Morten
12 years ago,
Registered user
> Hi Sive Please how can I Put levels upper and lower on the DOSC indicator window?
Thanks.;)
High Muyen,
first, calculate them as we've described in educational part.
Then enter in indicator's tuning menu and click at add levels - add those that you want to.
Thanks.;)
High Muyen,
first, calculate them as we've described in educational part.
Then enter in indicator's tuning menu and click at add levels - add those that you want to.
M
Muyen
12 years ago,
Registered user
> High Muyen,
first, calculate them as we've described in educational part.
Then enter in indicator's tuning menu and click at add levels - add those that you want to.
Thanks I got it, Sive!! I am very very obliged,I have done some back testing by September ending I will send you my result.
Thanks again!;)
first, calculate them as we've described in educational part.
Then enter in indicator's tuning menu and click at add levels - add those that you want to.
Thanks I got it, Sive!! I am very very obliged,I have done some back testing by September ending I will send you my result.
Thanks again!;)
1
1954
12 years ago,
Registered user
DOCs
Hello Sive,
Thank you for DOCs indicator. If I am to use it for GU, would the fast n slow MA remain the same ?
Regards
Peter
Hello Sive,
Thank you for DOCs indicator. If I am to use it for GU, would the fast n slow MA remain the same ?
Regards
Peter
Sive Morten
12 years ago,
Registered user
> Hello Sive,
Thank you for DOCs indicator. If I am to use it for GU, would the fast n slow MA remain the same ?
Regards
Peter
Hi Peter,
I use the same numbers with all markets, but this is a bit personal, since you may use this indicator differently. At least you may try different numbers...
Thank you for DOCs indicator. If I am to use it for GU, would the fast n slow MA remain the same ?
Regards
Peter
Hi Peter,
I use the same numbers with all markets, but this is a bit personal, since you may use this indicator differently. At least you may try different numbers...

Yangwoo Park
12 years ago,
Registered user
What's the relation between Detrended Price Oscillator (DPO) and this DOSC? I see DPO with 3 period and Siva's DOSC with 7 period are almost identical.
Sive Morten
12 years ago,
Registered user
> What's the relation between Detrended Price Oscillator (DPO) and this DOSC? I see DPO with 3 period and Siva's DOSC with 7 period are almost identical.
Hi Yangwoo,
Detrended OSCillator is DOSC.
Hi Yangwoo,
Detrended OSCillator is DOSC.

Venelin
12 years ago,
Registered user
Hi Sive,
From your experience is DOSC applicable as divergence with price extremes on smaller time frames?
Thank you!
From your experience is DOSC applicable as divergence with price extremes on smaller time frames?
Thank you!
Sive Morten
12 years ago,
Registered user
> Hi Sive,
From your experience is DOSC applicable as divergence with price extremes on smaller time frames?
Thank you!
Hi Venelin,
I rare rely on divergences at all, only if they appear at some significant level. Mostly I use divergence on MACD and not on DOSC.
It works on any time frame on FOREX. But, read the chapter. I usually determine oversold/overbought condition according to DiNapoli technique - not lower than on daily time frame. But if you will take a look at it on lower time frame - you also will see that market meets support resistance at extreme numbers of DOSC.
Venelin
12 years ago,
Registered user
Hi
May I ask fellow forumers to share their calculations of Mt4 Dosc for EUR/USD?! Mine are daily ob/os = 207/-280 and weekly ob/os =735/-792! I just want to make sure every one has approximate levels as mine!
Thank you in advance!
May I ask fellow forumers to share their calculations of Mt4 Dosc for EUR/USD?! Mine are daily ob/os = 207/-280 and weekly ob/os =735/-792! I just want to make sure every one has approximate levels as mine!
Thank you in advance!
Sive Morten
12 years ago,
Registered user
> Hi
May I ask fellow forumers to share their calculations of Mt4 Dosc for EUR/USD?! Mine are daily ob/os = 207/-280 and weekly ob/os =735/-792! I just want to make sure every one has approximate levels..
Sure you can. But as you understand, they are not constant forever - they have a tendency to change. Also it could be slightly different, because someone can take 80% of OS/OB, while other will take 90%.
M
metajuwa ibukun
11 years ago,
Registered user
can someone pls explain, what is meant by highest point and lowest point, is it highest price and lowest price?
Sive Morten
11 years ago,
Registered user
> can someone pls explain, what is meant by highest point and lowest point, is it highest price and lowest price?
Hi Metajuwa
Highest and Lowest point of DOSC for 130-150 periods. They measure breath of market. For example, if highest point of DOSC for 150 periods, say 580 - when market will reach such price, so that DOSC=580, you can say that market is overbought. The same is for oversold.
You know only DOSC number but do not know precise price when it will happen. Actually there is no definite price for that, this is dynamic level. Dosc may hit 580 as at 1.20 of EUR/USD as 1.60. IT depends on previous price action. But if DOSC will hit 580, it will mean that market is overbought, no matter what particular level holds on market currently.
D
Divinorum
11 years ago,
Registered user
Hi Sive - thanks for the dosc.ex4 oscillator.
S
Synq
11 years ago,
Registered user
DOSC Indicator
> I have a surprise for you. Attached is Sive's personal version of the DOSC indicator for MT4. He paid to have it custom written. He's checked the math and is sure that it works.
To use this copy..
Thanks, Sieve......
I tried to download the indicator thru the above links.....I only saw a php file named "attachment.php" .thanks in advance
pls how do i go about this...
Sive Morten
11 years ago,
Registered user
> Thanks, Sieve......
I tried to download the indicator thru the above links.....I only saw a php file named "attachment.php" .thanks in advance
pls how do i go about this...
Hm, I've just checked - link is functional. Just click on inidicator's file name. DOSC.ex4
I tried to download the indicator thru the above links.....I only saw a php file named "attachment.php" .thanks in advance
pls how do i go about this...
Hm, I've just checked - link is functional. Just click on inidicator's file name. DOSC.ex4
M
Marky$
11 years ago,
Registered user
Dosc ob/os
Hi Sive,
After having read that lesson I wrote my own DOSC indicator for MT4.
It draws OB/OS zones.
The parameters are:
DOSC=Close-SMA(7)
Bars for OB/OS zones = 150
My concept for OB/OS zones is to calculate mean and standard deviation (SD) for last 150 bars.
Then indicator draws OB/OS zones offset from mean for SD. You can set deviation value (SD parameter in indicator, deafult is 1.5).
The zones are red (sell) for OB and green (buy) for OS.
I wrote this because I love to automate everything ;) and in your method of calculation you have to calculate the zones manualy.
In my indicator when you change Time Frames, zones will change. They also are updated with each new bar.
What do you think about that concept of using standard deviation for OB/OS zones calculation?
I encourage everyone to test attached indicator and post your opinions.
I'd appreciate each of them.
W
Wilsontom
11 years ago,
Registered user
> Hi Sive,
After having read that lesson I wrote my own DOSC indicator for MT4.
It draws OB/OS zones.
The parameters are:
DOSC=Close-SMA(7)
Bars for OB/OS zones = 150
My concept for OB/OS zones is to ..
------------------------------
Hi Marky$,
I'm testing yours and Sive's DOSC side-by-side. I like your colourful interface and % zones of OB/OS already calculated. That's cool! Sive's one is also very good and helpful. Will keep you posted on my test results. Cheers to Sive and Marky$. Thanks very much guys, much appreciated.
B
Bernhard33
10 years ago,
Registered user
> Hi Sive,
After having read that lesson I wrote my own DOSC indicator for MT4.
It draws OB/OS zones.
The parameters are:
DOSC=Close-SMA(7)
Bars for OB/OS zones = 150
My concept for OB/OS zones is to ..
it does not look to me to be the same line as DOSC
[ATTACH]12859.vB[/ATTACH]
After having read that lesson I wrote my own DOSC indicator for MT4.
It draws OB/OS zones.
The parameters are:
DOSC=Close-SMA(7)
Bars for OB/OS zones = 150
My concept for OB/OS zones is to ..
it does not look to me to be the same line as DOSC
[ATTACH]12859.vB[/ATTACH]
G
geehog
9 years ago,
Registered user
> I have a surprise for you. Attached is Sive's personal version of the DOSC indicator for MT4. He paid to have it custom written. He's checked the math and is sure that it works.
To use this copy..
I have coded an indicator that plots the 80%, 90%, 100% levels on the DOSC indicator window as Sive showed us how to calculate in this lesson. The indicator paramaters should be self explanatory. I have attached it here.
To make this indicator work, you first need to have the DOSC indicator on your chart then add this indicator.
[ATTACH]16396.vB[/ATTACH]
T
toconar
9 years ago,
Registered user
Thank you for the gift and education!
O
Oluwaseun
8 years ago,
Registered user
Thank you so much for this wealth of information

Grindin4pips
7 years ago,
Registered user
> I have coded an indicator that plots the 80%, 90%, 100% levels on the DOSC indicator window as Sive showed us how to calculate in this lesson. The indicator paramaters should be self explanatory. I ha..
Unfortunately, this indicator will not properly attach to my MT4 terminal ( v 4.00 Build 985; 01 Jul 2016). When placed in the MetaEditor (v 5.00 Build 1350 ; 28 Jun 2016) and compile it, two errors are found:
[I]Description File Line Column
'dt1' - undeclared identifier Geehog_DOSCLevels.mq4 42 4
'dt2' - undeclared identifier Geehog_DOSCLevels.mq4 42 27
[/INDENT]
Also, many Thanks to Sive, Geehog and Marky$ (will test your indicator shortly) for your kind contributions to this forum!
S
shappons
6 years ago,
Registered user
hi Sive,
my question may be over due...
IN chart #5 is that telling me i should exit any/all of the trades when DOSC hit level zero?
Thank you.
my question may be over due...
IN chart #5 is that telling me i should exit any/all of the trades when DOSC hit level zero?
Thank you.

Hamza Samiullah
6 years ago,
Registered user
Nice Lesson..
O
One-fm
5 years ago,
Registered user
Thanks for this great tool.

Texaco14
5 years ago,
Registered user
Thanks for the indicator and lesson.
Table of Contents
- Introduction
- FOREX - What is it ?
- Why FOREX?
- The structure of the FOREX market
- Trading sessions
- Where does the money come from in FOREX?
- Different types of market analysis
- Chart types
- Support and Resistance
- Candlesticks – what are they?
- Mysterious Fibonacci
- Introduction to Moving Averages
- Bollinger Bands
- Leading and Lagging Indicators
- Basic chart patterns
- Pivot points – description and calculation
- Elliot Wave Theory
- Intro to Harmonic Patterns
- Divergence Intro
- Harmonic Approach to Recognizing a Trend Day
- Intro to Breakouts and Fakeouts
- Again about Fundamental Analysis
- Cross Pair – What the Beast is That?
- Multiple Time Frame Intro
- Market Sentiment and COT report
- Dealing with the News
- Let's Start with Carry
- Let’s Meet with Dollar Index
- Intermarket Analysis - Commodities
- Trading Plan Framework – Common Thoughts
- A Bit More About Personality
- Mechanical Trading System Intro
- Tracking Your Performance
- Risk Management Framework
- A Bit More About Leverage
- Why Do We Need Stop-Loss Orders?
- Scaling of Position
- Intramarket Correlations
- Some Talk About Brokers
- Forex Scam - Money Managers
- Graduation!