Part IV. Retracements and Reversals

Chart #1 | 60-min EUR/USD Is it right time to buy?
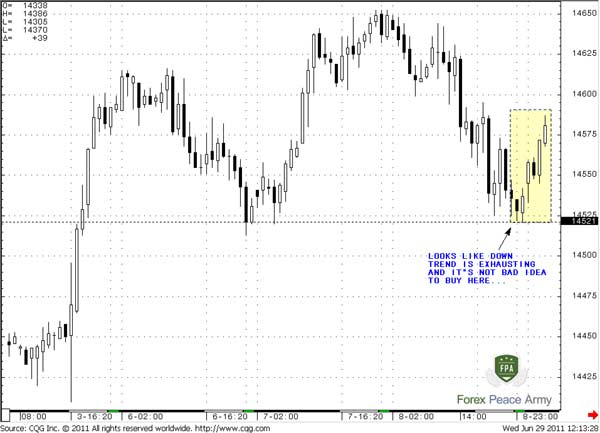
Here we see nice classical support line, see some acceleration to the upside. All that we have to do is just wait some shallow retracement and buy, right?
Pipruit: Right.
Chart #2 | 60-min EUR/USD I guess not
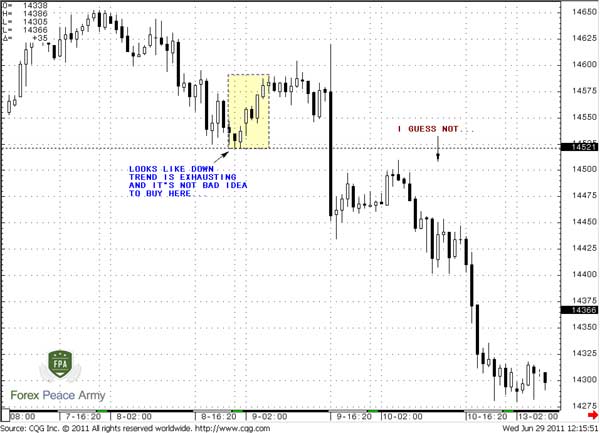
Pipruit: Well, that is a current concern. Something like that I catch again and again on my demo account. I think we need to discuss some clues to estimation what is it – either retracement or reversal.
Ok, what is a retracement – this is short-term moves against the trend. In other words, the market makes so-called pullbacks, but then returns to trend continuation. Still this definition is too blurring. We need to capture some details of trend movement to catch some qualities of retracement.
Reversal instead is a permanent or at least long term change in overall trend direction.
Here is a picture, where we see two reversal points in circles and many retracements as on up trend as on down trend:
Chart #3 | 60-min EUR/USD reversals and retracements
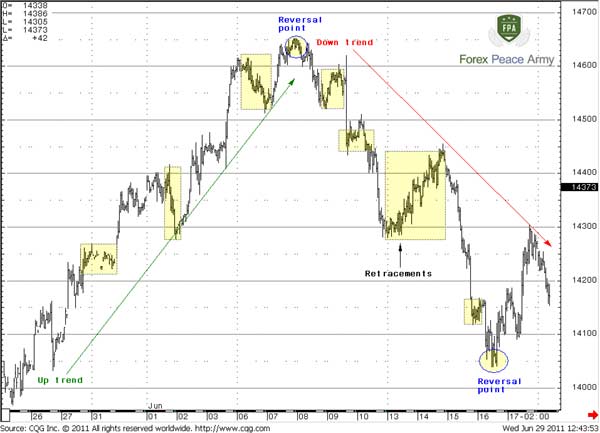
Commander in Pips: Well, speaking about potential position you can hold it, close and try to re-enter on retracement or close it totally. Depending on what price action will take place you will get different result. Also it worth to note here, that applying trailing stop order is not a bad idea when you intend to hold your position through retracement. But this is a bit o a personal issue – what to do with position. Better is to focus on the signs and properties to tell retracement from reversal. They are not absolute, as you understand, but still they will help you much to make right decision more often and not to fall in big losses.
Properties of Retracements
1. Usually retracement happens after some previous strong move;
2. Retracement should stop at some Fib retracement level, usually they are 0.382; 0.5; 0618. If market shows deeper retracement, say, 0.786 or even 0.88, then it tells that the current tendency becomes weaker;
3. Retracement usually takes place during macro data or news silence. In other words, when fundamentals do not change;
4. Using of pivot points can help in retracement identification. As we’ve said early, in an uptrend, the market when turns into retracement, corrects to pivot support 1, in a downtrend – to pivot resistance 1. If the market during retracement reaches to deeper pivot points, then it could become an early sign of a possible reversal approaching.
5. Retracement is usually accompanied with some continuation patterns, say, Gartley “222”, flags, pennants, triangles etc.
6. You may use trend by MACD as additional indicator of retracement. Sometimes, when the market turns to retracement and reaches some Fib level – MACD holds the trend unchanged. This is one of the indicators of possible continuation. Even if the trend has changed, you may wait for when it will reestablish again and enter on smaller retracement on lower time frame.
7. Long trend lines and channels could give great help, since the market should not break it in case of retracement;
8. The market should not break strong areas, such as Confluence and/or Agreement, if this really retracement;
9. Retracement could be accompanied by hidden divergence; 10. Swing in direction of the trend will always be greater than countertrend swings in the case of retracement. 11. Very often previous swing highs/lows act as support/resistance during the trend. So, as a rule (but not always) following retracements will not move below them, as on chart #4.
Properties of Reversals
As you understand they will be the opposite of retracement ones:
1. Reversal could happen at any time, but it’s much harder to come after some previous strong move, since market still has an opposite momentum. Still, sometimes it could happen;
2. If reversal happens, it leads to much longer term movement in the opposite direction compared to retracement;
3. As a rule reversal often happens by impact of unexpected news or macro data. In other words, when fundamentals do change;
4. In most cases reversals are accompanied by some reversal patterns – H&S, Double Top/Bottom, Butterfly, 3-Drive, wedge, broadening top/bottom etc. Any of these patterns could include and, as a rule, include reversal candlestick patterns.
5. Appearing of reversal near strong support/resistance of a higher time frame is more probable. Very often such kind of reversals accompanied by standard divergence;
6. As reversal point becomes closer, the market starts to show deeper retracements to 0.786 and 0.88, then at last breaks all Fib retracement levels and reverses;
7. If market breaks pivot support 1 in bull trend or pivot resistance 1 in bear trend – it could be an early sign of reversal;
8. Long-term trend lines or price channels, if broken, could be an early sign of reversal;
9. If the market breaks strong area of higher time frame, say, daily time frame market breaks weekly confluence resistance + Agreement during retracement, as it seems, in bear trend – this tells that market is stronger than it seems and probably this is not just a retracement; 10. When the market shows swing in opposite direction greater than previous swing in direction of trend – this is early sign of reversal.
Ok, let’s take a look at real examples of as upward trend action as downward trend:
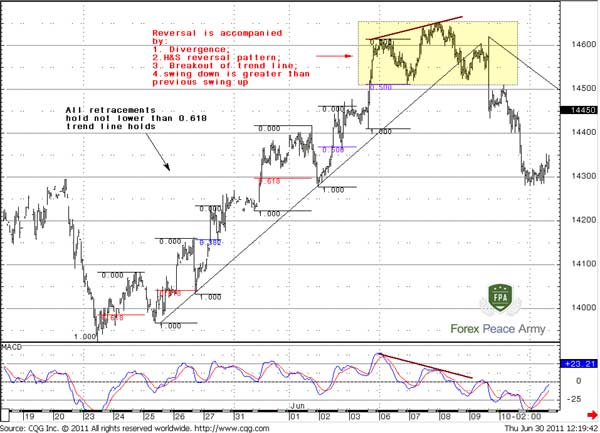
On chart #4 is the same price action as on chart #3, precisely only upward part of it. Here you can see all of the signs that we’ve just discussed. Take a note that during retracements – all pullbacks hold not lower than 0.618 Fib support levels. Also, the trend line holds. Suddenly you get two early notification of possible reversal – divergence and a move down from the top of the Head (since you don’t know yet, that this could be H&S) that is as great as the previous move up. At the end of this move you get third note – break of the trend line.
Commander in Pips: Absolutely. See, it’s not so difficult. The most difficult in reversal points is not just to see signs of reversal, but to believe in them. When you see some trend day by day, your mind and eyes mechanically look for continuation and sometimes it’s hard to believe in reversal even when you see obvious signs. That’s why is always better to make an analysis in a calm situation – during the weekend or in the evening when you’re not in trading.
Commander in Pips: Now let’s move to continuation – chart #5:
The first confirmation you’ve got is with reverse H&S pattern right at the bottom. Also, you can see that when right shoulder was forming, the swing up was greater than previous swing down – this is also a confirmation sign of reversal. Also at this time the market was turmoil around the Greece default. The macro picture was changing every day.
But let’s assume that you had thought that this is just a retracement. Indeed, the market has stopped at trend line and 0.618 Fib resistance. Why we should think that something has changed?
Later you’ve got the second one – breakout of the trend line and a move to deeper 0.88 Fib resistance. But here you didn’t have a chance to enter, there were no solid pullbacks.
Finally the market gives you third possibility – Double bottom pattern in combination with “kiss goodbye” of a trend line and Bullish Divergence. Also, take a close look, can you add something?
Commander in Pips: Ok, I’ll give you a hint – just combine reverse H&S and Double bottom into single pattern, does it remind you anything?
Commander in Pips: If you’ve missed entry point at any of previous reversals, you can try to enter on pullback to 1.40 – the high of this big Double bottom and place a relatively tight stop.
Commander in Pips: Although we have not paid attention to pivots here or to candlestick patterns that were formed by market on tops/bottoms of classical patterns, but I think that you can do this by yourself. That’s not a very difficult task for you.
Commander in Pips: As always – use stop-losses, but use it wisely. First, be sure that this really could be a a trend, or at least that the market will have some momentum. How to do that – we already know – 8-10 bars of thrusting move. Since you know, that the market should not move in countertrend deeper than 0.618-0.786, you may place stop below 0.88, for instance. And then, as the move will continue, drag it higher to new 0.88 from the most recent swing. This is some kind of trailing stop, but a manual sort of.
And, what is most important – look at all charts in this part. Any reversal manifests itself by signs that we’ve mentioned. So, as a rule you will follow the signs of reversal, but not anticipate it. For instance, look at chart#1 – there is not even single sign of reversal, right? Hence, if you will follow our rules, you will never take position due to reversal, when in fact, there is no reversal.
Commander in Pips: That’s it.
Pipruit: And what we can do at all?
Properties of Retracements
1. Usually retracement happens after some previous strong move;
2. Retracement should stop at some Fib retracement level, usually they are 0.382; 0.5; 0618. If market shows deeper retracement, say, 0.786 or even 0.88, then it tells that the current tendency becomes weaker;
3. Retracement usually takes place during macro data or news silence. In other words, when fundamentals do not change;
4. Using of pivot points can help in retracement identification. As we’ve said early, in an uptrend, the market when turns into retracement, corrects to pivot support 1, in a downtrend – to pivot resistance 1. If the market during retracement reaches to deeper pivot points, then it could become an early sign of a possible reversal approaching.
5. Retracement is usually accompanied with some continuation patterns, say, Gartley “222”, flags, pennants, triangles etc.
6. You may use trend by MACD as additional indicator of retracement. Sometimes, when the market turns to retracement and reaches some Fib level – MACD holds the trend unchanged. This is one of the indicators of possible continuation. Even if the trend has changed, you may wait for when it will reestablish again and enter on smaller retracement on lower time frame.
7. Long trend lines and channels could give great help, since the market should not break it in case of retracement;
8. The market should not break strong areas, such as Confluence and/or Agreement, if this really retracement;
9. Retracement could be accompanied by hidden divergence; 10. Swing in direction of the trend will always be greater than countertrend swings in the case of retracement. 11. Very often previous swing highs/lows act as support/resistance during the trend. So, as a rule (but not always) following retracements will not move below them, as on chart #4.
Properties of Reversals
As you understand they will be the opposite of retracement ones:
1. Reversal could happen at any time, but it’s much harder to come after some previous strong move, since market still has an opposite momentum. Still, sometimes it could happen;
2. If reversal happens, it leads to much longer term movement in the opposite direction compared to retracement;
3. As a rule reversal often happens by impact of unexpected news or macro data. In other words, when fundamentals do change;
4. In most cases reversals are accompanied by some reversal patterns – H&S, Double Top/Bottom, Butterfly, 3-Drive, wedge, broadening top/bottom etc. Any of these patterns could include and, as a rule, include reversal candlestick patterns.
5. Appearing of reversal near strong support/resistance of a higher time frame is more probable. Very often such kind of reversals accompanied by standard divergence;
6. As reversal point becomes closer, the market starts to show deeper retracements to 0.786 and 0.88, then at last breaks all Fib retracement levels and reverses;
7. If market breaks pivot support 1 in bull trend or pivot resistance 1 in bear trend – it could be an early sign of reversal;
8. Long-term trend lines or price channels, if broken, could be an early sign of reversal;
9. If the market breaks strong area of higher time frame, say, daily time frame market breaks weekly confluence resistance + Agreement during retracement, as it seems, in bear trend – this tells that market is stronger than it seems and probably this is not just a retracement; 10. When the market shows swing in opposite direction greater than previous swing in direction of trend – this is early sign of reversal.
Ok, let’s take a look at real examples of as upward trend action as downward trend:
On chart #4 is the same price action as on chart #3, precisely only upward part of it. Here you can see all of the signs that we’ve just discussed. Take a note that during retracements – all pullbacks hold not lower than 0.618 Fib support levels. Also, the trend line holds. Suddenly you get two early notification of possible reversal – divergence and a move down from the top of the Head (since you don’t know yet, that this could be H&S) that is as great as the previous move up. At the end of this move you get third note – break of the trend line.
Pipruit: Cool. Also, Commander if we take a close look at the top of the head, we can see that the head itself is a smaller H&S pattern. And after breakout we can see “Kiss goodbye” of a trend line, and start to suspect of appearing of H&S, am I right?
Chart #4 | 60-min EUR/USD reversals and retracements
Commander in Pips: Now let’s move to continuation – chart #5:
Chart #5 | 60-min EUR/USD reversals and retracements
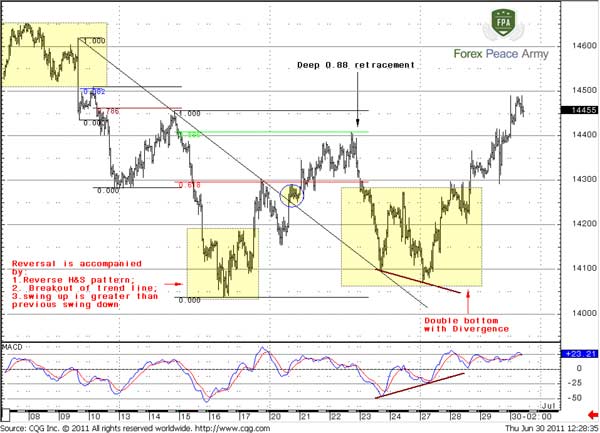
It’s a bit more complex than previous one, since the move develops in a more choppy and sloppy way. On the top of the chart to the left you see the right shoulder of H&S from chart #4. Here you have triple confirmation of reversal, depending on the time period.
The first confirmation you’ve got is with reverse H&S pattern right at the bottom. Also, you can see that when right shoulder was forming, the swing up was greater than previous swing down – this is also a confirmation sign of reversal. Also at this time the market was turmoil around the Greece default. The macro picture was changing every day.
But let’s assume that you had thought that this is just a retracement. Indeed, the market has stopped at trend line and 0.618 Fib resistance. Why we should think that something has changed?
Later you’ve got the second one – breakout of the trend line and a move to deeper 0.88 Fib resistance. But here you didn’t have a chance to enter, there were no solid pullbacks.
Finally the market gives you third possibility – Double bottom pattern in combination with “kiss goodbye” of a trend line and Bullish Divergence. Also, take a close look, can you add something?
Pipruit: Hardly, sir, you’ve said everything already…
Pipruit: Wow! This is greater double bottom! And market has already confirmed it. And what does it give us?
Pipruit: I see. You’re right sir, thanks.
Pipruit: But how we can protect ourselves from reversal?
And, what is most important – look at all charts in this part. Any reversal manifests itself by signs that we’ve mentioned. So, as a rule you will follow the signs of reversal, but not anticipate it. For instance, look at chart#1 – there is not even single sign of reversal, right? Hence, if you will follow our rules, you will never take position due to reversal, when in fact, there is no reversal.
Pipruit: So, you mean that we will be able to trade reversal signals only when in fact they have appeared already. Other words speaking, we will follow them.
Comments
L
Louis123321
12 years ago,
Registered user
Pulled off my 1st retracement trade thanks to this thread..!
Thanks !! Great Info! You've helped me to be able to and identify (and successfully trade) short term fib reversals!
If it's alright, i'd like to post a screeny of my trade today 09 Dec 2011. I was diving in at the deep end reading all of the above and as soon as i saw the bottom bullish candle finish up, then the 2nd candle close above or level with the 1st bullish candle (although it was bearish but very WEAK bearish), I decided to buy & enter short to the fib level 38.2 on retracement. I WAS RIGHT! :)
Check it out below ;)
Ahhh I would like to ask actually Stavro, is this fib drawing correct ? Or should I of started drawing the top of the fib level at the green line where there are ALL bearish candles going down only? I think this was right.. Because it's retraced to 50.0 so far.
Great successful trade.. Very happy with this, I closed for profit at 38.2 to be conservatively safe, hope this will also help other traders identifying retracements. Cheers.
Louis
NOTE: This may very well be a reversal however I based it on my pivot point etc & i can not be around to watch it play it, just pointing out a potentially very profitable short trade which I just made some money on ! ;)
https://www.forexpeacearmy.com/community/attachments/fib-reversal1-jpg.4479/

Hamza Samiullah
6 years ago,
Registered user
nice work you have done...
O
One-fm
5 years ago,
Registered user
This is really insightful.
Table of Contents
- Introduction
- FOREX - What is it ?
- Why FOREX?
- The structure of the FOREX market
- Trading sessions
- Where does the money come from in FOREX?
- Different types of market analysis
- Chart types
- Support and Resistance
- Candlesticks – what are they?
- Mysterious Fibonacci
- Introduction to Moving Averages
- Bollinger Bands
- Leading and Lagging Indicators
- Basic chart patterns
- Pivot points – description and calculation
- Elliot Wave Theory
- Intro to Harmonic Patterns
- Divergence Intro
- Harmonic Approach to Recognizing a Trend Day
- Intro to Breakouts and Fakeouts
- Again about Fundamental Analysis
- Cross Pair – What the Beast is That?
- Multiple Time Frame Intro
- Market Sentiment and COT report
- Dealing with the News
- Let's Start with Carry
- Let’s Meet with Dollar Index
- Intermarket Analysis - Commodities
- Trading Plan Framework – Common Thoughts
- A Bit More About Personality
- Mechanical Trading System Intro
- Tracking Your Performance
- Risk Management Framework
- A Bit More About Leverage
- Why Do We Need Stop-Loss Orders?
- Scaling of Position
- Intramarket Correlations
- Some Talk About Brokers
- Forex Scam - Money Managers
- Graduation!