Part II. Double top and Double bottom

Commander in Pips: Before shifting to discussion of patterns directly, I want to make a short plan of this discussion. First, we will study the classical approach and explanation of a pattern. Then, we add additional advanced tools that will allow you to look at it under different angle. Finally, as I’ve said, these patterns often fail nowadays due to market makers greed. But precisely in those moments a lot of possibilities appear to trade their failings. Also with some patterns we will discuss how manage trading position.
Pipruit: Cool, Sir. It’s really intriguing.
Pipruit: Absolutely, Sir.
Chart #1 | JPY/USD futures monthly. M-top pattern
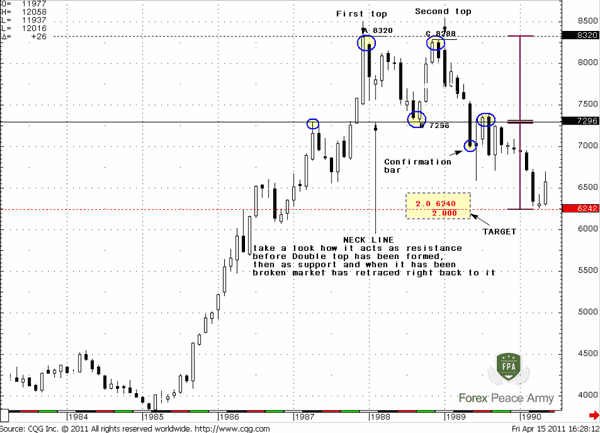
This chart contains all necessary explanation of the Double Top pattern:
1. Tops/bottoms should be equal to each other. Sometimes the second top/bottom could be slightly higher/lower than the first one. This happens, because market-makers like to grab public’s stops that have been placed just above the previous highs - in the most obvious place. As we’ve said once – if something looks obvious – then it obviously wrong, so as with public stops…On our chart the second top a bit lower, so market makers were kind to public and allowed them to make some profit on this pattern. But, it has happened in 80’s. Now we can’t count on such liberality from our opponents on the forex battlefield;
2. It is preferable that the retracement down/up after first top/bottom has the same amount of bars as the move to second top/bottom. But this is not absolutely necessary. As you can see, in our example this is not the case. Still the M-pattern has worked perfectly;
3. Pay attention to B-C move – from the bottom between tops to the second top. See – the market first showed explosive up candles to the second top, then the same strong candles to the downside. This is a shift in momentum and this is very typical for Double tops/bottoms;
4. The failure point of Double Top/bottom pattern is when market shows a close above/below second top/bottom. You may use a more strict failure confirmation – two or three closes above/below top/bottom, for instance.
5. The confirmation point of this pattern is when the market shows a close below/above the low/high between tops/bottoms of the pattern. Sometimes this level is called the “Neck line”.
6. The target of this pattern could be estimated in two ways:
- The classical approach tells that the target of a Double top pattern equals the height of the Double top formation. So, it assumes that market should go down from neckline the same distance as between tops and neckline. I draw it on the picture. Also, I use 2.0 extension ratio to show this moment – it counts the same distance to the downside from neckline as distance between first top to neckline. The same approach should be used with a Double bottom pattern;
- Second approach – use tops and low between them as ABC pattern for Fib extension ratio, then, the approximate initial target of Double top will be 1.618 extension to the downside, the same with double bottom;
Pipruit: Very important information, Commander. But could you please specify the major purpose of this pattern – where it usually appears, what it tells us about, how we should trade it, its market mechanics…
Market mechanics of Double Top/bottom pattern
When some trend develops, those who have positions with this trend feel themselves absolutely comfortable and calm, especially if the market does not show any significant pullbacks in the trend. Such kind of picture you can see on our chart #1. But simultaneously they worry that their positions are not as large as they want them to be, because market creeps and creeps higher. Their greed grows with the market and they wait for the nearest pullback to add to their positions. Others who see this trend (jealous of those who already have a long position) and want to enter think in the same way – they need some pullback to establish Longs.
May be in this time there are some long-term traders that exist who still hold positions against the trend, and their fear also grows as the market climbs. They want only one thing – to exit from their loosing positions during the first retracement down. So they wait for some significant resistance where they could do that. But the existence of these traders does not always escort this price action. The market just pulls back from some level to where new sellers would like to enter the market – this is most important moment. Those who want out exit from loosing positions – just join them. Depending on that initial pullback in trend could be deeper or shallower.
Finally both groups of traders get their pullback in trend. Those who want to add to their positions buying up positions of the second group traders – who just scream “let me out” and those who just initially sold from some level. Usually the public act in this way – sell on the first pullback down and place stops just above the recent highs.
When all initial sell orders have been absorbed by those who add to position or just initiate it, the up move reestablishes and traders who add to positions move their stops below the low of the retracement – they are happy, their greed has been satisfied. But now the public (that just have entered short) start to scream “let me out”. Market makers punish the public by taking out the previous highs (first top of potential Double top pattern). That’s why the second top could often be a bit higher than the first one, and this is a good sign for potential reversal.
When public stops have been grabbed, new big sellers enter the market and move it lower. So the second top has appeared. When and if number of sellers becomes greater and greater – the market moves through the neck line and trigger stops of “happy buyers” who just added to positions. Their stops add fuel to the down move and the market tends towards the target of the Double Top pattern.
If, in turn, market confirms the pattern but couldn’t go lower, then it turns back and takes out the second top – it tells us that there is an insignificant amount of sellers now and they can’t hold down the market and move it lower. It’s time to buy with “Stop” entering order, because in this case, sellers’ stops will add energy to further move up.
The same happens with a Double bottom but in opposite direction.
Pipruit: Cool! And where could this pattern appear?
Commander in Pips: As you can see from the picture, Double Top/bottom is a reversal pattern. When it appears we expect reversal of the trend. In fact, it could appear on any time frame. But this is more significant, when it appears on monthly, weekly or daily time frames. For instance, appearance on a monthly chart could give you an early signal of a big and long term reversal. But also you could see it on 5-min charts.
Trading Double Top/bottom pattern
From the classical point of view, the trading procedure of Double Top/Bottom pattern is a relatively simple task. You should enter the market, when it will close below/above the neck line, target, as we’ve said – distance from neck line to the downside/upside, that is equal to distance between tops/bottoms to neckline. The major problem with this approach is an area where we have to place our stop order. The pattern is treated as failed only if the market will close above/below tops/bottoms. So, logically we have to place our stop loss order there. But in this case, our potential profit will be lower than our potential loss. It tells us, that we should place stop order somewhere closer, and using one of Fibonacci resistance levels from the recent swing down is not bad idea, so as entering not just at low of confirmation bar but during some pullback to the neckline:
Chart #2 | JPY/USD futures monthly. M-top pattern
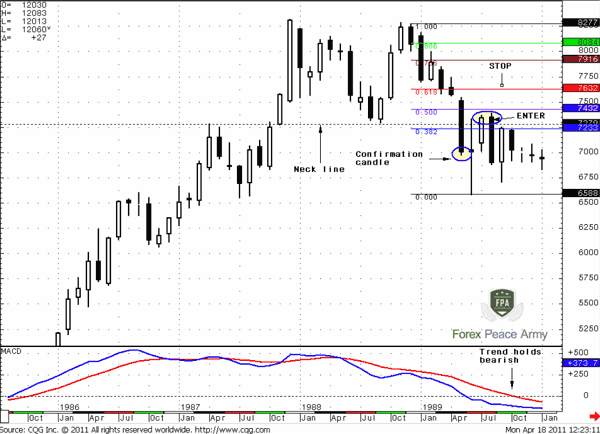
See – market has shown pullback to 0.382-0.50 resistance level, that is coincides with neckline. It allows you to have a better entry point as well as to place a tighter stop just above 0.618 Fib resistance. Still, if this pattern has formed, say, on 5-min chart you may use a softer approach to its trading. Just be sure that reward is greater than your potential risk and the value of potential losses will not be very painful to you and your trading account.
Advanced Talks on Double Top Trading
To trade this pattern we can apply some additional tools that we’ve studied already. I talk about MACD indicator and candlestick patterns. Also, just a simple having an eye on the market will help you to avoid many troubles.
Let’s take a look at a bit another Double top pattern – it has second top slightly higher than the first one. I’ve done it with purpose in Paint software, because this is necessary for our explanation.
Chart #3 (manually adjusted) | JPY/USD futures monthly. M-top pattern
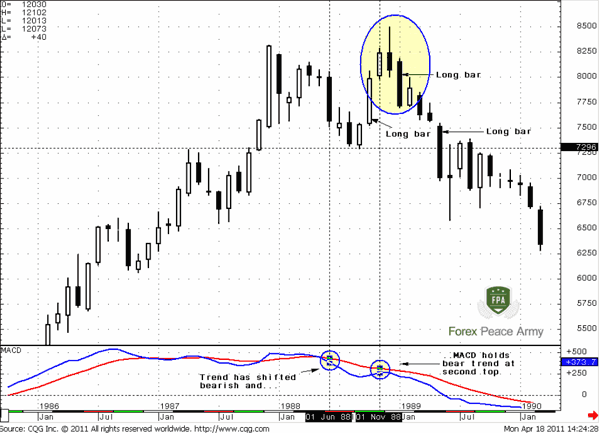
When this candle with high up shadow has been formed, and market comes right back below the previous high – this is first bearish sign – Wash&Rinse. If here will appear some bearish candle pattern - much better. It could be shooting star, bearish engulfing or something…
Second, despite the fact, that price action shows a new high, MACD holds the bear trend well. So currently you have two important confirmations – trend, W&R pattern and/or bearish candle pattern. You should use them, because your task is entering with as tight as possible stop loss order, but not blindly of course. You have to get confirmations from the market first – here we’ve got some.
Now about perception - the number of bars in the down move from the first top to neck line and from neck line to second top is preferable to be equal. If it is – then the pattern is more significant and has more chances to work well. By the way – you get this sign even before second top has been formed. Another important moment is a trend shifting momentum while the second top is forming. Look, the market shows strong up bar when it moves to the second top, but right after that – a strong move down. Sometimes (but rare on Forex), it could look not only as long bars down, but as gaps also that is side-by-side to long down bars.
And last one, when M or W-bottom pattern is fair, usually market does not show any significant retracement during the thrust down/up from second top/bottom. Here you can see it. Even after breakout of neckline market has shown 0.382 retracement up.
How we can trade this pattern alternatively? See small white candle on monthly chart? But it is small only here. If we drop our timeframe to weekly or even daily – you’ll see that this move is not so small there. Let’s scaled down the area of second top in blue circle to weekly time frame, i.e. drop our time frame to weekly chart.
Chart #4 | JPY/USD futures weekly. M-top pattern
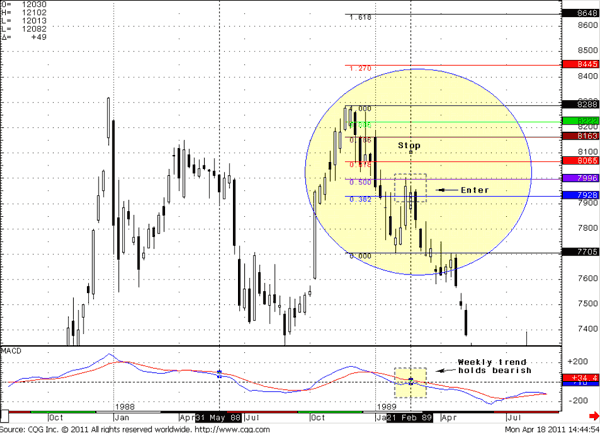
Here is weekly chart. You clearly see our Double top pattern. So, the strong move down from the second top to 0.7705 area – this is our long black candle on monthly chart. But look – the small white candle that we’ve just discussed in reality is an excellent 0.382-0.50 retracement on weekly time frame. But you can ask – and how do we know that we should use precisely this retracement as our entry point?
For that purpose we should collect all the puzzles pieces together. But before that let’s add another one – see, the weekly trend is bearish and it holds bearish, even when the market shows this retracement up. So, what do we have?
1. Market is forming potential double top pattern;
2. Second top is W&R of previous highs and some bearish candlestick pattern;
3. Monthly trend is bearish, even more – trend remains bearish, when the market has formed a second top;
4. We clearly see shifting in momentum – the market shows a strong up candle to the second top and a strong black candle out of the top;
5. The market shows thrust down on the weekly time frame;
6. The weekly trend is bearish and it holds bearish during the retracement up.
Do you see here, at least a single reason to enter Long? Although we have not yet studied using of multiple time frames for trade entry (it will be a bit later), here we just join some facts of weekly and monthly timeframes. Usually when the monthly trend is bearish and the weekly trend is bearish, weekly price action confirms the trend (i.e. showing a thrust down) and market is not oversold – you may use the nearest retracement up on the weekly time frame for entering on the short side of the market. That’s the move we’ve made here.
Here we didn’t know that market will reach 0.5 resistance, but even as we’ve entered from 0.382 - this will be almost perfect entry point. Our stop could be placed somewhere above 0.618 or 0.786 Fib resistance level. And this way of stop placement is absolutely logical, because we assume appearance of Double top – with a strong reversal pattern. The market should not show any deep retracement till it will reach neckline.
Once we’ve entered and market reaches neck line, you may act in different ways:
– Move your stop loss order to breakeven and watch the movie. You will be absolutely calm with neckline’s breakout process, because you already have a profitable position. If the Double top will fail – you loose nothing. If it works – you’ll get more profit. Just think about it – when most traders will fall in doom & gloom of neckline breakout, getting bets will it happen or not and nervously sit at computer tracking every tick and gnawing their nails – you will be absolutely calm.
– Second possibility – take half of your profit and hold another half of position intact. Move your stop loss to breakeven on the half you leave open. This is my preferable decision. Although you’ll get less profit if the Double top works, you’ll get profit anyway even if it fails. Our task on the market is not to prove that we are right, but to make a profit. So, I prefer to leave the market with some profit at any scenario, instead of with no profit in one case and a larger profit with the other. I’m not a gambler – double or nothing…
Trading pattern’s failure
And the last thing. Now let’s assume that market the has confirmed the pattern, but later returned back and has taken out the pattern’s extremes. In other words, the market has shown a Double Top failure. Don’t be upset with that. Very often a failed pattern is even stronger than a confirmed pattern, because they are based on public panic. When the public sits and cries before their computers and wonders what they are going to do now, you should act quickly. One way to do that, if failure has happened already, is to use a stop entry order that allows you to buy at the breakout of previous highs/bottoms of M/W-shape pattern. Such an entry will allow you to place a tight stop – behind some Fib support level that is just below the Tops, for instance. Another way – use the same strategy of anticipating possible failure as we did in anticipation of its confirmation. Say the market has confirmed a Double bottom, but then returned right back above the neck line. Take a look at the trend, patterns, how long he market stands above the neckline again and so on. If you see strong confirmation of a reverse move - then you may try to trade it. It will give you the same advantages as in our example of anticipating of confirmation of a Double top.
Pipruit: Commander, your material is amazing, but too sophisticated for me. I suppose I need some time to read it again and again, and pass through it a few times in a row.
Commander in Pips: Yes, I think so. But it will help you much in practice.
What to do if you’ve locked in counter trend position?
Commander in Pips: This is a last topic concerning Double Top/bottom trading. Let’s turn to double bottom pattern here. This is weekly chart of JPY/USD futures:
Chart #5 | JPY/USD futures weekly. W-bottom pattern
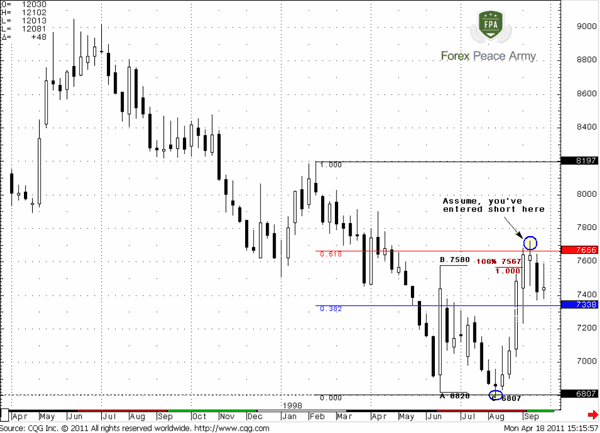
Assume that you didn’t recognize W-bottom and looked at it as just an AB-CD retracement in a long term bear trend. You see that 100% target of AB-CD makes an Agreement with 0.618 Fib resistance and you intend to enter short here. Also you see that this is a resistance area - the previous bottom has moved higher right from the 0.76 area and later the market still broke it down.
Commander in Pips:
A bit later you’ve seen a Hanging Man pattern and entered short somewhere around 0.76 with stops above the highs of Hanging Man.
Chart #6 | JPY/USD futures weekly. W-bottom pattern
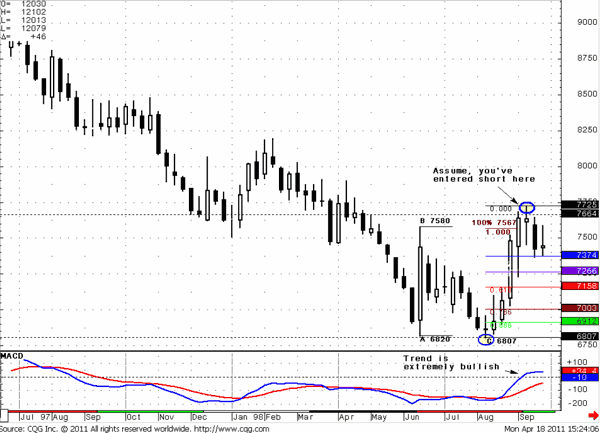
Take a look by the way – the second bottom slightly lower than the fist one – this is what I’ve talked about.
In such circumstances you should close half of position at nearest 0.382 Fib support level – 0.7374, remain another half of position intact but move stop loss to breakeven – 0.7664 (suppose that you’ve entered from this level). It will allow you to get small profit even if you were totally wrong. Here we assume that you do not recognize your mistake absolutely.
Commander in Pips: If, suppose, you’ve recognize it a bit later – than you should close the total position at the nearest support level – the MACD trend absolutely does not confirm this position. You have to be flat instead, because MACD shows up, pattern shows down – with contradictive signals, it is better to stay flat:
Why? Here is why:
Chart #7 | JPY/USD futures weekly. W-bottom pattern
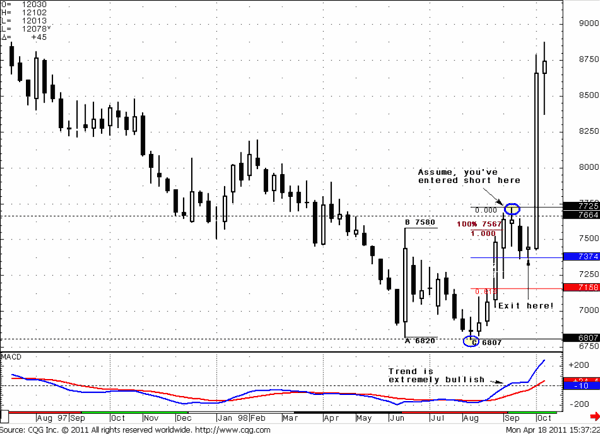
But don’t be frustrated too much – even if you haven’t done it and taken the loss – it is not so crucial, you have your stop loss in place – just above Hanging Man high.
Here we give you just a common clue how to act on the market:
1. Enter the trade and place initial stop loss;
2. When the market has hit the nearest target – close half of position, move your stop loss on the remaining half to breakeven and wait for second target;
3. If you’ve found that you are on the wrong side – close total position at nearest level.
We advise you always to act in this way. You will remain with some profit, even if you’re totally wrong. Do not catch huge moves – your task here is to conquer pips and save them.
Comments
Hamza Samiullah
6 years ago,
Registered user
Lengthy Lesson... Can't understand much of material... But Excellent work
Table of Contents
- Introduction
- FOREX - What is it ?
- Why FOREX?
- The structure of the FOREX market
- Trading sessions
- Where does the money come from in FOREX?
- Different types of market analysis
- Chart types
- Support and Resistance
-
Candlesticks – what are they?
- Part I. Candlesticks – what are they?
- Part II. How to interpret different candlesticks?
- Part III. Simple but fundamental and important patterns
- Part IV. Single Candlestick Patterns
- Part V. Double Deuce – dual candlestick patterns
- Part VI. Triple candlestick patterns
- Part VII - Summary: Japanese Candlesticks and Patterns Sheet
-
Mysterious Fibonacci
- Part I. Mysterious Fibonacci
- Part II. Fibonacci Retracement
- Part III. Advanced talks on Fibonacci Retracement
- Part IV. Sometimes Mr. Fibonacci could fail...really
- Part V. Combination of Fibonacci levels with other lines
- Part VI. Combination of Fibonacci levels with candle patterns
- Part VII. Fibonacci Extensions
- Part VIII. Advanced view on Fibonacci Extensions
- Part IX. Using Fibonacci for placing orders
- Part X. Fibonacci Summary
-
Introduction to Moving Averages
- Part I. Introduction to Moving Averages
- Part II. Simple Moving Average
- Part III. Exponential Moving Average
- Part IV. Which one is better – EMA or SMA?
- Part V. Using Moving Averages. Displaced MA
- Part VI. Trading moving averages crossover
- Part VII. Dynamic support and resistance
- Part VIII. Summary of Moving Averages
-
Bollinger Bands
- Part I. Bollinger Bands
- Part II. Moving Average Convergence Divergence - MACD
- Part III. Parabolic SAR - Stop And Reversal
- Part IV. Stochastic
- Part V. Relative Strength Index
- Part VI. Detrended Oscillator and Momentum Indicator
- Part VII. Average Directional Move Index – ADX
- Part VIII. Indicators: Tightening All Together
- Leading and Lagging Indicators
- Basic chart patterns
- Pivot points – description and calculation
- Elliot Wave Theory
- Intro to Harmonic Patterns
- Divergence Intro
- Harmonic Approach to Recognizing a Trend Day
- Intro to Breakouts and Fakeouts
- Again about Fundamental Analysis
- Cross Pair – What the Beast is That?
- Multiple Time Frame Intro
- Market Sentiment and COT report
- Dealing with the News
- Let's Start with Carry
- Let’s Meet with Dollar Index
- Intermarket Analysis - Commodities
- Trading Plan Framework – Common Thoughts
- A Bit More About Personality
- Mechanical Trading System Intro
- Tracking Your Performance
- Risk Management Framework
- A Bit More About Leverage
- Why Do We Need Stop-Loss Orders?
- Scaling of Position
- Intramarket Correlations
- Some Talk About Brokers
- Forex Scam - Money Managers
- Graduation!