Part IV. Single Candlestick Patterns

Commander in Pips: So, we’ve studied the major properties of candlesticks, and I hope that now you easily can explain what a particular candle shows and what kind of price action was happening during its period. Now it’s time to start with patterns – combinations of 1-3 candles that give you early signals about possible future price action. Patterns are an absolutely practical thing and they are taken for education from real price behavior. So, it is to your benefit to learn all these patterns well. And they will serve you much in your real trading. In this chapter we will start from patterns that consist of just a single candle.
Pipruit: Ok, Sir, I’m ready.
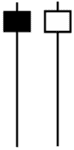
Commander in Pips: Although Hammer and Hanging Man look identically, they carry quite different role, depending on the previous price action. The common properties of these patterns include very long lower shadow, small body (black or white), and small or even absence of upper shadow.
#1 GBP/USD Weekly Chart – Hammer and Hanging Man examples
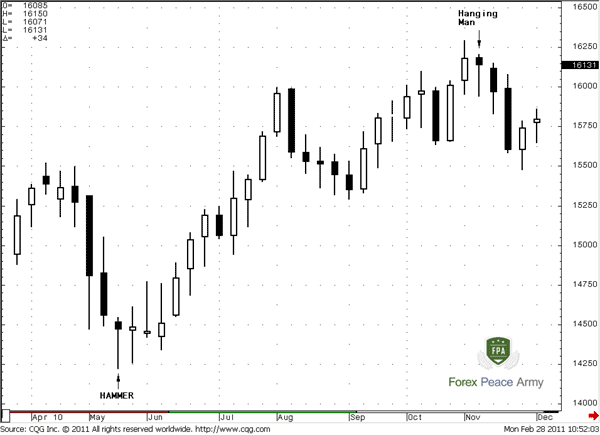
Although on the chart as Hammer as Hanging man are black – they both could be white and white patterns will have the same sense as black ones.In general, the Hammer is bullish reversal pattern and usually forms after previous downtrend. Very often you can meet it at support levels. It is called “Hammer” because the market shows a kind of “hammering up” from the bottom.
As we’ve already discussed, the long lower shadow of hammer suggests that although the bears tried to push the market lower – bulls were able to regain control and forced the bears back at the end of trading period.
Pipruit: Yes, I remember that, and another thing – since the open and close prices are very near to each other – there is no big deal about the color of the body.
Commander in Pips: You’re correct, but still, it’s preferably to see a white hammer, because it suggests that the bulls were stronger, although just a bit.
Pipruit: Commander, I’ve just thought, and could, say Dragonfly Doji, or any Doji with very long lower shadow and very small up shadow be classified as hammer?
Commander in Pips: Absolutely, if it corresponds to the properties of Hammer – long lower shadow, absence or very small upper shadow. In this case – does the candle have a small body or have not it at all (Doji) is not very important.
So, how could we use hammer in real trading. First of all, the appearing of hammer doesn’t mean that we should buy immediately…
Pipruit: Yes, yes – do not rely at any single tool… I remember.
Commander in Pips: Right - this is the first rule that we should follow to. Second, anyway it is preferable to wait some confirmation from further market price action. For instance – wait, the white candle that will show close above the open price (or even the high price) of candle that preceded hammer, or at least the high of Hammer candle itself.
We should treat hammer as failed pattern if market will show close below the low price of hammer (i.e. below the lower shadow).
Pipruit: And how strong up move after hammer could be?
Commander in Pips: It’s impossible to say definitely. Hammer could show as a long-term reversal as a temporally bouncing. But anyway, it’s safer to buy after a hammer has appeared rather than just “anywhere”.
Rules of Hammer’s recognition:
- The long lower shadow – at least 2 times longer (3 times or more is preferable) than the body;
- Little or no upper shadow;
- The body is at upper end of the candle (in fact it couldn’t be otherwise, due to previous conditions);
- The color of the body is not important, but a white hammer is preferable.
- Hammer also could be a Doji with the same properties (chart #2).
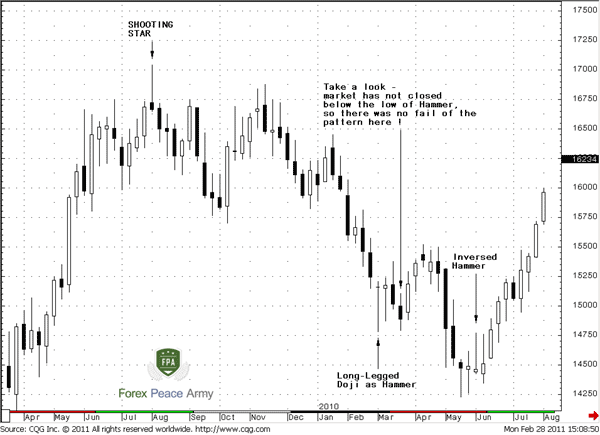
#2 GBP/USD Weekly – Shooting star and Inversed Hammer:

Hanging man, in fact, has absolutely the same properties, but in terms of bearish reversal pattern. Its appearance after up trend suggests that here could be a top or resistance level.Pipruit: Commander and what are the price mechanics of a Hanging man? Looks like the same action on a Hammer as on a Hanging man, buyers dominate over sellers. Why then is a Hanging man a bearish reversal pattern?
Commander in Pips: Good question. Imagine a good up move, so that the market is forming nice white up candles. But once, a Hanging Man has appeared. What does it mean? Although buyers have return to their positions during this period and have pushed the bears back – they could do it only until the open price and weren’t able to continue the up move, i.e. establish the next nice white candle. Hence, a Hanging Man gives us an early warning, that Buyers are gradually becoming exhausted, so the pressure of bears becomes stronger.
Pipruit: Sounds logical.
Commander in Pips: Thank you. As with a Hammer – we should not sell blindly when a Hanging Man just appeared. Much better is to wait some confirmation from further price action - close below the open/low price of candle that preceded appearing of Hanging Man pattern, or at least the lows of the Hanging Man pattern itself. Also it’s impossible to say – does the Hanging man show a long-term top and lead to reversal or indicate just short-term bouncing from resistance.
We should treat this pattern as failing if the market will close above the highs of Hanging Man.
Rules of Hanging Man recognition:
- The long lower shadow – at least 2 times longer (3 times of more is preferable) than the body;
- Little or no upper shadow;
- The body is at upper end of the candle (in fact it couldn’t be otherwise, due to previous conditions);
- The color of the body is not important, but black Hanging Man is preferable.
- Hanging Man also could be a Doji with the same properties.
Inverted Hammer and Shooting Star
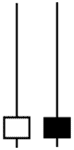
If we turn a Hammer or a Hanging Man from top to bottom – we will get other reversal patterns – Inverted Hammer and Shooting Star. The properties of these patterns include very long upper shadow, small body (black or white), and small or even absence of lower shadow.
If we turn a Hammer or a Hanging Man from top to bottom – we will get other reversal patterns – Inverted Hammer and Shooting Star. The properties of these patterns include very long upper shadow, small body (black or white), and small or even absence of lower shadow.
Commander in Pips: You’re absolutely right. You even can find Inverted Hammer on Chart #1 two candles to the right from just Hammer. In this case appearing of inverse hammer near to ordinary hammer confirms the strength of support. If you’re so smart – explain me the market mechanics during Inverted Hammer and how to recognize it and trade.
Commander in Pips: Thank you. As with a Hammer – we should not sell blindly when a Hanging Man just appeared. Much better is to wait some confirmation from further price action - close below the open/low price of candle that preceded appearing of Hanging Man pattern, or at least the lows of the Hanging Man pattern itself. Also it’s impossible to say – does the Hanging man show a long-term top and lead to reversal or indicate just short-term bouncing from resistance.
We should treat this pattern as failing if the market will close above the highs of Hanging Man.
Rules of Hanging Man recognition:
- The long lower shadow – at least 2 times longer (3 times of more is preferable) than the body;
- Little or no upper shadow;
- The body is at upper end of the candle (in fact it couldn’t be otherwise, due to previous conditions);
- The color of the body is not important, but black Hanging Man is preferable.
- Hanging Man also could be a Doji with the same properties.
Inverted Hammer and Shooting Star
Pipruit: Well, I suppose, that an Inverted hammer corresponds to a Hanging Man, but appears after down move and tells about possible bottoms and support area. While a Shooting Star corresponds to Hammer, but appears after an up move and tells about a possible downside reversal or resistance area. We can make such conclusion due price action during these patterns.
Commander in Pips: You’re absolutely right. You even can find Inverted Hammer on Chart #1 two candles to the right from just Hammer. In this case appearing of inverse hammer near to ordinary hammer confirms the strength of support. If you’re so smart – explain me the market mechanics during Inverted Hammer and how to recognize it and trade.
#1 GBP/USD Weekly Chart – Hammer and Hanging Man examples

Inverted Hammer
Inverted Hammer
Pipruit: Yes, Sir. So, an Inverted Hammer’s appearance suggests that here could be a bottom or support level. As with an ordinary Hammer pattern, an Inverted Hammer appears after a down move price action on bottoms. Pattern mechanics suggests that after good down move, when the market is forming nice black down candles, the appearance of an Inverted Hammer tells us that although sellers have returned to their positions during this period and pushed the bulls back – they could do it only till the open price and weren’t able to continue the down move to establish the next nice down candle. Hence, an Inverted Hammer gives us an early warning, that the number of Sellers became fewer and all who wanted to Sell – have done it already.
We should not trade an Inverted Hammer (or any other pattern) blindly, but have to wait some confirmation from further price action – for example, close above the open/high price of candle that preceded the appearance of the Inverted Hammer pattern, or, at least above the high of Inverted Hammer itself.
We should treat this pattern as failing if the market will close below the lows of the Inverted Hammer.
Also it’s impossible to say – does an Inverted Hammer show a long-term bottom and lead to bullish reversal or indicate just short-term bouncing from support.
Rules of Inverted Hammer recognition:
- The long upper shadow – at least 2 times longer (3 times of more is preferable) than the body;
- Little or no lower shadow;
- The body is at the lower end of the candle (in fact it couldn’t be otherwise, due to previous conditions);
- The color of the body is not important, but a white inverted hammer is preferable.
- Inverted Hammer also could be a Doji with the same properties, for example Gravestone one.
Shooting Star
Commander in Pips: Good work. Now about the Shooting Star…
Pipruit: Shooting Star, very romantic name. I think that this is due to the long upper shadow that reminds me of the tail of a shooting star…
Commander in Pips: So, Shooting Star could be formed after some up move on the market and its appearance suggests that here could be a top or resistance level. The long upper shadow of Shooting Star suggests that although bulls have tried to push market higher – bears were able to return control and forced buyers back by the end of the trading period.
We should not trade a Shooting Star (or any other pattern) blindly, but have to wait for some confirmation from further price action – for example, a close below of the open/low price of candle that preceded appearing of Shooting Star pattern, or, at least below the low of the Shooting Star itself.
We should treat this pattern as failing if the market will close above the high of the Shooting Star.
Also it’s impossible to say – does a Shooting Star show a long-term top and lead to bearish reversal or indicate just short-term bouncing from resistance.
Rules of Shooting Star recognition:
- The long upper shadow – at least 2 times longer (3 times of more is preferable) than the body;
- Little or no lower shadow;
- The body is at lower end of the candle (in fact it couldn’t be otherwise, due to previous conditions);
- The color of the body is not important, but a black Shooting Star is preferable.
- Shooting Star also could be a Doji with the same properties – for example, Gravestone Doji.
Commander in Pips: See, you already can recognize them! Concerning the white candle – I think that this is not the Hammer, because it has too long upper shadow and not enough length of lower shadow.
Also pay attention to Long-legged Doji that could carry qualities of Hammer pattern – I’ve found one for you. See – the market didn’t close below the low of this candle, so this pattern didn’t fail and then we see some bounce up. Shooting star also looks impressive.
We should not trade an Inverted Hammer (or any other pattern) blindly, but have to wait some confirmation from further price action – for example, close above the open/high price of candle that preceded the appearance of the Inverted Hammer pattern, or, at least above the high of Inverted Hammer itself.
We should treat this pattern as failing if the market will close below the lows of the Inverted Hammer.
Also it’s impossible to say – does an Inverted Hammer show a long-term bottom and lead to bullish reversal or indicate just short-term bouncing from support.
Rules of Inverted Hammer recognition:
- The long upper shadow – at least 2 times longer (3 times of more is preferable) than the body;
- Little or no lower shadow;
- The body is at the lower end of the candle (in fact it couldn’t be otherwise, due to previous conditions);
- The color of the body is not important, but a white inverted hammer is preferable.
- Inverted Hammer also could be a Doji with the same properties, for example Gravestone one.
Shooting Star
Commander in Pips: Good work. Now about the Shooting Star…
Pipruit: Shooting Star, very romantic name. I think that this is due to the long upper shadow that reminds me of the tail of a shooting star…
- The long upper shadow – at least 2 times longer (3 times of more is preferable) than the body;
- Little or no lower shadow;
- The body is at lower end of the candle (in fact it couldn’t be otherwise, due to previous conditions);
- The color of the body is not important, but a black Shooting Star is preferable.
- Shooting Star also could be a Doji with the same properties – for example, Gravestone Doji.
#2 GBP/USD Weekly – Shooting star and Inversed Hammer:
Pipruit: Cool! Commander, I see a simple Hammer with a black body two candles left from an inverted hammer. And white candle to the left from Inversed Hammer – is it Hammer or not?
Commander in Pips: See, you already can recognize them! Concerning the white candle – I think that this is not the Hammer, because it has too long upper shadow and not enough length of lower shadow.
Also pay attention to Long-legged Doji that could carry qualities of Hammer pattern – I’ve found one for you. See – the market didn’t close below the low of this candle, so this pattern didn’t fail and then we see some bounce up. Shooting star also looks impressive.
Comments

Hamza Samiullah
6 years ago,
Registered user
Nice work
D
dotman
5 years ago,
Registered user
Interesting
H
hongfan0426
4 years ago,
Registered user
Learn a lot of knowledge.
thank you very much!
thank you very much!

dani7447
3 years ago,
Registered user
Great content. Thank How much trading periods you must wait to see if there is a confirmation or a failure of the pattern?
Table of Contents
- Introduction
- FOREX - What is it ?
- Why FOREX?
- The structure of the FOREX market
- Trading sessions
- Where does the money come from in FOREX?
- Different types of market analysis
- Chart types
- Support and Resistance
- Candlesticks – what are they?
- Mysterious Fibonacci
- Introduction to Moving Averages
- Bollinger Bands
- Leading and Lagging Indicators
- Basic chart patterns
- Pivot points – description and calculation
- Elliot Wave Theory
- Intro to Harmonic Patterns
- Divergence Intro
- Harmonic Approach to Recognizing a Trend Day
- Intro to Breakouts and Fakeouts
- Again about Fundamental Analysis
- Cross Pair – What the Beast is That?
- Multiple Time Frame Intro
- Market Sentiment and COT report
- Dealing with the News
- Let's Start with Carry
- Let’s Meet with Dollar Index
- Intermarket Analysis - Commodities
- Trading Plan Framework – Common Thoughts
- A Bit More About Personality
- Mechanical Trading System Intro
- Tracking Your Performance
- Risk Management Framework
- A Bit More About Leverage
- Why Do We Need Stop-Loss Orders?
- Scaling of Position
- Intramarket Correlations
- Some Talk About Brokers
- Forex Scam - Money Managers
- Graduation!