Part III. Continuation - Stock Market

Pipruit: Right…
But let’s return to popular theory. It tells you that if you want to invest in the stock market of some country – you need to purchase its currency first. I can’t disagree with that but still only partially. If you want to purchase a particular stock then this is really true, but what if you want to purchase the overall market, say Nikkei 225 – Japanese stock market? The one way how you can do it is to purchase all stocks of index in the same weight, or… you can invest in index futures – just buy 1 futures contract on Nikkei 225. And the truth is that you do not need yen for that. For instance, the Chicago Mercantile Exchange allows you to do this with US Dollars. Still, the truth is that liquidity and daily turnover in such futures are very small compares to Japanese stock market. The same is true for other stock markets.
So, as we need to purchase currency first – this leads to growth of domestic currency of that country. If, for example Japanese stock market is booming – then more and more investors want to take part in this rally. This leads to higher demand for JPY and hence, its appreciation, compared to other currencies. This statement tells us, that if some market has good perspectives by investors’ opinion and feels well – this is a sign of strength of domestic currency. At least this currency should not become weaker, because more investors join up their money. Even if you do not want to trade stocks – to keep an eye on it is not bad idea.
The second statement of this well-known theory is if some stock market performs better than the other, then, probably sooner rather than later it will launch the same dynamic with currencies.
Currency will appreciate in that country in which the stock market is stronger. It looks obvious that you should buy a stronger currency and sell the weaker one. Here I see just one problem. The point is that stock markets are highly correlated around the world. This is very rare due total globalization that some economy raises while all others fall, and could happen mostly due extraordinary events – such catastrophes as in Japan in 2011, wars, political turmoil or something like that. If there is a divergence among world major indexes – this could be an early warning about shifting a tendency on the world economy from growth to recession or vice versa. Take a look at S&P500 index and Nikkei 225 for last decade – they are highly correlated except last year due to the Tsunami and water flow in Japan.
Besides, in general we might say that except for the US, Switzerland and Japan for recent 2-3 years this principle does not hold, precisely speaking holds conversely – when their equity markets perform terribly, investors do not sell USD, JPY and CHF for their domestic currencies, but vice versa – hold it. This happens because these currencies (CHF, USD and JPY) are treated as safe-havens due to reasons that we’ve already discussed – USD is the world reserve currency, CHF is 25% backed by gold and JPY is backed by huge reserves in USD:
Chart #1 | S&P 500 and Nikkei 225 Stock indexes, monthly
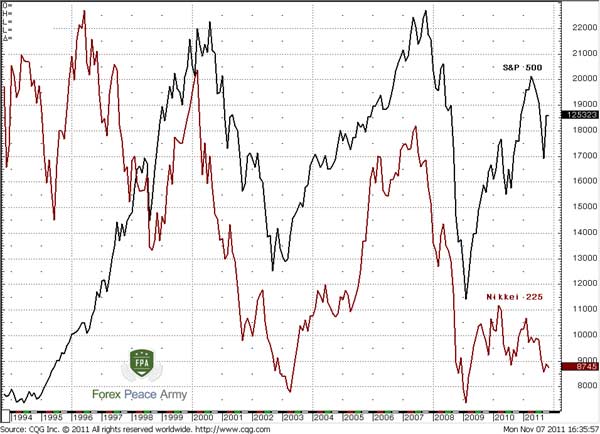
Pipruit: Still, I see here a divergence – Nikkei does not show second top, while S&P 500 does. The same we can see in collapse of 1987, although divergence there is smaller. Also I see huge divergence between tops of 2000 and 2007 – Nikkei has not formed them…
Commander in Pips: I see you’re big expert on divergences… Still, you will take a look at USD/JPY you’ll see that Yen highly appreciated compares to USD, although US market looks stronger, right?
Commander in Pips: Right. Here is another example. I guess that everything is good in Switzerland, right? Then comment this:
Commander in Pips: Right. So, applying the stock market to the forex trading is not a piece of cake.
Major World Indexes
Commander in Pips: Sure. In fact any index is a weighted average of its components (stocks), but each averaging method could be different:
There are three major US Indexes:
1. Dow Jones Industrial Average (DJIA), aka jus Dow, that includes the value of 30 of the largest and most influential and representative companies. Their value allows us to judge about the overall US stock market. This index is more popular among media and population. Dow is price-weighted index. It means that the weight of each particular company in index depends from the price of equity, but not from total capitalization of company, as in S&P 500;
2. S&P 500. This is a broader index, that calculated by Standard & Poor’s rating agency. As you probably understand, it includes the value of 500 stocks. This is the leading large-cap benchmark for the US Stock market and the main barometer for institutional and professional investors. Since this index includes among the others the same 30 stocks that are Dow has, these two indexes are highly correlated. This index is capitalization-weighted and float-adjusted index. In other words, the weight of each stock in index depends from the total value of company. “Float-adjusted” refers to shares. When calculating a capitalization-weighted, float-adjusted index, only those shares available to investors are counted. This will be less than a company’s total outstanding shares. Shares held by government agencies, closely held groups and others are not counted.
3. NASDAQ is National Association of Securities Dealers Automated Quotations. This is a largest electronic system of stock trading that includes approximately 4000 companies of non-financial sector – mostly technology and software companies. In fact there are two major indexes – NASDAQ-100. I think you guess that it includes 100 largest companies that are listed on NASDAQ and NASDAQ Composite Index. This is extremely wide index that includes about 5000 companies as from US as from other countries, since NASDAQ acquire some other stock exchanges in Europe.
Major World Indexes Continued
- DAX. This German Stock Index, that is very similar to the Dow. It also includes 30 companies that are in listing of Frankfurt stock exchange. Since Germany is a most powerful economy in the EU – DAX is an important barometer of stock market;
- FTSE-100. (read as “footsie”). This is “Financial Times Stock Exchange Index”. This index, as you understand is calculated by FT Agency and treated among most important world and European stock indexes. It includes 100 largest companies’ stocks that are listed on London Stock Exchange (LSE). There is also exists FTSE-250 index.
- Nikkei-225. I think you may explain this index right by its name. Right, this is most famous Japan index that includes 225 most powerful and largest Japanese companies from listing of Tokyo stock exchange. All Japanese car producers companies are in this index – Mitsubishi, Toyota, Honda, Suzuki and others, as well as electronic Giants as Sony, Fuji and others. Also there are some other Nikkei indexes – Nikkei-500, Nikkei-300. These indexes include a bit more companies in calculation;
Major World Indexes Continued
- DJ Euro Stoxx 50. This index includes largest 50 companies in EU and treated as a barometer not just of the German economy but economy of EU;
- Hang Seng. This index belongs to Hong Kong and includes 34 companies from listing of Hong Kong stock exchange. These 34 companies own 65 % of total capitalization of Hong Kong stock exchange. In 2001 has appeared Hang Seng Composite index that includes 200 companies. This index as Nikkei is important barometer of Asian stock market.
All indexes fall under some revision from time to time – some equities are excluded and replaced by new ones, for example due merger or acquisition procedures or bankruptcy as with Enron. Weights of stocks in index are also subject to change. There are a lot of other indexes that also important, such as Russel-2000, NYSE, AMEX indexes, some particular industry indexes – DJ Utility, DJ Gold, S&P Banks and others. You may investigate them by yourself.
In fact, this is difficult to say what stands in advance and what is lagging – currency or equity. Since this is a cyclical environment they are feeling impact of each other and both are based on fundamentals. Here is the chart of Dow, S&P500 index and DAX-30. The close relation is obvious:
Commander in Pips: Right, we’re too fascinated with that…
Commander in Pips: I see you’re big expert on divergences… Still, you will take a look at USD/JPY you’ll see that Yen highly appreciated compares to USD, although US market looks stronger, right?
Pipruit: In other words, it’s not so obvious. We need to know underlying factors of any growth or fall.
Commander in Pips: Right. Here is another example. I guess that everything is good in Switzerland, right? Then comment this:
Chart #2 | S&P 500 and Swiss Stock Index, monthly
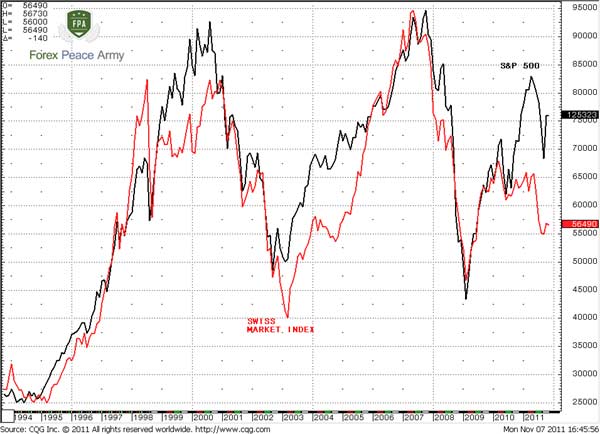
Pipruit: The final stage also shows a divergence and looks more like Nikkei index, but I do not remember any water flow in Switzerland. Besides, CHF shows outstanding appreciation to USD and EUR, so that SNB had to launch intervention and hold EUR/CHF at 1.20…
Commander in Pips: Right. So, applying the stock market to the forex trading is not a piece of cake.
Pipruit: Sir, and could you please specify some world major indexes?
Major World Indexes
Commander in Pips: Sure. In fact any index is a weighted average of its components (stocks), but each averaging method could be different:
There are three major US Indexes:
1. Dow Jones Industrial Average (DJIA), aka jus Dow, that includes the value of 30 of the largest and most influential and representative companies. Their value allows us to judge about the overall US stock market. This index is more popular among media and population. Dow is price-weighted index. It means that the weight of each particular company in index depends from the price of equity, but not from total capitalization of company, as in S&P 500;
2. S&P 500. This is a broader index, that calculated by Standard & Poor’s rating agency. As you probably understand, it includes the value of 500 stocks. This is the leading large-cap benchmark for the US Stock market and the main barometer for institutional and professional investors. Since this index includes among the others the same 30 stocks that are Dow has, these two indexes are highly correlated. This index is capitalization-weighted and float-adjusted index. In other words, the weight of each stock in index depends from the total value of company. “Float-adjusted” refers to shares. When calculating a capitalization-weighted, float-adjusted index, only those shares available to investors are counted. This will be less than a company’s total outstanding shares. Shares held by government agencies, closely held groups and others are not counted.
3. NASDAQ is National Association of Securities Dealers Automated Quotations. This is a largest electronic system of stock trading that includes approximately 4000 companies of non-financial sector – mostly technology and software companies. In fact there are two major indexes – NASDAQ-100. I think you guess that it includes 100 largest companies that are listed on NASDAQ and NASDAQ Composite Index. This is extremely wide index that includes about 5000 companies as from US as from other countries, since NASDAQ acquire some other stock exchanges in Europe.
Major World Indexes Continued
- DAX. This German Stock Index, that is very similar to the Dow. It also includes 30 companies that are in listing of Frankfurt stock exchange. Since Germany is a most powerful economy in the EU – DAX is an important barometer of stock market;
- FTSE-100. (read as “footsie”). This is “Financial Times Stock Exchange Index”. This index, as you understand is calculated by FT Agency and treated among most important world and European stock indexes. It includes 100 largest companies’ stocks that are listed on London Stock Exchange (LSE). There is also exists FTSE-250 index.
- Nikkei-225. I think you may explain this index right by its name. Right, this is most famous Japan index that includes 225 most powerful and largest Japanese companies from listing of Tokyo stock exchange. All Japanese car producers companies are in this index – Mitsubishi, Toyota, Honda, Suzuki and others, as well as electronic Giants as Sony, Fuji and others. Also there are some other Nikkei indexes – Nikkei-500, Nikkei-300. These indexes include a bit more companies in calculation;
Major World Indexes Continued
- DJ Euro Stoxx 50. This index includes largest 50 companies in EU and treated as a barometer not just of the German economy but economy of EU;
- Hang Seng. This index belongs to Hong Kong and includes 34 companies from listing of Hong Kong stock exchange. These 34 companies own 65 % of total capitalization of Hong Kong stock exchange. In 2001 has appeared Hang Seng Composite index that includes 200 companies. This index as Nikkei is important barometer of Asian stock market.
All indexes fall under some revision from time to time – some equities are excluded and replaced by new ones, for example due merger or acquisition procedures or bankruptcy as with Enron. Weights of stocks in index are also subject to change. There are a lot of other indexes that also important, such as Russel-2000, NYSE, AMEX indexes, some particular industry indexes – DJ Utility, DJ Gold, S&P Banks and others. You may investigate them by yourself.
In fact, this is difficult to say what stands in advance and what is lagging – currency or equity. Since this is a cyclical environment they are feeling impact of each other and both are based on fundamentals. Here is the chart of Dow, S&P500 index and DAX-30. The close relation is obvious:
Chart #3 | S&P 500, Dow and DAX, monthly
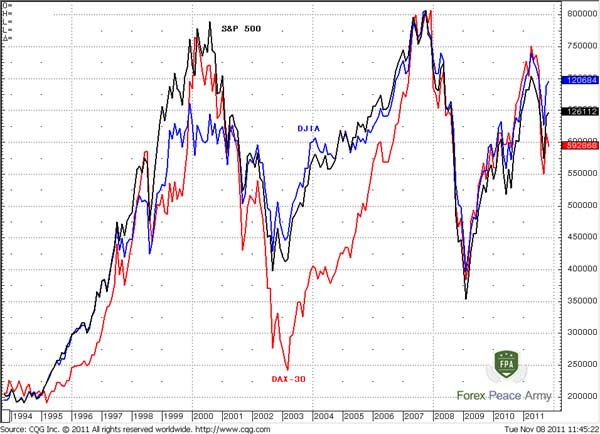
Nikkei we’ve studied before that. Also, as you can see combination of different stock indexes is a subject for searching for divergences. For instance, during top of 1999-2000 the Dow has not supported a new high that was shown by S&P 500. This is a warning sign. Also take a look at bottoms of DAX. While S&P and Dow have shown new bottom in 2009, DAX has not. This could become add-on to possible bullish analysis of stock markets.Pipruit: Commander that is very interesting, but what about relation with Forex market?
Commander in Pips: Right, we’re too fascinated with that…
Comments
Table of Contents
- Introduction
- FOREX - What is it ?
- Why FOREX?
- The structure of the FOREX market
- Trading sessions
- Where does the money come from in FOREX?
- Different types of market analysis
- Chart types
- Support and Resistance
- Candlesticks – what are they?
- Mysterious Fibonacci
- Introduction to Moving Averages
- Bollinger Bands
- Leading and Lagging Indicators
- Basic chart patterns
- Pivot points – description and calculation
- Elliot Wave Theory
- Intro to Harmonic Patterns
- Divergence Intro
- Harmonic Approach to Recognizing a Trend Day
- Intro to Breakouts and Fakeouts
- Again about Fundamental Analysis
- Cross Pair – What the Beast is That?
- Multiple Time Frame Intro
- Market Sentiment and COT report
- Dealing with the News
- Let's Start with Carry
- Let’s Meet with Dollar Index
- Intermarket Analysis - Commodities
- Trading Plan Framework – Common Thoughts
- A Bit More About Personality
- Mechanical Trading System Intro
- Tracking Your Performance
- Risk Management Framework
- A Bit More About Leverage
- Why Do We Need Stop-Loss Orders?
- Scaling of Position
- Intramarket Correlations
- Some Talk About Brokers
- Forex Scam - Money Managers
- Graduation!