Sive Morten
Special Consultant to the FPA
- Messages
- 18,771
Monthly
On monthly chart trend holds bullish, and within two bars we see bullish price action as well. Market gradually approaches to the upper border of K-resistance area. If market will break through it – next important level to watch is 1.3486 high. If market will show greater swing up and take out this level – that will be an appeal on reversal on monthly chart. Looks like our suggestions about potential solid bullish context more and more get confirmation from price action.
Let’s continue to monitor JPY as well. Interesting, that market stands in the process of neckline breakout…
Weekly
On weekly chart price action week by week eliminates questions. Situation has changed drastically from previous week – solid thrust up candle that engulfs previous bearish price action. This candle is a stop grabber as well, but it is simultaneously has taken out previous highs already, although with just 2-3 pips. Another bullish moment is that market is challenging monthly Pivot Resistance 1. This very often becomes a sign of upward trend. Here we see that market has enough room for upward continuation and this room has no resistance, except those where market stands now – MPR1 and .3150 Fib resistance. Moving slightly higher will trigger stop orders and upward move could become faster. The upward target based on weekly chart is 0.618 extension at 1.3350 and 1.27 extension of previous retracement down. Major target is 1.3830 – 5/8 Fib resistance, target of AB=CD pattern and 1.27 extension of weekly butterfly buy – sometime we’ve discussed it previously already. Here I do not see any bearish DiNapoli directionals or any bearish patterns, price action on previous week was rather strong. So, context is bullish here as well.
Daily
Overall picture is bullish here as well. We have smaller AB-CD pattern in progress, and market has reached 0.618 extension at 1.3160. Theoretically this is resistance, although minor one. CD lag is faster than AB. This could lead to either shallow retracement or no retracement at all. Sometimes it happens, when price passes with no respect 0.618 Fib extension, when move is really strong. Although we have two very good levels for entering long – first one is new WPP + nearest 3/8 support at 1.3060-1.3074. Next one is WPS1 and daily K-support around 1.2975-1.2990.
If we suggest that market will follow with existing direction, and taking in consideration all these moments that we’ve discussed, probably more logical is to suggest that first level has more chances to stop retracement. This scenario has a lot of bullish advantages – market will test WPP and continue move up, daily trend will remain bullish, this retracement will be more natural for AB-CD development, rather than deep retracement after just 0.618 target been hit.
Next significant resistance is 1.3230-1.3250 area – daily overbought and WPR1.
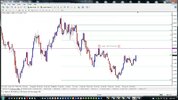
4-hour
4-hour chart gives us a hint, what to watch for if there will not be retracement on daily time frame. Here we have two different beacons at one point that very often become an objective of pullbacks after some significant breakout. They are broken high and 50% support level of long white candle. You can call it as Marubozo, if you want. This candle, by the way, will be an excellent barometer of retracement. If market will take it low – it will mean that market will show deeper correction down. It’s low is 5/8 support of recent swing up as well and breakeven point of 4-hour trend by MACDP.
On hourly chart I see only upward parallel channel, and, in fact, no signs of starting retracement yet, since market just has closed this upward thrusting candle and had no time to show any hint on retracement.
Conclusion:
Long term context gradually is turning to bullish with nearest target around 1.3350 and major target around 1.3830.
In the short term though, we have to be very sensitive and flexible to market price action in the beginning of the week and try to take retracement for long entry. One thing we should be aware of – fast downward acceleration, as usual, that is never in agreement with retracement kind of move.
Theoretically acceptable pullback is either to just 1.3125 or WPP at 1.3060. Deeper downward bounce will add piquancy in situation, because daily bullish trend could turn bearish.
The technical portion of Sive's analysis owes a great deal to Joe DiNapoli's methods, and uses a number of Joe's proprietary indicators. Please note that Sive's analysis is his own view of the market and is not endorsed by Joe DiNapoli or any related companies.
On monthly chart trend holds bullish, and within two bars we see bullish price action as well. Market gradually approaches to the upper border of K-resistance area. If market will break through it – next important level to watch is 1.3486 high. If market will show greater swing up and take out this level – that will be an appeal on reversal on monthly chart. Looks like our suggestions about potential solid bullish context more and more get confirmation from price action.
Let’s continue to monitor JPY as well. Interesting, that market stands in the process of neckline breakout…
Weekly
On weekly chart price action week by week eliminates questions. Situation has changed drastically from previous week – solid thrust up candle that engulfs previous bearish price action. This candle is a stop grabber as well, but it is simultaneously has taken out previous highs already, although with just 2-3 pips. Another bullish moment is that market is challenging monthly Pivot Resistance 1. This very often becomes a sign of upward trend. Here we see that market has enough room for upward continuation and this room has no resistance, except those where market stands now – MPR1 and .3150 Fib resistance. Moving slightly higher will trigger stop orders and upward move could become faster. The upward target based on weekly chart is 0.618 extension at 1.3350 and 1.27 extension of previous retracement down. Major target is 1.3830 – 5/8 Fib resistance, target of AB=CD pattern and 1.27 extension of weekly butterfly buy – sometime we’ve discussed it previously already. Here I do not see any bearish DiNapoli directionals or any bearish patterns, price action on previous week was rather strong. So, context is bullish here as well.
Daily
Overall picture is bullish here as well. We have smaller AB-CD pattern in progress, and market has reached 0.618 extension at 1.3160. Theoretically this is resistance, although minor one. CD lag is faster than AB. This could lead to either shallow retracement or no retracement at all. Sometimes it happens, when price passes with no respect 0.618 Fib extension, when move is really strong. Although we have two very good levels for entering long – first one is new WPP + nearest 3/8 support at 1.3060-1.3074. Next one is WPS1 and daily K-support around 1.2975-1.2990.
If we suggest that market will follow with existing direction, and taking in consideration all these moments that we’ve discussed, probably more logical is to suggest that first level has more chances to stop retracement. This scenario has a lot of bullish advantages – market will test WPP and continue move up, daily trend will remain bullish, this retracement will be more natural for AB-CD development, rather than deep retracement after just 0.618 target been hit.
Next significant resistance is 1.3230-1.3250 area – daily overbought and WPR1.
4-hour
4-hour chart gives us a hint, what to watch for if there will not be retracement on daily time frame. Here we have two different beacons at one point that very often become an objective of pullbacks after some significant breakout. They are broken high and 50% support level of long white candle. You can call it as Marubozo, if you want. This candle, by the way, will be an excellent barometer of retracement. If market will take it low – it will mean that market will show deeper correction down. It’s low is 5/8 support of recent swing up as well and breakeven point of 4-hour trend by MACDP.
On hourly chart I see only upward parallel channel, and, in fact, no signs of starting retracement yet, since market just has closed this upward thrusting candle and had no time to show any hint on retracement.
Conclusion:
Long term context gradually is turning to bullish with nearest target around 1.3350 and major target around 1.3830.
In the short term though, we have to be very sensitive and flexible to market price action in the beginning of the week and try to take retracement for long entry. One thing we should be aware of – fast downward acceleration, as usual, that is never in agreement with retracement kind of move.
Theoretically acceptable pullback is either to just 1.3125 or WPP at 1.3060. Deeper downward bounce will add piquancy in situation, because daily bullish trend could turn bearish.
The technical portion of Sive's analysis owes a great deal to Joe DiNapoli's methods, and uses a number of Joe's proprietary indicators. Please note that Sive's analysis is his own view of the market and is not endorsed by Joe DiNapoli or any related companies.
")