Sive Morten
Special Consultant to the FPA
- Messages
- 18,699
Fundamentals
This fundamental part of research will be rather small today, because there are not many major events that can have large influence on situation. As I’ve said in the previous week, the sovereign crisis has all chances to turn into a banking crisis. So, some rumors have appeared that Society General has a large derivatives loss, although they didn’t confirm it. Also here is some talking about Hungary and that it may fall into default. A spokesman for the government, Szijjarto, said that a default is no exaggeration. The government will not implement an austerity plan. Sizijjarto says the economy is in a grave situation. Linkages to Greece are being noted. Szijjarto said that the past government had falsified economic data, just like the past Greek government did. The truth for Greece has come, but it is yet to come for Hungary. In recent minutes, Hungary’s ex-Finance Chief Oszko said that Hungry is no where near default. At the same time, Hungary has to roll over 1.38 Bln $ of debts in August and 1.4 Bln $ in October. All this stuff in EU makes me think that at nearest time it will remind of a cartoon with EU officials as major persons who pressed down crisis signs here and there and crisis jumps out again and again in absolutely unpredictable areas.
Concerning US economy data, in general it’s not bad and mostly preferable for Fed – low inflation and no blast in major stats, just supportive growth – it helps hold the Fed rate at low levels that is a most desirable issue for the Fed right now. If they suddenly start to tighten rates right now – EUR would likely be able to move below parity. When Fed sees growing inflation pressure and meet necessity to raise rates – probably the EU economy will start to rise to that time and the impact of Fed tightening will not be so dramatic. As for payrolls, in general they were not very good. Basic expectations were around 500+K, release has shown 431K. US Treasuries have jumped a bit, stocks fell but, as I’ve said this is a quite suitable for the Fed. At the same time, ISM and other Confidence indexes are stayed higher than the 50 level and show mediate growth.
So, as a result, I expect that the crisis will turn from sovereign to public and private sector. Although some splashing can remain, like a situation with Hungary. I do not see definite shores right now and hold my expectation of gradual down move of EUR/USD.
If, suddenly inflation in US will start to rise and Fed will have to tight rate – EUR/USD fall becomes violent.
Technical
Monthly
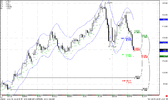
The monthly chart shows a great down thrust, trend is bearish; we have 8 candles in a row with strong bearish bias – no sign of a pullback. Market has passed through monthly 1.2022 Fib support. Next Fib support is 1.1391. ABC-top pattern gives us OP=1.1480 target that agrees with Fib support. That’s the Fib work. Let’s look at Pivot points. 1.2600 is a monthly Pivot and it has not been touched by market yet. 1.1864 is a monthly Pivot support 1 that shows a possible low for the month. 1.1405 is a monthly Pivot support 2. Oversold level for June, according to Oscillator Predictor is 1.1850. So, we get two combinations of supports:
1.1850 – Monthly Oversold and monthly Pivot support 1.
1.1391 – 1.1480 Fib Agreement (OP with Fib support) and Monthly Pivot support 2.
That’s being said - the market is near oversold condition and just below 1.2022 monthly Fib support, that can be still in play because June is not closed yet. So I don’t want to “Sell and Hold” in current condition. The trend is bearish, I want to be a seller, but I need a pullback to enter. The probability suggests that possible pullback in June can be from 1.1850. Until that level we can do scalp trades in lower time frames.
Weekly
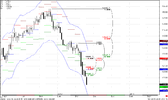
The weekly chart shows the same strong bearish bias, the trend is bearish. I expect that market should bounce a bit from 1.1864 level – Monthly Pivot support 1. There are two attractive areas to go short for medium-term trading. First – 1.2600-1.2660 – Weekly confluence resistance and monthly Pivot and second – 1.3030 – 1.3170 – Pivot resistance 1, weekly confluence resistance. If there will be a daily ABC-bottom pattern that agrees with one or another level – Bingo. But taking in consideration the strength of down move, it is very probable that the market will do a shallow retracements and the Monthly Pivot should hold. Despite strong oversold at monthly and weekly - 1.26 area to establish medium-term short position is preferable for me.
Daily
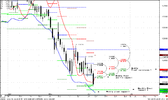
There is a lot of stuff here at daily. Let me explain this chicken soup to you. As I’ve said during the week – daily trend has turned bullish, but price movement has not confirmed that and this is a bearish bias. So that has happened – the market has exploded to the down side and now the trend turns bearish. The red line that shows trend is a MACD Predictor and it comes in play on next week. Small colored lines – weekly pivot points, long dash lines – monthly Pivot points. During the last three months – Weekly pivots holds the price action and price never reach weekly Pivot resistance 1. At the same time the market makes deep retracements – near 0.618 from the previous swing down.
First of all, it looks like that market will open below the weekly Pivot. If, on Monday, market continue move to downside 1.1828-1.1864 is area that I’ll be looking for to enter long. 1.1828 – weekly Pivot support 1, Monthly Pivot support 1- 1.1864 and daily oversold.
If, on Monday, market will open with some gap up – look for price action around Weekly Pivot. There will be a MACD Predictor also. If by the end of Monday market will hit weekly pivot, hit MACD Predictor and reverse back – closed below pivot – I’ll be searching for an opportunity to enter short with target at 1.1850. If market will close above Pivot and trend turns bullish – 1.2186-1.2230 that’s the area that I’ll be watching as a first target of a pullback, because – 1.2186 0.618 Fib resistance and as I’ve said, market makes deep retracements and 1.2230 – weekly Pivot resistance 1 and Fib resistance also.
So, conclusion – Buy near 1.1820-1.1850, sell on Monday if market will hit Pivot and close below it with 1.1850 target. Buy with 1. 2186-1.2230 target if the market will close above Weekly Pivot on Monday and trend will turn bullish.
This fundamental part of research will be rather small today, because there are not many major events that can have large influence on situation. As I’ve said in the previous week, the sovereign crisis has all chances to turn into a banking crisis. So, some rumors have appeared that Society General has a large derivatives loss, although they didn’t confirm it. Also here is some talking about Hungary and that it may fall into default. A spokesman for the government, Szijjarto, said that a default is no exaggeration. The government will not implement an austerity plan. Sizijjarto says the economy is in a grave situation. Linkages to Greece are being noted. Szijjarto said that the past government had falsified economic data, just like the past Greek government did. The truth for Greece has come, but it is yet to come for Hungary. In recent minutes, Hungary’s ex-Finance Chief Oszko said that Hungry is no where near default. At the same time, Hungary has to roll over 1.38 Bln $ of debts in August and 1.4 Bln $ in October. All this stuff in EU makes me think that at nearest time it will remind of a cartoon with EU officials as major persons who pressed down crisis signs here and there and crisis jumps out again and again in absolutely unpredictable areas.
Concerning US economy data, in general it’s not bad and mostly preferable for Fed – low inflation and no blast in major stats, just supportive growth – it helps hold the Fed rate at low levels that is a most desirable issue for the Fed right now. If they suddenly start to tighten rates right now – EUR would likely be able to move below parity. When Fed sees growing inflation pressure and meet necessity to raise rates – probably the EU economy will start to rise to that time and the impact of Fed tightening will not be so dramatic. As for payrolls, in general they were not very good. Basic expectations were around 500+K, release has shown 431K. US Treasuries have jumped a bit, stocks fell but, as I’ve said this is a quite suitable for the Fed. At the same time, ISM and other Confidence indexes are stayed higher than the 50 level and show mediate growth.
So, as a result, I expect that the crisis will turn from sovereign to public and private sector. Although some splashing can remain, like a situation with Hungary. I do not see definite shores right now and hold my expectation of gradual down move of EUR/USD.
If, suddenly inflation in US will start to rise and Fed will have to tight rate – EUR/USD fall becomes violent.
Technical
Monthly
The monthly chart shows a great down thrust, trend is bearish; we have 8 candles in a row with strong bearish bias – no sign of a pullback. Market has passed through monthly 1.2022 Fib support. Next Fib support is 1.1391. ABC-top pattern gives us OP=1.1480 target that agrees with Fib support. That’s the Fib work. Let’s look at Pivot points. 1.2600 is a monthly Pivot and it has not been touched by market yet. 1.1864 is a monthly Pivot support 1 that shows a possible low for the month. 1.1405 is a monthly Pivot support 2. Oversold level for June, according to Oscillator Predictor is 1.1850. So, we get two combinations of supports:
1.1850 – Monthly Oversold and monthly Pivot support 1.
1.1391 – 1.1480 Fib Agreement (OP with Fib support) and Monthly Pivot support 2.
That’s being said - the market is near oversold condition and just below 1.2022 monthly Fib support, that can be still in play because June is not closed yet. So I don’t want to “Sell and Hold” in current condition. The trend is bearish, I want to be a seller, but I need a pullback to enter. The probability suggests that possible pullback in June can be from 1.1850. Until that level we can do scalp trades in lower time frames.
Weekly
The weekly chart shows the same strong bearish bias, the trend is bearish. I expect that market should bounce a bit from 1.1864 level – Monthly Pivot support 1. There are two attractive areas to go short for medium-term trading. First – 1.2600-1.2660 – Weekly confluence resistance and monthly Pivot and second – 1.3030 – 1.3170 – Pivot resistance 1, weekly confluence resistance. If there will be a daily ABC-bottom pattern that agrees with one or another level – Bingo. But taking in consideration the strength of down move, it is very probable that the market will do a shallow retracements and the Monthly Pivot should hold. Despite strong oversold at monthly and weekly - 1.26 area to establish medium-term short position is preferable for me.
Daily
There is a lot of stuff here at daily. Let me explain this chicken soup to you. As I’ve said during the week – daily trend has turned bullish, but price movement has not confirmed that and this is a bearish bias. So that has happened – the market has exploded to the down side and now the trend turns bearish. The red line that shows trend is a MACD Predictor and it comes in play on next week. Small colored lines – weekly pivot points, long dash lines – monthly Pivot points. During the last three months – Weekly pivots holds the price action and price never reach weekly Pivot resistance 1. At the same time the market makes deep retracements – near 0.618 from the previous swing down.
First of all, it looks like that market will open below the weekly Pivot. If, on Monday, market continue move to downside 1.1828-1.1864 is area that I’ll be looking for to enter long. 1.1828 – weekly Pivot support 1, Monthly Pivot support 1- 1.1864 and daily oversold.
If, on Monday, market will open with some gap up – look for price action around Weekly Pivot. There will be a MACD Predictor also. If by the end of Monday market will hit weekly pivot, hit MACD Predictor and reverse back – closed below pivot – I’ll be searching for an opportunity to enter short with target at 1.1850. If market will close above Pivot and trend turns bullish – 1.2186-1.2230 that’s the area that I’ll be watching as a first target of a pullback, because – 1.2186 0.618 Fib resistance and as I’ve said, market makes deep retracements and 1.2230 – weekly Pivot resistance 1 and Fib resistance also.
So, conclusion – Buy near 1.1820-1.1850, sell on Monday if market will hit Pivot and close below it with 1.1850 target. Buy with 1. 2186-1.2230 target if the market will close above Weekly Pivot on Monday and trend will turn bullish.
Attachments
Last edited:
")