Sive Morten
Special Consultant to the FPA
- Messages
- 18,644
Fundamentals
Macro data currently is taking a back seat on the eve of the FOMC meeting on Wednesday. Many markets (US Treasuries for example) fall in consolidation. At the same time, the weak Non-farm payrolls is still fresh in memory and the housing market stays anemic as inflation due to latest PPI report. Not much positive is from Spain also. Although an oversubscription for Spain's 10-year bonds has taken place before the auction, they fell 2 percent in two days.
Today, two quite different camps are forming, on the view on current situation. The first camp includes those who believe that the economic recovery is underway. And there are facts that confirm that - industrial production increased by +1.2% in May (greater than expected), FedEx reports about growing turnover and reports about “very solid growth in Europe, strong shipments in between Europe and Asia and Asia and the US, continued inventory restocking, stable pricing ability and growth in volumes”. The second (pessimistic) camp also has its own facts. First of all, the housing market increased only for 593K in May. The market was looking for 648K after April’s 659K. These soft values confirm market’s concern about expiration of a home buyer tax credit program that can lead to a negative impact on real estate sphere. Besides, there is still uncertainty about the EU crisis which definitely will influence not only the US but the world economy also. There are rumors appearing on the market that IMF, US Treasury and ECB provide a credit line to Spain for E250 B (denied later) and FT has said that Spanish banks has borrowed already from ECB about E85Bln in the previous month. But my view on these rumors – “How could be smoke without a fire”.
I think that I’m closer to “second leg of recession” camp. Mostly because I’m very hard trade a US Treasuries futures. Now this market is in tight consolidation with the next main targets right in 0.618 retracement of historical yield lows. And I’ve said million of times – US Treasuries makes deep retracements when a move around the corner. Second is the Gold market. It reached and exceeded a historical OP. The only way now to XOP at 1400-1500 USD Per Troy Oz. The same is on stocks, Crude Oil. For example S&P 500 yearly Pivot is around 950 points. Everybody sees this strong down move, and I think that this is only an AB leg. After some retracement which will be BC-leg I expect strong move down to 950-1000 point area. Crude Oil should reach 65 USD per barrel. These are the numbers where I plan to open investment positions. And they are like a puzzle – one to one. That’s why I still think that we will see last gasp crisis move before this all comes to an end.
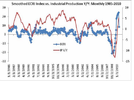
Also I want to say that ECRI (Economic Cycles Research Institute) strongly supports the pessimists. Their leading index fell to the lowest level since 31 of June 2009 and declined for 5 weeks in a row. This Index has a great correlation with Industrial production.
Technical
Monthly
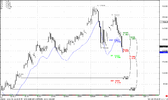
The monthly chart shows pullback from Fib support and oversold area. As I’ve said in previous research this is a monthly bullish “Stretch” pattern. At the same time, this time frame is very long, so we can’t just trade it here. It gives us some context for lower time-frames. Due to solid previous down move I expect that this is just a pullback in the down trend and think that next nearest target is Agreement area 1.1394 – 1.1480.
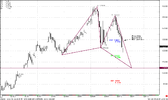
Look at the monthly#2 chart. This is a Butterfly Buy pattern. Usually It has 1.27 or 1.618 extension. I’ve marked a 1.27 butterfly. This is a bit tricky pattern, but if it works – it works, so target if butterfly is 1.0454 area.
Also I want to note here some movements from previous down move. Look at the chart – when market has reached oversold in last time – it has made a deep 0.618 retracement up. Possibly it could happen again. But this is just an observation.
So, that’s being said – the market has started a pullback and I think we can open long positions on shorter time frames.
Weekly
The weekly chart does not give us a particular signal, but it will be interesting for position traders. The trend is bearish still; the market has reached monthly Pivot support 1 and bounced a bit. There are 3 major areas on the weekly chart. First of all, if the market will continue to fall – 1.14-1.1480 area is what to watch for. Market should bounce from there. There are monthly Pivot support 2, weekly and monthly oversold, monthly OP target (see monthly chart).
But monthly “Stretch” pattern is in my mind still and I expect some bounce up. There are 2 interesting areas with strong resistance and suitable for opening long term short positions. First- 1.2600-1.2612 area – combination of Fib resistance and monthly Pivot point. I think that it should be reached during the June. Second, perfect from my mind – 1.3081-1.3118 – Weekly Confluence resistance Monthly Pivot resistance 1 and weekly oversold. Where definitely an up move should finish – I do not know. From one side – we are in a very strong bearish trend, and market should not make a deep retracement up. From the other side – we are extremely oversold on monthly and 1.31 area is a normal 0.382 retracement, nothing wrong with that. Besides, in 2009 was a very deep retracement in similar circumstances. So, my #1 is 1.31 area. Anyway, we should look to any daily ABC-bottom patterns. And if they will point on one or another area – this will be it.
Daily
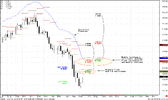
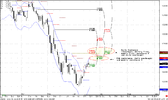
During the last two weeks, the market showed a nice up move, so the retracement of this move could be bought. Daily#1 chart shows levels that could become possible targets of up move. First level – 1.2500 area – Fib resistance and weekly Pivot resistance 1, also a daily overbought, and second level – 1.2580-1.2630 area includes daily Confluence resistance, monthly Pivot, weekly pivot resistance 2 and overbought. I expect that market should bounce from there before move to 1.30-1.31 area.
Macro data currently is taking a back seat on the eve of the FOMC meeting on Wednesday. Many markets (US Treasuries for example) fall in consolidation. At the same time, the weak Non-farm payrolls is still fresh in memory and the housing market stays anemic as inflation due to latest PPI report. Not much positive is from Spain also. Although an oversubscription for Spain's 10-year bonds has taken place before the auction, they fell 2 percent in two days.
Today, two quite different camps are forming, on the view on current situation. The first camp includes those who believe that the economic recovery is underway. And there are facts that confirm that - industrial production increased by +1.2% in May (greater than expected), FedEx reports about growing turnover and reports about “very solid growth in Europe, strong shipments in between Europe and Asia and Asia and the US, continued inventory restocking, stable pricing ability and growth in volumes”. The second (pessimistic) camp also has its own facts. First of all, the housing market increased only for 593K in May. The market was looking for 648K after April’s 659K. These soft values confirm market’s concern about expiration of a home buyer tax credit program that can lead to a negative impact on real estate sphere. Besides, there is still uncertainty about the EU crisis which definitely will influence not only the US but the world economy also. There are rumors appearing on the market that IMF, US Treasury and ECB provide a credit line to Spain for E250 B (denied later) and FT has said that Spanish banks has borrowed already from ECB about E85Bln in the previous month. But my view on these rumors – “How could be smoke without a fire”.
I think that I’m closer to “second leg of recession” camp. Mostly because I’m very hard trade a US Treasuries futures. Now this market is in tight consolidation with the next main targets right in 0.618 retracement of historical yield lows. And I’ve said million of times – US Treasuries makes deep retracements when a move around the corner. Second is the Gold market. It reached and exceeded a historical OP. The only way now to XOP at 1400-1500 USD Per Troy Oz. The same is on stocks, Crude Oil. For example S&P 500 yearly Pivot is around 950 points. Everybody sees this strong down move, and I think that this is only an AB leg. After some retracement which will be BC-leg I expect strong move down to 950-1000 point area. Crude Oil should reach 65 USD per barrel. These are the numbers where I plan to open investment positions. And they are like a puzzle – one to one. That’s why I still think that we will see last gasp crisis move before this all comes to an end.
Also I want to say that ECRI (Economic Cycles Research Institute) strongly supports the pessimists. Their leading index fell to the lowest level since 31 of June 2009 and declined for 5 weeks in a row. This Index has a great correlation with Industrial production.
Technical
Monthly
The monthly chart shows pullback from Fib support and oversold area. As I’ve said in previous research this is a monthly bullish “Stretch” pattern. At the same time, this time frame is very long, so we can’t just trade it here. It gives us some context for lower time-frames. Due to solid previous down move I expect that this is just a pullback in the down trend and think that next nearest target is Agreement area 1.1394 – 1.1480.
Look at the monthly#2 chart. This is a Butterfly Buy pattern. Usually It has 1.27 or 1.618 extension. I’ve marked a 1.27 butterfly. This is a bit tricky pattern, but if it works – it works, so target if butterfly is 1.0454 area.
Also I want to note here some movements from previous down move. Look at the chart – when market has reached oversold in last time – it has made a deep 0.618 retracement up. Possibly it could happen again. But this is just an observation.
So, that’s being said – the market has started a pullback and I think we can open long positions on shorter time frames.
Weekly
The weekly chart does not give us a particular signal, but it will be interesting for position traders. The trend is bearish still; the market has reached monthly Pivot support 1 and bounced a bit. There are 3 major areas on the weekly chart. First of all, if the market will continue to fall – 1.14-1.1480 area is what to watch for. Market should bounce from there. There are monthly Pivot support 2, weekly and monthly oversold, monthly OP target (see monthly chart).
But monthly “Stretch” pattern is in my mind still and I expect some bounce up. There are 2 interesting areas with strong resistance and suitable for opening long term short positions. First- 1.2600-1.2612 area – combination of Fib resistance and monthly Pivot point. I think that it should be reached during the June. Second, perfect from my mind – 1.3081-1.3118 – Weekly Confluence resistance Monthly Pivot resistance 1 and weekly oversold. Where definitely an up move should finish – I do not know. From one side – we are in a very strong bearish trend, and market should not make a deep retracement up. From the other side – we are extremely oversold on monthly and 1.31 area is a normal 0.382 retracement, nothing wrong with that. Besides, in 2009 was a very deep retracement in similar circumstances. So, my #1 is 1.31 area. Anyway, we should look to any daily ABC-bottom patterns. And if they will point on one or another area – this will be it.
Daily
During the last two weeks, the market showed a nice up move, so the retracement of this move could be bought. Daily#1 chart shows levels that could become possible targets of up move. First level – 1.2500 area – Fib resistance and weekly Pivot resistance 1, also a daily overbought, and second level – 1.2580-1.2630 area includes daily Confluence resistance, monthly Pivot, weekly pivot resistance 2 and overbought. I expect that market should bounce from there before move to 1.30-1.31 area.
Attachments
Last edited:
