FOREX PRO Weekly, January 31-February 04, 2011

EUR/USD Daily Update, Wed 02, February 2011

Good morning,

Well, unfortunately we didn't recieve either DRPO or B&B. Market just broke out 0.618 Fib resistance and continue move up.
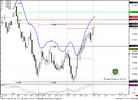
Now we can say that market just touched the pivot point at 1.3662 and go - this is normal bullish price action.

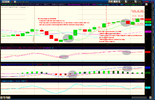
Today I do not see any strong signals that are worthy to be traded. So, all that I can do now is to show some levels to watch for:
1.39 area - 1.618 target of daily Butterfly "Buy", so be carefull in establishing any Long positions just below this area.
Above the market you can see on the chart deep Fib resistances - 0.786 and 0.88

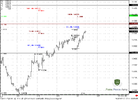
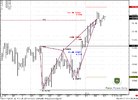
On 4-hour chart we see that market just accomplished not perfect AB-CD at 1.3817 and just above the market around 1.39 some additional targets, particularly 0.618 from recent ABC.

So, if you're bullish it's better to wait for some pullback to intraday support to enter on Long side of the market. If you're bearish - wait for possible Sell signals. I do not see any currently.
 

Attachments

  • EUR_D_02_02_11.PNG
    EUR_D_02_02_11.PNG
    46.4 KB · Views: 243
  • EUR_4H_02_02_11.PNG
    EUR_4H_02_02_11.PNG
    40.9 KB · Views: 244
Gbp/usd

Hi Sive,

I have opened a short position on GBP/USD a few days ago based on several daily patterns. However, the context and the setup is not there anymore. I wll need to close it. What strategy do you usually use in situations like these? any recommendation on levels of retracement from the current upmove I should watch for? Thanks.

Rasto
 
My chart

This chart will best explain what I saw yesterday and on the past move. I have created the exponential MACD in thinkorswim by modifying existing code. I have done the same with the Stochastic and the Dinapoli oscillator. I can not find out anywhere how the MACD predictor works or I would code that as well. Since I don't have the MACDP I have to rely on the other indicators and price patterns such as B&B and DRPO to trade daily trends. I am trading microlots until I become more confident and experienced.

As you will see on the chart I have included the MACD shows a strong uptrend and I usually will wait for a second close or a cross of the daily MACD in order to get in a position. The first set of highlighted circles shows the move starting 1/12/11 and the MACD gives confirmation on the second day along with a close above the 3x3. Yesterday I was foolish and thought I would anticipate a cross of the MACD and close below the 3x3 on the 4 hour chart as it was going down at the time. It cost me money but gave me more confidence in that I saw an uptrend on the MACD daily timeframe and no cross occurred.

Let me know what you think and also your thoughts on using fib extensions or drawing retracements for every A-B, B-C move and looking for confluence.

Thanks for all your advice and time,
Josh
 

Attachments

  • 2011-02-02-TOS_CHARTS.png
    2011-02-02-TOS_CHARTS.png
    78.4 KB · Views: 198
GBP/USD Update, Thu 03, February 2011

Good morning ladies and gentlemen,

Well, currently I find that GBP pair is a most interesting among the others, and here is why:
All my thought is on 4-hour chart:
1. Market has accomplished 1.618 butterfly "Sell"
2. MArket has accomplished 1.618 AB-CD pattern
3. Just above the market 1.6250 is a monthly pivot resistance 1.
4. On a way up market is showing excellent thrust up, close below 3x3, close above...

yes, there could be a double repo "Sell', if market will show close below 3x3 again. At the same time I prefer to see new highs and reaching of 1.6250. But if this will not happen, that is also OK.

So, that is what I personally will be track in today trading session.
 

Attachments

  • GBP_03_02_11.PNG
    GBP_03_02_11.PNG
    43.6 KB · Views: 185
  • GBP_4H_03_02_11.PNG
    GBP_4H_03_02_11.PNG
    38.9 KB · Views: 179
As you will see on the chart I have included the MACD shows a strong uptrend and I usually will wait for a second close or a cross of the daily MACD in order to get in a position. The first set of highlighted circles shows the move starting 1/12/11 and the MACD gives confirmation on the second day along with a close above the 3x3. Yesterday I was foolish and thought I would anticipate a cross of the MACD and close below the 3x3 on the 4 hour chart as it was going down at the time. It cost me money but gave me more confidence in that I saw an uptrend on the MACD daily timeframe and no cross occurred.

Let me know what you think and also your thoughts on using fib extensions or drawing retracements for every A-B, B-C move and looking for confluence.

Thanks for all your advice and time,
Josh

Hi Josh
If you let me, I make some notes about your chart.

1. 3x3 is not for trend determining. DiNapoli has used it, when he didn't have a MACD/Stochastic. MACD shows trend, not 3x3.

2. Your chart is too overloaded with different lines, has Joe said "don't analyse spaghetti chart" the simple rule here is "Less is more". Use only tools that are absolutely neccesary to you currently. Because your concetration is spreading amongst these indicators and you can't think sharp.

3. Be carefull with Stochastic. You should use smoothed averaging orModified averaging method for it. MT 4 has not these function in MQL language.

Now about the chart. I understand that you want to make a trend trade on daily time frame. Here is my chart below. We see, that market has confirmed up trend on 13th of January - Stochastic and MACD confirmed trend shifting at close. It's important.
Now, you need the retracement on lower time frame to enter on a long side of the market. At the same time you need bullish daily trend remains unchanged. We see such possibility two days later (17th of January).
Now, shift to 4-hour chart. Here you do not need Stochastic - only MACD. You need enter on retracement, when 4-hour MACD will turn bullish again after retracement.
This could be done 18th of January - I've marked for you this area. Although this is not a perfect example. Also you could do this later another couple of times.

Concerning current situation - see, MACD holds trend, stochastic is not, so you need treat current move as a retracement. If your target has not been achieved yet - you should hold position.

Hope it helps
 

Attachments

  • eur_d_03_02_11.gif
    eur_d_03_02_11.gif
    23.5 KB · Views: 176
  • eur_4h_03_02_11.gif
    eur_4h_03_02_11.gif
    23.8 KB · Views: 176
Thanks Sive Morten

I have been followng your analysis. I must say that they have been very helpful. I want to ask whether it is not possible for you to run a signal service. You are much better than most guys who claim to know forex inside out, yet give unreliable signal services. Just think about it.

Thanks once again for allyour free assistance. God bless you.


Pat Okoruwa
 
Thank you it does help. I have been using thinkorswim full stochastic with an EMA smoothing type and a 8 period slowing with a 3 period k and 3 period d. I believe you answered a question a long time ago about how Dinapoli uses an EMA stochastic. I am starting to round the curve and with your analysis it only helps me learn more. Thank you for answering my questions.
 
I have been followng your analysis. I must say that they have been very helpful. I want to ask whether it is not possible for you to run a signal service. You are much better than most guys who claim to know forex inside out, yet give unreliable signal services. Just think about it.

Thanks once again for allyour free assistance. God bless you.


Pat Okoruwa

I second that! ;)
 
GBPUSD chart differences

Hi Sive,

Thanks very much for all your analysis work. It is much appreciated.

I have attached todays' GBPUSD H4 chart with the MA 3x3 from my MT4 system.

Compared to your GBPUSD chart there are some differences:

- Where one of your bars closes below the MA mine does not (see red arrow)
- Also some bars have quite different open and closing prices/points
- Also the MA is shaped differently

Can you explain this ?
Has it got to do with the fact that you and I are maybe in a different timezones, hence our bars are maybe composed of different hours ?

Thanks you for taking the time.

Kind regards, BackSpace
 

Attachments

  • gbpusd h4 20110203.gif
    gbpusd h4 20110203.gif
    14.7 KB · Views: 112
Hi Sive,

Thanks very much for all your analysis work. It is much appreciated.

I have attached todays' GBPUSD H4 chart with the MA 3x3 from my MT4 system.

Compared to your GBPUSD chart there are some differences:

- Where one of your bars closes below the MA mine does not (see red arrow)
- Also some bars have quite different open and closing prices/points
- Also the MA is shaped differently

Can you explain this ?
Has it got to do with the fact that you and I are maybe in a different timezones, hence our bars are maybe composed of different hours ?

Thanks you for taking the time.

Kind regards, BackSpace

Hi,
guys, I've explained that milions of times, why are you so lazy to surf the forum archive?
THe point is that Forex is over-the-counter market, i.e. decentralized, so there are no "real" quotes and charts. You can find as much quotes and charts as much fx brokers.
here is my chart in MT4 from Alpari UK. It's absolutely normal.

That's why I use and trade futures - all quotes are come from exchange and fixed in database, all participants see the same quotes.
 

Attachments

  • gbp_4h_03_02_11.gif
    gbp_4h_03_02_11.gif
    27.5 KB · Views: 107
Back
Top