Sive Morten
Special Consultant to the FPA
- Messages
- 18,648
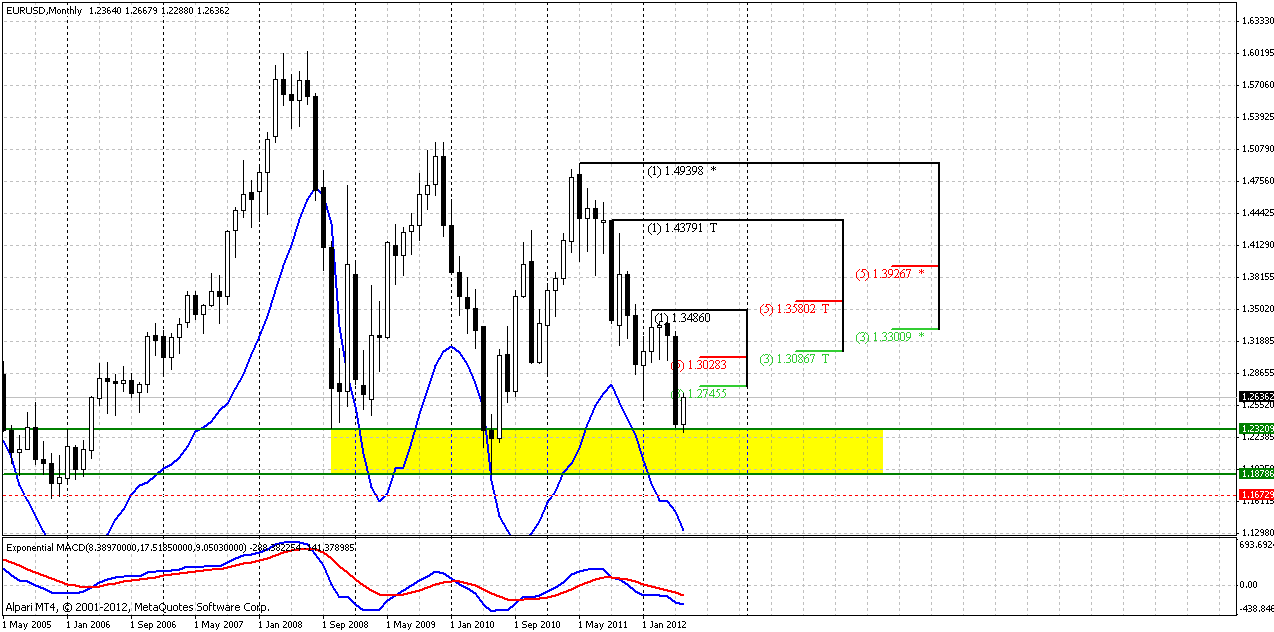
Monthly
Monthly trend holds strongly bearish. Very often after solid candles market takes some pause. This is not happen every time, but often. Now we see something of that kind. Although solid monthly resistance stands at 1.3028-1.3086 K-area, probably we should mostly focus on nearest resistance still – 1.2745. Usually market shows deeper bounce, when hitting some target and/or support level. That is what we particularly see during previous retracement, when market has hit 0.618 Fib extension target and 0.618 Fib support level. But currently market just stands at minor 0.886 support level.
Most important for us is that market stands just at upper border of 4-year support zone – 1.1870-1.2320. This level is extremely important for EUR currency. It has been tested twice already and both times that was at monthly oversold – that, probably, has prevented it’s breakout from technical point of view. Currently market is not at oversold and coming for 3rd testing of it. Since 1.2320 level was passed by move down in 2008, there are no significant barriers for market to proceed lower right to the lower border of it. Breakout of this area could trigger serious downward consequences for this pair.
If you let me, I still want to make single remark on possible upward retracement. That is what probably will take all our attention till the end of the month, since I see June mostly as retracement month. Although we’ve said that retracement should not be deep from perspectives of Fibonacci framework, it could become so from classical price action. Very often and many of you probably saw it, when market is testing some level for 2 times, usually it shows deep and almost equal bounce between these tests, while before breakout, last retracement approximately 2-3 times smaller, that indicates exhausting of support and buyers’ power around it. For us it means that we should be sensitive for upward price action, and possible move to 1.33-1.35 should not surprise us. I do not want to say that this has to happen, I still think that retracement, probably will be shallow (market already stands at 3rd testing of this area). I just want you to be sensitive, mind-open and flexible for any development and will not be frustrated by stronger upward action.
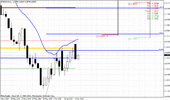
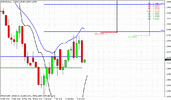
Weekly
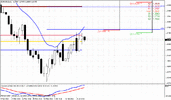
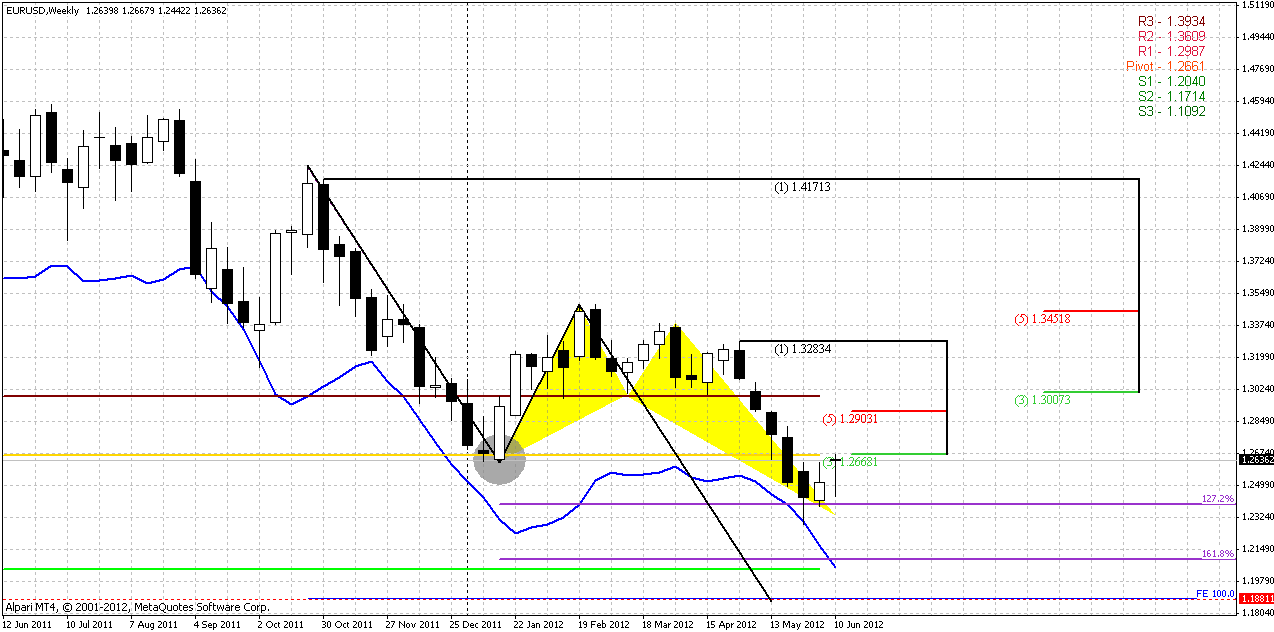
Another reason of potential deeper retracement is here. In the beginning I want to note that trend, based on MACD, will remain bearish till 1.30 level. That is also significant resistance level that includes K-resistance and MPR1. So, formally price moving even to 1.30 could be treated as retracement, since weekly bearish trend will cover it. And here we have reasons, why we have to aware of this move. First is, hitting of oversold level – also do not forget that this has happen at minor but monthly 0.88 Fib support. Second reason is 1.27 Butterfly “Buy” point. Although this butterfly actually has reached minimum target – 0.382 resistance of its way down, it could show some deeper upside move.
At the same time market has hit resistance as well. This is 1.2668 first Fib resistance, previous swing low and Monthly Pivot Point (MPP) that has been tested already. Currently I do not see clear signs here – will market continue move up or not. Our major pattern here is downward AB=CD. Its completion point stands precisely at lower border of Monthly support range – 1.1870.
I see only one way how task with upward retracement could be resolved – MPP. If on coming week market will move above it, then we should be prepared to deeper bounce, probably even to 1.30. Appointment more precise target will be possible only in our daily updates, depending on how price action will progress.
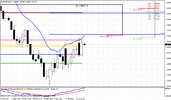
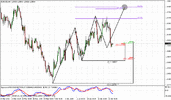
Daily
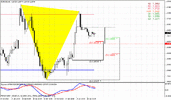
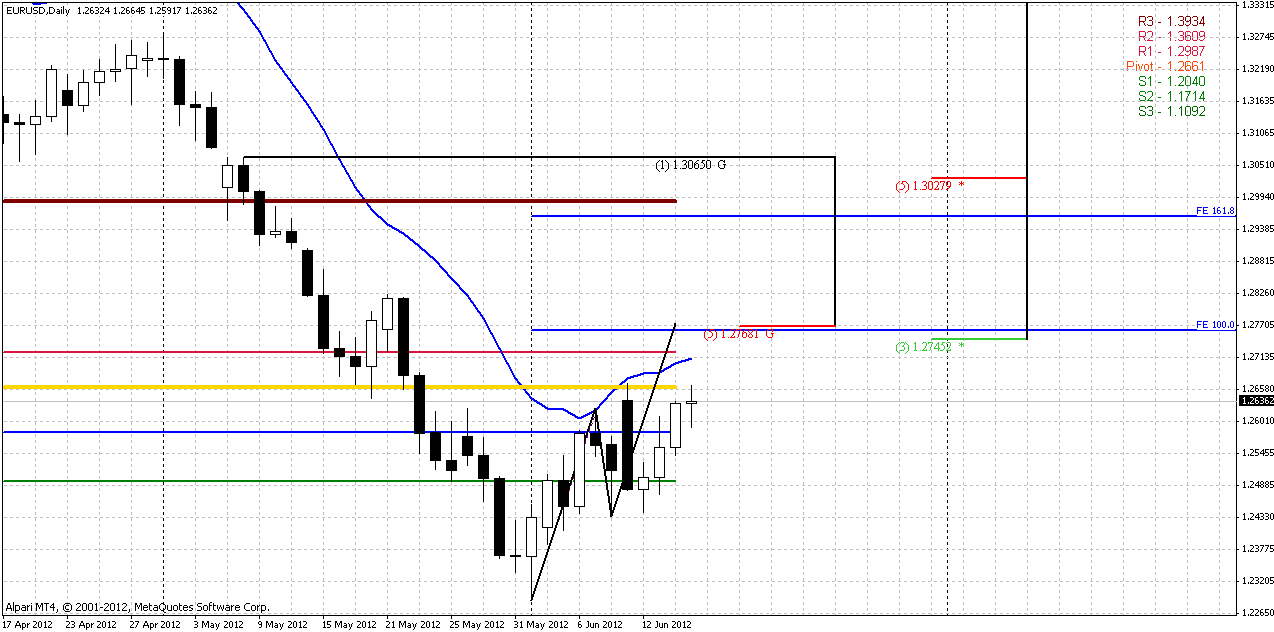
Trend holds bullish here. It difficult to predict how elections in Greece will turn, but based on technical picture market could continue move up, because it shows absolutely logical price action. After hitting 0.618 target and K-resistance 1.2620-1.2670 it has shown 50% retracement (mostly due daily oversold) and now approaches to this level again. Actually this is also 3rd testing of it. Situation progressing so, that probably it will be AB=CD move up. Target of this pattern stands at 1.2775 – that is also next K-resistance, WPR1 for coming week and, probably, this will be also daily overbought. This area is our major target area for coming week.
In longer perspective, if market will move even more higher, 1.618 extension of this AB=CD pattern stands precisely inside of weekly K-resistance and MPR1.
As we said higher – our attention in the beginning of the week should be on price action around WPP and MPP. They could clarify what to expect.
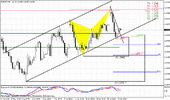
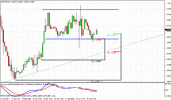
4-hour
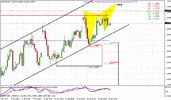
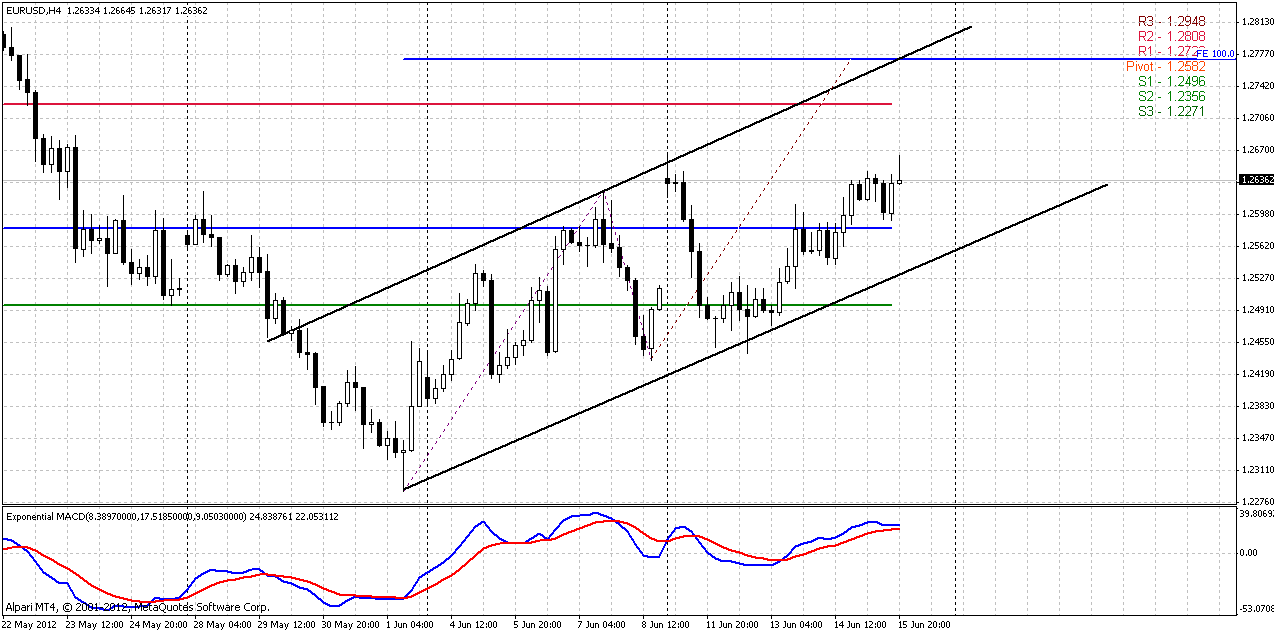
Here I would like to offer you a bit different view. Trend is bullish here. By dot line you can see our daily AB=CD pattern and it’s target around 1.2775 area, that will be also K-resistance on daily chart. If we will take into consideration leg’s slope, then we will see that CD leg is much flatter than AB. In fact, to be harmonic, this pattern should be finished in the middle of previous week. Usually with flatter CD leg, this pattern indicates that continuation higher than 1.0 extension will be difficult. This is just confirms that 1.2775 area is a good target for coming week.
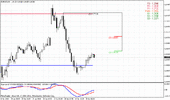
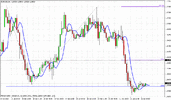
Hourly
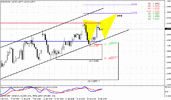
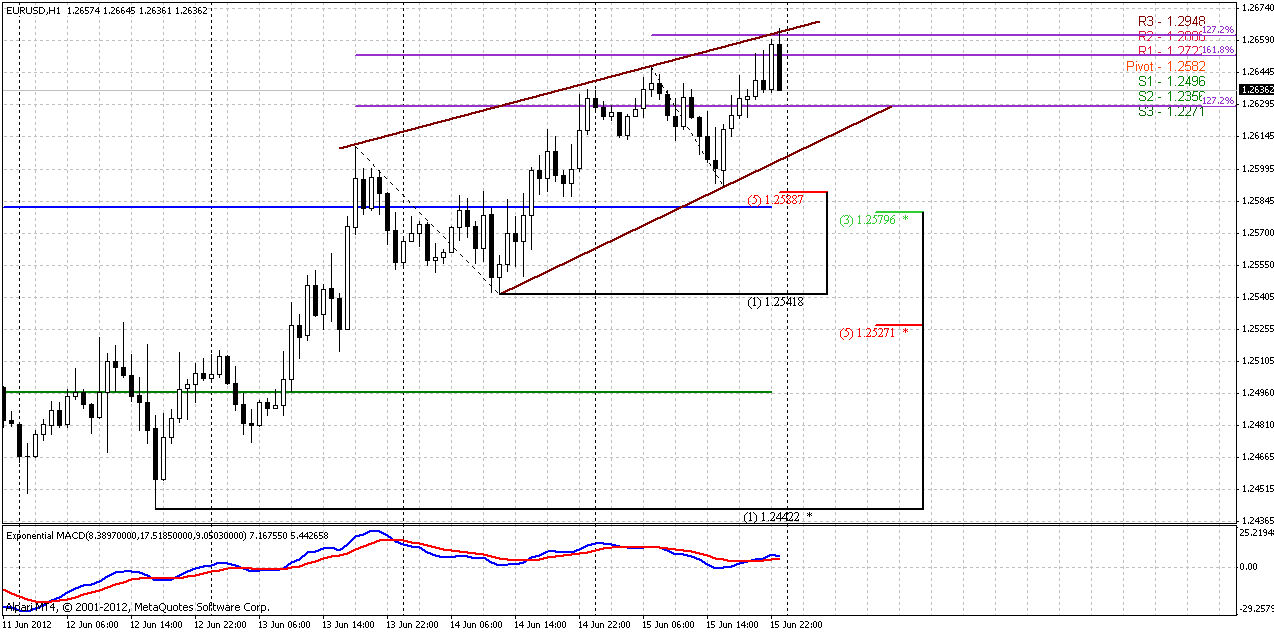
Hourly chart shows potential for retracement. Market has formed 3-Drive Sell pattern right under daily K-resistance area of 1.2668. Although it is not quite pretty, but ratios hold well – second top at 1.27 extension of first drive, while third at agreement of 1.618 and 1.27 extension of 1st and 2nd drives. 3rd drive finished by excellent bearish engulfing pattern.
As commonly happens, 3-Drive accompanied here by classical Wedge pattern and bearish divergence with MACD. Minimum target of 3-Drive is a second low – that is also WPP=1.2582 and hourly K-support area 1.2580-1.2588. Nice area to look for buy opportunity.
Conclusion:
Long-term traders should wait some continuation to the upside. Extremely we can’t exclude move even to 1.33-1.35, but current price action suggests that 1.2770-1.28 area is most probable as potential retracement target. 1.30 is possible, but less degree.
Greece elections could erase all our analysis for today. But currently our conclusion for coming week as follows:
Daily context is bullish and market has chances to proceed higher. Most probable target is 1.2775. Confirmation may come from price action around MPP. If price will move above 1.2670 – this will become a confirmation of upward continuation.
Although even 1.30 does not sound as unrealistic, current flat price action of AB=CD pattern, suggests that major resistance will appear around 1.2775.
On Monday market probably will show pullback to WPP, hourly K-support area due 3-Drive “Sell” pattern. This is an area to look for bullish entry – 1.2580-1.2589
The technical portion of Sive's analysis owes a great deal to Joe DiNapoli's methods, and uses a number of Joe's proprietary indicators. Please note that Sive's analysis is his own view of the market and is not endorsed by Joe DiNapoli or any related companies.
Monthly trend holds strongly bearish. Very often after solid candles market takes some pause. This is not happen every time, but often. Now we see something of that kind. Although solid monthly resistance stands at 1.3028-1.3086 K-area, probably we should mostly focus on nearest resistance still – 1.2745. Usually market shows deeper bounce, when hitting some target and/or support level. That is what we particularly see during previous retracement, when market has hit 0.618 Fib extension target and 0.618 Fib support level. But currently market just stands at minor 0.886 support level.
Most important for us is that market stands just at upper border of 4-year support zone – 1.1870-1.2320. This level is extremely important for EUR currency. It has been tested twice already and both times that was at monthly oversold – that, probably, has prevented it’s breakout from technical point of view. Currently market is not at oversold and coming for 3rd testing of it. Since 1.2320 level was passed by move down in 2008, there are no significant barriers for market to proceed lower right to the lower border of it. Breakout of this area could trigger serious downward consequences for this pair.
If you let me, I still want to make single remark on possible upward retracement. That is what probably will take all our attention till the end of the month, since I see June mostly as retracement month. Although we’ve said that retracement should not be deep from perspectives of Fibonacci framework, it could become so from classical price action. Very often and many of you probably saw it, when market is testing some level for 2 times, usually it shows deep and almost equal bounce between these tests, while before breakout, last retracement approximately 2-3 times smaller, that indicates exhausting of support and buyers’ power around it. For us it means that we should be sensitive for upward price action, and possible move to 1.33-1.35 should not surprise us. I do not want to say that this has to happen, I still think that retracement, probably will be shallow (market already stands at 3rd testing of this area). I just want you to be sensitive, mind-open and flexible for any development and will not be frustrated by stronger upward action.
Weekly
Another reason of potential deeper retracement is here. In the beginning I want to note that trend, based on MACD, will remain bearish till 1.30 level. That is also significant resistance level that includes K-resistance and MPR1. So, formally price moving even to 1.30 could be treated as retracement, since weekly bearish trend will cover it. And here we have reasons, why we have to aware of this move. First is, hitting of oversold level – also do not forget that this has happen at minor but monthly 0.88 Fib support. Second reason is 1.27 Butterfly “Buy” point. Although this butterfly actually has reached minimum target – 0.382 resistance of its way down, it could show some deeper upside move.
At the same time market has hit resistance as well. This is 1.2668 first Fib resistance, previous swing low and Monthly Pivot Point (MPP) that has been tested already. Currently I do not see clear signs here – will market continue move up or not. Our major pattern here is downward AB=CD. Its completion point stands precisely at lower border of Monthly support range – 1.1870.
I see only one way how task with upward retracement could be resolved – MPP. If on coming week market will move above it, then we should be prepared to deeper bounce, probably even to 1.30. Appointment more precise target will be possible only in our daily updates, depending on how price action will progress.
Daily
Trend holds bullish here. It difficult to predict how elections in Greece will turn, but based on technical picture market could continue move up, because it shows absolutely logical price action. After hitting 0.618 target and K-resistance 1.2620-1.2670 it has shown 50% retracement (mostly due daily oversold) and now approaches to this level again. Actually this is also 3rd testing of it. Situation progressing so, that probably it will be AB=CD move up. Target of this pattern stands at 1.2775 – that is also next K-resistance, WPR1 for coming week and, probably, this will be also daily overbought. This area is our major target area for coming week.
In longer perspective, if market will move even more higher, 1.618 extension of this AB=CD pattern stands precisely inside of weekly K-resistance and MPR1.
As we said higher – our attention in the beginning of the week should be on price action around WPP and MPP. They could clarify what to expect.
4-hour
Here I would like to offer you a bit different view. Trend is bullish here. By dot line you can see our daily AB=CD pattern and it’s target around 1.2775 area, that will be also K-resistance on daily chart. If we will take into consideration leg’s slope, then we will see that CD leg is much flatter than AB. In fact, to be harmonic, this pattern should be finished in the middle of previous week. Usually with flatter CD leg, this pattern indicates that continuation higher than 1.0 extension will be difficult. This is just confirms that 1.2775 area is a good target for coming week.
Hourly
Hourly chart shows potential for retracement. Market has formed 3-Drive Sell pattern right under daily K-resistance area of 1.2668. Although it is not quite pretty, but ratios hold well – second top at 1.27 extension of first drive, while third at agreement of 1.618 and 1.27 extension of 1st and 2nd drives. 3rd drive finished by excellent bearish engulfing pattern.
As commonly happens, 3-Drive accompanied here by classical Wedge pattern and bearish divergence with MACD. Minimum target of 3-Drive is a second low – that is also WPP=1.2582 and hourly K-support area 1.2580-1.2588. Nice area to look for buy opportunity.
Conclusion:
Long-term traders should wait some continuation to the upside. Extremely we can’t exclude move even to 1.33-1.35, but current price action suggests that 1.2770-1.28 area is most probable as potential retracement target. 1.30 is possible, but less degree.
Greece elections could erase all our analysis for today. But currently our conclusion for coming week as follows:
Daily context is bullish and market has chances to proceed higher. Most probable target is 1.2775. Confirmation may come from price action around MPP. If price will move above 1.2670 – this will become a confirmation of upward continuation.
Although even 1.30 does not sound as unrealistic, current flat price action of AB=CD pattern, suggests that major resistance will appear around 1.2775.
On Monday market probably will show pullback to WPP, hourly K-support area due 3-Drive “Sell” pattern. This is an area to look for bullish entry – 1.2580-1.2589
The technical portion of Sive's analysis owes a great deal to Joe DiNapoli's methods, and uses a number of Joe's proprietary indicators. Please note that Sive's analysis is his own view of the market and is not endorsed by Joe DiNapoli or any related companies.