acetraderfx
AceTrader.com Representative
- Messages
- 1,109
DAILY TECHNICAL OUTLOOK ON GBP/USD
Last Update At 28 Feb 2014 01:21GMT
Trend Daily Chart
Up
Daily Indicators
Rising
21 HR EMA
1.6677
55 HR EMA
1.6671
Trend Hourly Chart
Sideways
Hourly Indicators
Rising
13 HR RSI
63
14 HR DMI
+ve
Daily Analysis
Consolidation with upside bias
Resistance
1.6823 - Last Mon's 4-year high
1.6776 - Last Mon's NZ res
1.6728 - Tue's high
Support
1.6617 - Y'day's low
1.6583 - Mon's low
1.6537 - 50% r of 1.6252-1.6823
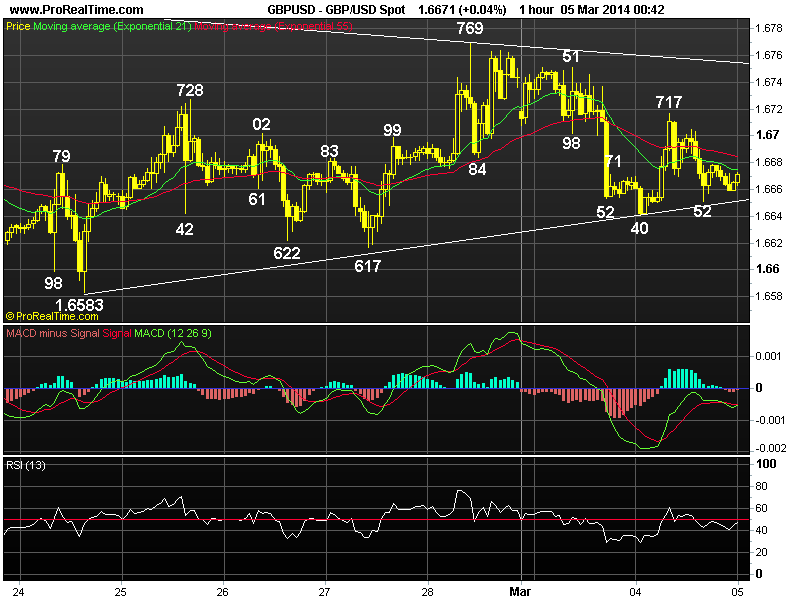
. GBP/USD - 1.6691 ... The British pound continued to fluctuate wildly on Thur. Although cable weakened fm Asian high at 1.6683 to 1.6617 in European morning, renewed buying interest there lifted price n sterling later rallied back to 1.6699 after dovish remarks by Fed Chair Janet Yellen b4 stabilising.
. Despite y'day's brief drop below Wed's low at 1.6622 to 1.6617, cable's
subsequent rebound after holding well abv Mon's low at 1.6583 suggests further 'choppy' sideways trading inside near term established broad range of 1.6583- 1.6728 wud continue with upside bias for gain to 1.6728 res (Tue's high), however, break is needed to signal the corrective fall fm last Mon's 4-year peak at 1.6823 has indeed ended at 1.6583 (Mon) n a daily close abv 1.6734/42, Feb 19 high n Feb 18 top respectively wud add credence to this view n yield possible resumption of MT uptrend for re-test of 1.6823 later next week.
. Today, we're holding a long position in anticipation of further gain. On
the downside, only below 1.6617 wud shift risk to the downside for a re-test of Mon's low at 1.6583, below wud bring stronger retracement of MT intermediate fm rise 1.6252 twd 1.6537 (being 50% r of 1.6252-1.6823) b4 prospect of recovery.
Last Update At 28 Feb 2014 01:21GMT
Trend Daily Chart
Up
Daily Indicators
Rising
21 HR EMA
1.6677
55 HR EMA
1.6671
Trend Hourly Chart
Sideways
Hourly Indicators
Rising
13 HR RSI
63
14 HR DMI
+ve
Daily Analysis
Consolidation with upside bias
Resistance
1.6823 - Last Mon's 4-year high
1.6776 - Last Mon's NZ res
1.6728 - Tue's high
Support
1.6617 - Y'day's low
1.6583 - Mon's low
1.6537 - 50% r of 1.6252-1.6823
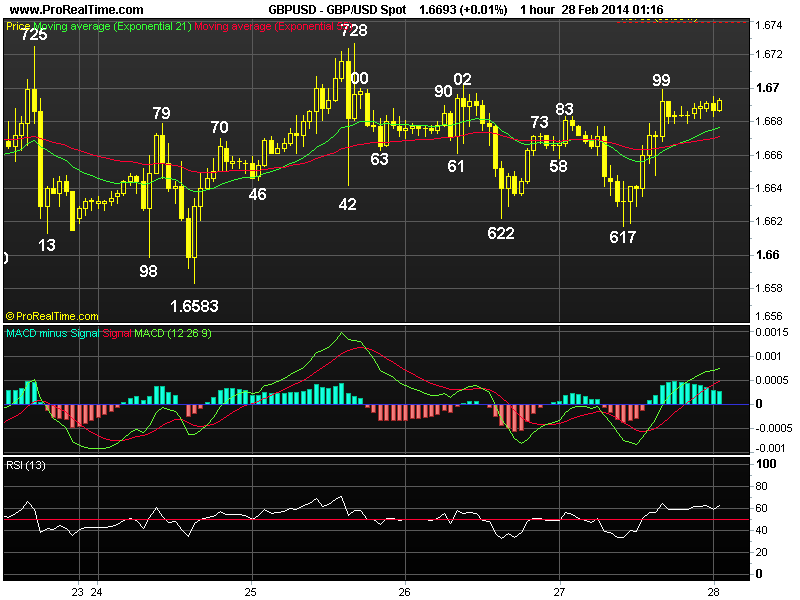
. GBP/USD - 1.6691 ... The British pound continued to fluctuate wildly on Thur. Although cable weakened fm Asian high at 1.6683 to 1.6617 in European morning, renewed buying interest there lifted price n sterling later rallied back to 1.6699 after dovish remarks by Fed Chair Janet Yellen b4 stabilising.
. Despite y'day's brief drop below Wed's low at 1.6622 to 1.6617, cable's
subsequent rebound after holding well abv Mon's low at 1.6583 suggests further 'choppy' sideways trading inside near term established broad range of 1.6583- 1.6728 wud continue with upside bias for gain to 1.6728 res (Tue's high), however, break is needed to signal the corrective fall fm last Mon's 4-year peak at 1.6823 has indeed ended at 1.6583 (Mon) n a daily close abv 1.6734/42, Feb 19 high n Feb 18 top respectively wud add credence to this view n yield possible resumption of MT uptrend for re-test of 1.6823 later next week.
. Today, we're holding a long position in anticipation of further gain. On
the downside, only below 1.6617 wud shift risk to the downside for a re-test of Mon's low at 1.6583, below wud bring stronger retracement of MT intermediate fm rise 1.6252 twd 1.6537 (being 50% r of 1.6252-1.6823) b4 prospect of recovery.
Last edited by a moderator: