OK, let's do update. I use Bitfinex clusters, UTC time.
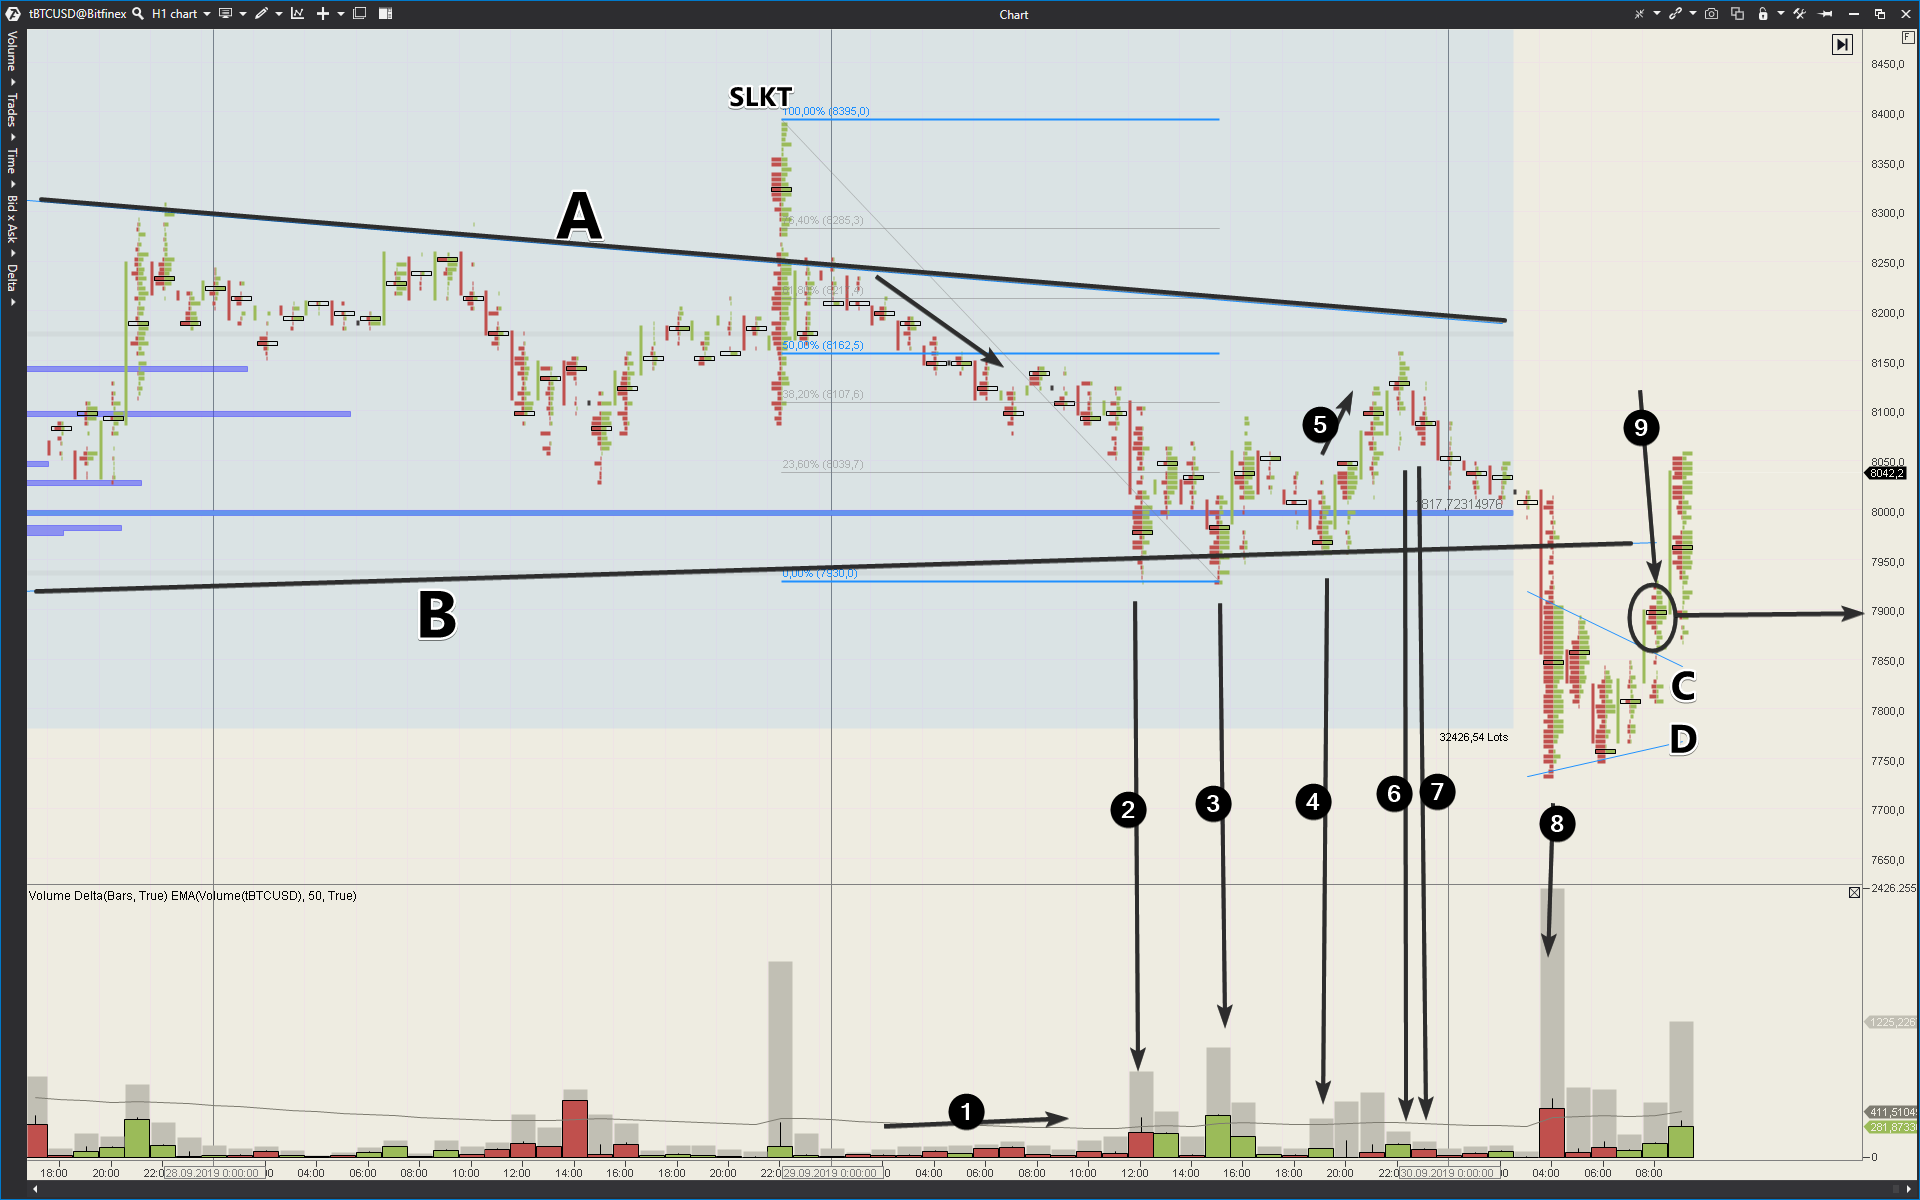
First of all, what is the context? Price has been moving inside balancing triangle/wedge AB for several days. (Note, it entered the wedge after falling - this fact increases odds for a bearish escape from balancing wedge - this concept often discussed in classical TA).
Second fact - SLKT above 8300. I pointed attention on this Killing of SLs of sellers (and trap for bulls) in Tradunity Main Telegram Chat.
So, we had the more weakness on background - this is context. What we had next?
1) Supply wave
2) Supply wave culminated in for of Panic at the level of line B (bottom/support level of balancing wedge).
3) Yes, this is EVRB (small progress for bears)
4) NS (lowering of volume on the level where Panic+EVRB were detected)
5) With a minor sequence of Strength (Panic+EVRB+NS), Bulls tried to push market higher.
6) But their power exhausted quickly. This is No Demand (low volume attempt to go up caused by a lack of buyers). Note, ND appeared just at 50% half way back of decline from SLKT 8350 to Panic 7950
7) SB (I'd like to see higher volume) and confirmation of ND. Bearish Cha Cha. Chart tells you market changed its sentiment. Holding longs became very risky as buyers were not ready to push market above 28/09 SLKT.
What's next?
8) An attempt of bears to break down big AB wedge. Volume was extremely high.
9) This bar tells that bearish attempted was about to fail. Because a lot of activity of this bar was registered above the body of minor balance CD. This is bullish sign and chart tells that bar #8 is likely to be a Big Trap for bears with killing SLs under 26/Sept low.
So, as
#BTCUSD is trading above 7900, I expect an attempt to break out line A.
")