Daily Market Report

EUR/USD implied volatility blows out ahead of ECB, US data: European open 14/09/2023​

Asian Indices:

  • Australia's ASX 200 index rose by 43 points (0.6%) and currently trades at 7,196.90
  • Japan's Nikkei 225 index has risen by 448.65 points (1.37%) and currently trades at 33,155.17
  • Hong Kong's Hang Seng index has fallen by -39.84 points (-0.22%) and currently trades at 17,969.38
  • China's A50 Index has risen by 1.65 points (0.01%) and currently trades at 12,583.36


UK and Europe:

  • UK's FTSE 100 futures are currently up 14 points (0.19%), the cash market is currently estimated to open at 7,539.99
  • Euro STOXX 50 futures are currently up 10 points (0.24%), the cash market is currently estimated to open at 4,233.48
  • Germany's DAX futures are currently up 35 points (0.22%), the cash market is currently estimated to open at 15,689.03


US Futures:

  • DJI futures are currently up 77 points (0.22%)
  • S&P 500 futures are currently up 14.25 points (0.32%)
  • Nasdaq 100 futures are currently up 71.5 points (0.47%)


20230914indices


Events in focus (GMT+1):

  • 13:15 – ECB monetary policy statement, interest rate decision
  • 13:30 – US jobless claims data, producer prices, retail sales
  • 13:45 – ECB press conference
  • 15:15 – ECB President Lagarde speaks


Today’s ECB interest rate decision and following press conference are clearly the standout events. But with a host of US data sandwiched in between, it could make for an interesting hour of trade for forex speculators.

Markets favoured a hawkish hold at the beginning of the week, but odds have now shifted in favour of another 25bp hike after ‘sources’ claimed that the ECB planned to increase their inflation forecast above 3%. But will that really change much? European data continues to underperform expectations according to the CESI (Citi Economic Surprise Index) whilst inflation remains above target. And even if we see a hawkish hike today, odds favour the ECB are at or very near their terminal rate.

Whilst this might support the euro to a degree, I suspect it will be more in line with a retracement higher as opposed to the beginning of a fruitful bullish trend. And where EUR/USD specifically is concerned, its upside potential is more likely to be dictated by USD weakness.

We’ll find out more of the details at the press conference at 13:45 BST, but traders should keep in mind that a host of US data is released at 13:30. And if retail sales, producer prices come in hot and jobless claims data is softer, markets might take yesterday’s hotter inflation figures a bit more seriously than they did and boost the US dollar and yields, to the detriment of the euro and stock market sentiment.


20230914ppi


But let’s look a bit further afield. If producer prices do feed into consumer prices, then it should be a concern that the PPI-CPI spread reached an extreme cycle low two months ago, and nudged up last month to suggest a trough is in place. And like many other indicators turning higher form multi-month lows, it points towards another bout of inflation in the months or even quarters ahead. And if a hot PPI is coupled with strong retail sales and soft jobless claims, I may have to revisit my call for an interim dollar top over the coming week/s. Either way, data might be a big driver today and has the potential to make or break trends.

Traders should take note that the 1-day implied volatility level for EUR/USD is over 200% of its 20-day average. On one hand, traders like volatility and that can bring opportunity. On the other, it can also bring pain, especially if the volatility is large but ultimately non-directional. So whilst the volatility may be there for traders, for a clean directional / sustained move, we'd likely need to see US data stacked one way, in an opposing direction to the perceived level of the ECB's hawkishness/dovishness.


20230914forex


EUR/USD technical analysis (daily chart):

The EUR/USD daily chart remains within an established downtrend and, whilst I have made a case for a USD reversal, it doesn’t mean the actual low on EUR/USD has been set yet. EUR/USD is creeping higher ahead of today’s data and events, and even if it managed to break above this week’s high then the 1.0800 barrier may provide better resistance further out. And that could tease bears into action at higher prices. If US data comes in hot and markets are unimpressed with the ECB’s hawkish tone or hike, bears may look to slam EUR/USD lower before it reaches last week’s high.

20230914eurusdD1


EUR/USD technical analysis (1-hour chart):

Intraday price action looks interesting on EUR/USD, because if recent price action is corrective as it appears, it assumes that at some point momentum has to realign with the prior impulsive move lower. In which case, bears may want to seek evidence of a swing high around resistance levels with a view of it eventually breaking to new lows.

If the data stacks up for a bullish move, bulls could wait for signs of swing low to form around support and seek a move towards 1.0800. Either way, keep in mind volatility is expected to be high, and if a setup is not there then sometimes the best trade is to do nothing.

20230914eurusdH1
 

EUR/USD headed for 105? WTI crude oil hits YTD high: Asian Open 15.09.2023​


Market Summary:

  • The ECB raised rates by 25bp, but took the surprising decision to (effectively) announce the end of their hiking cycle in their statement, even if Lagarde later denied it. Given the ECB continue to fight inflation, it could suggest the ECB are more concerned with the risking risks of a recession over higher prices (as a recession would presumably lead to lower prices anyway)
  • Staff forecasts raise their CPI target to 3.2% in 2024 and 2.1% in 2025 due to higher expected energy costs.
  • And whilst core CPI was revised lower, at 2.9% in 2024 and 2.2% in 2025, it still remains above the ECB’s target for the next couple of years.
  • US data also exceeded expectations, with retail sales, producer prices and jobless claims all beating forecasts. Whilst this keeps the pressure on the Fed to keep rates higher for longer, it also helped keep alive the ‘soft landing’ narrative for the US economy
  • Retail sales rose 0.6% (0.2% expected, 0.5% prior), producer prices rose 1.6% y/y (1.2% expected, 0.8% prior) or 0.7% m/m (0.4% expected and prior), core PI rose 0.6% m/m (0.4% expected, 0.75 prior).
  • The US dollar was the strongest forex major and Wall Street indices rose in tandem, with the Dow Jones leading gains with a near 1% rally, whilst the Nasdaq 100 and S&P 500 rose ~0.8%
  • EUR/USD was the weakest forex major, falling -0.8% during its worst day in seven weeks and closing beneath 1.0700 to a 4-month low
  • GBP/USD was the second weakest forex major and fell to a 3-month low, on growing expectations that the BOE have less of a need to remain hawkish following negative job growth and weaker mortgage data
  • WTI crude oil rose to a YTD high on expectations of tighter supply, surpassing our $90 target and now trades less to 4% from the October high


20230915movers


Events in focus (AEDT):

  • 11:30 – China’s house prices
  • 12:00 – China’s fixed asset investment, industrial production, retail sales, unemployment, NBS press conference


ASX 200 at a glance:

  • The ASX 200 cash index produced a bullish inside day on Thursday, although prices were caught between the March 2020 trendline and beneath the 200-day EMA
  • Yet the strong lead from Wall street and 1.2% rally on SPI futures point to a very strong open on the ASX 200 cash index today (and comfortably above 7200)
  • The area around 7260 makes a likely resistance zone today, but if APAC stocks extend sentiment from Wall Street then perhaps we’re in for a bullish end to the week.


20230915asxglance


EUR/USD technical analysis (weekly chart):

We noted a few months back that net-long exposure to EUR/USD futures remained relatively high. And whilst it has come off in recent weeks, I suspect many longs will now be questioning their exposure, given the ECB announced an end of-cycle hike and the Fed are to keep their (relatively higher) rates, higher for longer. We can see that large speculators and asset managers have been gently increasing their net-short exposure in recent weeks, so we might now see this accelerate whilst gross longs are close, resulting in lower net-long exposure. 105 seems within relatively easy reach over the near-term, and dare we say lower as the weeks progress. Of course, for now we’ll have to assume the May low (1.0635) and March low (1.0516) are likely interim support levels for bulls to try and defend. But unless we see a trigger to sell USD, then the downside now appears to be the path of least resistance.

20230915eurusd


WTI crude oil technical analysis (daily chart):

Oil prices are on fire. Not in the literal sense of course, but WTI’s bullish rally is defying USD strength to the point I wonder where it would be if the US dollar was falling. WTI closed just above $90 on Thursday and have gapped higher early on Friday in Asia. RSI (14) may be ‘overbought’, but that doesn’t mean much in an uptrend as there really is nowhere else for the indicator to go (and OB/OS levels are much more reliable during oscillating markets, and less so during trending markets). And until we see signs of a bearish divergence on the RSI alongside a break of a swing low on the price chart, I’ll have to assume the bull trend remains intact. Therefore, traders could seek bullish continuation patterns on lower timeframes towards the October high, or seek bullish setups following retracements.

20230915wti
 

FOMC, BOE, BOJ meetings, CPIs and flash PMIs: The Week Ahead 15/09/2023

Whilst the Fed are expected to hold rates steady in September, next week’s FOMC meeting also includes the quarterly staff projections. And changes to dot plot or CPI estimates can be as good as a hike where market reactions are concerned. The odds of another BOE are next week are not as high as they were, which makes the preceding inflation report paramount to expectations for their next decision. And whilst the BOJ are unlikely to act, that is no reason to drop your guard given their tendency to surprise once in a while. We also have flash PMIs for major regions and inflation data to mull over.

The week that was:


  • ECB hiked their interest rate by 25bp, and their statement hinted that it could be the last hike of the cycle (although Lagarde denied this at the press conference
  • US CPI came in hotter than expected, although the initial market response was muted as higher prices were largely expected anyway
  • Yet when the US delivered strong retail sales data producer prices and lower jobless claims data, the US dollar regained its strength and sent EUR/USD below 1.0700
  • US yields have paused around historical cycle highs yet again, despite US inflation picking up
  • WTI crude oil broke to a YTD high and above $90 as tight supply concerns outstripped concerns of a global slowdown
  • USD/JPY produced a relatively large weekend opening gap on Monday after BOJ Ueda discussed the potential of the central bank hiking interest rates, although made it clear it would not likely be this year


The week ahead (calendar):

20230915weekaheadFX


The week ahead (key events and themes):

  • FOMC interest rate decision, staff projections
  • BOE interest rate decision
  • BOJ interest rate decision
  • Inflation data for the UK, Canada, Europe and Japan
  • Flash PMIs


FOMC interest rate decision, staff projections

With Fed fund futures implying a 96% chance of the Fed holding interest rates next week, it would be an understatement to say that it would come as a surprise to markets if they hiked. Even though CPI, PPI, and retail sales all beat estimates this week, the FED Funds curve still favours the current target band of 5.25-5.5% as the terminal rate. However, they still imply a ~36% chance of a hike in November or December. Therefore, next week's FOMC meeting is really about how it will shape expectations for meetings from November and beyond.

This meeting will also include an update to the quarterly staff forecasts. In Q2, the median Fed rate was upgraded from 5.125% to 5.625%, implying that two more hikes were expected. The median forecasts for 2024 and 2025 were also upgraded, fuelling the "higher for longer" narrative. Given that we have already seen one of the two expected hikes implied in the Q2 projections, traders really want to know if the median has been lowered to signal that the current rate is the terminal rate. However, if it remains elevated, it suggests that there is one more hike to follow in November or December (assuming they don't stun markets with a hike next week).

It is also important to keep an eye on the updated forecasts for inflation. This will give a fuller picture of how hawkish the Fed is likely to be. If growth is updated, it will also feed back into the theme of a soft landing. However, if inflation is upgraded alongside growth, it would be deemed a more hawkish meeting and likely support the US dollar to the detriment of Wall Street indices.

Market to watch: EURUSD, USD/JPY, WTI Crude Oil, Gold, S&P 500, Nasdaq 100, Dow Jones

20230915fed


UK inflation and Bank of England (BOE) interest rate decision

Headline wage figures rose a staggering 7.8% y/y, or 8.5% including bonuses. Given the BOE have been concerned with a wage spiral and its forces on inflation, the initial assumption is that the central bank is not as close to their terminal rate as recent comments from certain members suggested. Yet these figures may not actually be as hawkish for the BOS, if the Office of National Statistics (ONS) is correct in saying they were bumped higher by “the NHS and Civil Service one-off payments made in June and July 2023”. And ING analysts suspect pay may have actually fallen recently by if using alternative wage measures based on payrolls.

Furthermore, employment growth fell at its fastest pace since August 2020 at -220k, GDP was estimated at -0.5% m/m versus -0.2% expected, construction output and industrial production also missed estimates and mortgage applications are falling. So, if next week’s inflation data comes in soft, perhaps the BOE are indeed close to the end of their tightening cycle.

The BOE’s interest rate currently sits at 5.25% and the 1-month OIS implies a 44% chance of a hike next week. The 3-month OIS has fully priced in one more hike, so it seems markets expect on more hike this cycle although the timing remains unclear. And that may leave’s next week’s CPI report to decide if the hike is next week or later in the year.

Market to watch: GBP/USD, GBP/JPY, EUR/GBP, FTSE 100

20230915boerate


Bank of Japan (BOJ) interest rate decision, Japan’s inflation and trade data

It is the usual drill with BOJ meetings; it is unlikely that we will see a policy change, but you need to keep your guard up for a surprise, just in case. If anything makes this one different, it is that BOJ governor Ueda is now vocal about the potential for the central bank to hike rates, even if it is not likely to happen this year. However, this has fuelled speculation that they may now opt to hike rates before abandoning their yield curve control (YCC). Besides, they widened their YCC band at their last meeting, so I do not personally think they will abandon it so soon. A Reuters poll also shows that 73% of economists expect the central bank to abandon YCC next year, although only 41% expect it to end negative interest rates next year.

20230915boj


While there was some excitement generated in the money markets for an increase in hikes recently, we have to go out to the 9-month overnight index swap (OIS) before it prices out negative interest rates. And even then, that is pulling back towards zero.

Inflation and trade data is also released. The CPI metric to keep an eye on is core excluding fresh food and energy, as it builds a case for a more hawkish BOJ if it continue to rise. It rose 4.3% in June and August which was 42-year highs. And with the monthly read rising another 0.5% (and increasing 6 of the past 7 months) then a print of 0.6% or higher could bring forward expectations of a BOJ hike and weigh on USD/JPY.

Market to watch: USD/JPY, AUD/JPY, GBP/JPY, EUR/JPY, Nikkei 225


20230915jpCPI


Canada’s inflation report

The Bank of Canada (BOC) held interest rates at 5% last week, although Governor Macklem warned that rates may still not be restrictive enough to bring CPI back to target. However, a recent Reuters poll suggests a 44% chance of another hike this year, the OIS curve has flattened and even the 6-month OIS implies less than a 50% chance of a hike. And that makes Canada’s inflation report next week quite important for traders to assess the probabilities of another hike, because if rises like we saw in the US this week it will increase hawkish expectations of the BOC with it.

20230915caCPI


S&P global flash PMIs

Flash PMIs are released for major economies including the US, Europe, UK and Japan next week. I’m curious to see what if the S&P global composite survey suggests that the US economy has entered a contraction, as it rose to a mere 50.2 last month (above 50 is expansion, below is contraction). Admittedly it may be more exciting if it happened ahead of the FOMC meeting, but it could dampen some hawkish expectations of the Fed if it dips below 50 for the first tie this year. We can see the general trend for Europe and Australia is pointing lower and that Japan is the exception. But traders will also keep an eye on the ‘prices paid’ indices to see if inflationary pressures continue to pick up.

Market to watch: EURUSD, GBP/USD, AUD/USD, USD/JPY, WTI Crude Oil, Gold, S&P 500, Nasdaq 100, Dow Jones

20230915compositePMIs
 

Gold rallied from its 200-day EMA on Friday: Asian Open – 18/09/2023​

Market Summary:

  • An increase in labour costs is expected to see US retailers reduce hiring to lower levels not seen since 2008. 410k jobs are expected to be added, compared with 519k in Q4 2022- which itself was -26% lower than the previous year.
  • US consumer confidence slipped from its 22-month high, but the bigger news is that inflation expectations continued to diminish. 1-year CPI expectations are now at the 33-month low of 2.7% and the 5-year is at a 32-month low of 3.1%.
  • This helped gold prices recover back above its 200-day EMA on Friday, during its most bullish day in 13.
  • Yet bond yields continued to advance and weighed on sentiment for Wall Street indices, on the prospects that the Fed will keep interest rates higher for longer
  • Tech stocks led the declines on Friday with the Nasdaq 100 falling -1.75% (-0.51% for the week) and the S&P 500 was down by -1.21% (-0.16% for the week). Both indices are on track for a bearish month, in line with their seasonal patterns.
  • The US dollar index posted a small inverted hammer on Friday just beneath 105.50 and trades ~0.5% beneath it YTD high, yet still managed to rise for a 9th consecutive week, which is its most bullish sequence since September 2014
  • The Nikkei 225 rose to a 10-week high on Friday ahead of the long weekend in Japan. It now trades just -0.74% from a 33-year high.
  • Oil prices rose for a third week with WTI crude oil closing the week above $90 for the first time this year, which itself raises concerns that inflation will remain high and force the Fed to maintain higher rates for longer
  • Bets that the BOE may hike for their last time this cycle this week continued to weigh on the British pound, sending GBP/USD to a 3.5-month low and closing beneath its 200-day EMA and 200-day average last week
  • AUD/USD rose nearly 2% last week, which was its best week in two months and USD/CAD suffered its worst week in 15 as rising oil prices continued to support the Canadian dollar.
20230918moversCI


Events in focus (AEDT):

  • Public holiday in Japan
  • No major economic news is scheduled for today


ASX 200 at a glance:

  • The ASX 200 rallied for a second consecutive day on Friday and extended its run from the March 2020 trendline
  • It was its most bullish day in nine weeks ad most volatile daily range in ten weeks
  • However, a weak lead from Wall Street and SPI futures (which were -0.56% by Friday’s close) means the cash index is expected to open lower today


20230918asxglance


Gold technical analysis (daily chart):

I was looking for evidence of a swing low last week, and it seems Thursday was the day it happened, with a small bullish doji forming just above the 1900 level. A strong rally on Friday suggest the low is in place and prices recovered back above the 200-day EM, although it failed to hold above the 200-day MA (dotted green line), and the high of the day respected the 50 and 100-day EMA’s. Whist I suspect further gains are possible, it may be a case of patiently waiting to see if we can see a pullback to more desirable levels to help increase the potential reward to risk ratio.

20230918goldD1


Gold technical analysis (1-hour chart):

Gold’s rally into the 1930 resistance area was accompanied with high volumes to show bulls entering the market. Volumes also diminished whilst prices pulled back from Friday’s high to suggest the move lower is corrective. The weekly pivot point sits within a consolidation zone between 1916 – 1920, so id prices continue to drift lower the 1916 – 1920 zone is an area of interest for a potential swing trade long back towards 1930. Of course, we’d need to see the US dollar and bond yields move lower before we could expect a sustained rally on gold, and as the FOMC meeting looms I suspect markets will trade in choppy ranges – which makes intraday swings more appealing for now.

20230918goldH1
 

Gold bulls reclaim key levels, ASX 200 pulls back to support: Asian Open 19/09/2023​

Market Summary:

  • There was a bit of excitement (and likely fear) in yesterday’s Asian session when the US 2-year bond experienced a mini flash crash, sending the yield up ~40bp during low liquidity trade, although the move was quickly put down to a technical glitch.
  • It was a little less exciting for currency markets with all FX majors trading within their average true ranges (ATRs), although the Canadian dollar was given a boost following stronger-than-expected housing data and industrial prices. Canada releases a key inflation report later today which could sway markets into pricing in another Bank of Canada (BOC) hike.
  • USD/CAD fell to a 25-day low and achieved 94% of its 10-day ATR, before finding support at its 50-day EMA.
  • The British pound continued to decline on speculation the BOE may even pause (if not announce one) at this week’s meeting. GBP/CAD closed beneath its 200-day EMA for the first time in three months
  • It was also quiet on Wall Street, with the Nasdaq 100 and S&P 500 both gapping lower on to their 50-day EMAs before closing the gap and posting a minor gains on the day
  • And we could find markets continue to chop around on reduced volumes without a clear catalyst, with the Wednesday’s FOMC meeting and Thursday’s BOE meeting in the pipeline
  • USD/JPY traded within a tight range beneath its 9-month highs and 148 handle. Perhaps we’ll see volatility increase with Japan’s traders returning to their desks after a 3-day weekend, but with the FOMC meeting looming it feels like a coin flip as to whether prices will pull back or break above 148 ahead of it
20230919movers


Events in focus (AEDT):

  • 11:30 – RBA minutes: I’m not expecting anything profound from today’s minutes, as data has backed up the RBA’s decision to hold rates at 4.1% fore the foreseeable futures and it was Governor Lowe’s last meeting at the helm.
  • 19:00 – European CPI
  • 22:30 – US building permits
  • 23:30 – Canada’s CPI: With data coming in hotter than the BOC would like, today’s inflation report has the potential to sway market opinion towards another hike if CPI continues to misbehave around elevated levels. Yes inflation has peaked, but its not slowing as quickly as the BOC would like, and with US CPI and inflation inputs for Canada turning higher, it leaves the potential for an upside surprise in today’s figures.


ASX 200 at a glance:

  • The ASX 200 retracted around half of Friday’s gains to quickly remind traders of its choppy nature price action seems to exhibit each time it trades above 7300
  • For that reason, I would prefer to stick with intraday timeframes to seek opportunities and not expect large sustained price swings to develop on the daily chart
  • With SPI futures pointing to a weaker open, perhaps the ASX 200 can find some support around or even above the 7200 handle, near its 200-day EMA
  • A gap lower could even see the 4-hour RSI reach overbought to hint at a swing low, in which case we could consider a cheeky swing trade long for a move back up to its 200-day MA (dotted) around 7240
20230919asxglance


20230919asx200


Gold technical analysis (4-hour chart):

Yesterday I was looking for a pullback towards the 1916-1920 area near the weekly pivot, although the pullback was minimal due to a helping hand from the 200-day MA. Given the significance of the level, I am now wondering if we’ll see prices continue to move higher heading into the FOMC meeting. Especially since we have now seen gold break back above the 200-day EMA as well.

A bullish engulfing candle formed on the gold 4-hour chart, so any retracement within it could improve the potential reward to risk ratio for a move above the weekly R1 pivot, towards R2 / 1950.

20230919gold
 

USD/CAD in the crossfire of CA CPI and FOMC: European open – 19/09/2023​

Asian Indices:

  • Australia's ASX 200 index fell by -30.6 points (-0.42%) and currently trades at 7,199.80
  • Japan's Nikkei 225 index has fallen by -296.36 points (-0.88%) and currently trades at 33,236.73
  • Hong Kong's Hang Seng index has risen by 3.11 points (0.02%) and currently trades at 17,933.66
  • China's A50 Index has fallen by -18.74 points (-0.15%) and currently trades at 12,579.17


UK and Europe:

  • UK's FTSE 100 futures are currently up 11.5 points (0.15%), the cash market is currently estimated to open at 7,664.44
  • Euro STOXX 50 futures are currently up 3 points (0.07%), the cash market is currently estimated to open at 4,248.88
  • Germany's DAX futures are currently up 2 points (0.01%), the cash market is currently estimated to open at 15,729.12


US Futures:

  • DJI futures are currently down -7 points (-0.02%)
  • S&P 500 futures are currently down -1.25 points (-0.03%)
  • Nasdaq 100 futures are currently down -11.25 points (-0.07%)


20230919indices


Events in focus (GMT+1):

  • 10:00 – European CPI
  • 13:30 – US building permits
  • 14:30 – Canada’s CPI


With the ECB effectively confirming that they are done with hiking interest rates, it could take a particularly strong set of inflation figures for markets to expect otherwise. Even if CPI data is slightly hotter than expected, it doesn’t remove that fact that Europe is staring down the barrel of a recession, and if inflation is too high it is likely recessionary anyway.

And that may make Canada’s inflation data the more interest release of the two, as it’s not unreasonable to suspect CPI may surpass expectations and rekindle bets of another Bank of Canada (BOC) hike.

Rising energy costs are expected to send CPI up to 3.8% y/y from 3.3%, although the monthly read is inly expected to rise 0.2% versus 0.6% previously. So if there is to be any surprises, it’s likely to be the m/m read for CPI. Also keep an eye on Median and Trimmed Mean CPIs, as these are the preferred measures for the BOC and have remained relatively high at 3.7% and 3.6% y/y respectively.

Currency ranges may remained limited and price action choppy, with an FOMC meeting less than 48hrs away. And that is being reflected in 1-day implied volatility levels, with USD/JPY, USD/CHF, AUD/USD and NZD/USD IVs below their 20-day average. USD/CAD and EUR/USD 1-day IVs are also only slightly above their 20-day average.

GBP/CAD is teasing its 3-month cycle lows after closing firmly beneath its 200-day EMA yesterday. CAD/JPY is probing its 11-month high and looks keen to try and test 110, just beneath the October and 2022 highs.


20230919forex


USD/CAD technical analysis (daily chart):

USD/CAD finally saw the bearish reversal I had pencilled in, after bulls failed to hold on to gains around the April and May highs. A 2-bar reversal pattern formed at the highs and the pair has pulled back to its 50-day EMA, just above the 38.2% Fibonacci level. A slight bullish divergence is trying to form on the RSI (2), which reached oversold (below 10) on Thursday.

USD/CAD is likely to be driven by today’s CPI data for Canada and tomorrow’s FOMC meeting, so volatility can be expected. The 1-week implied volatility levels suggest a 66% chance of USD/CAD closing within the 1.3376 – 1.3578 range, although take note that the 50% retracement level and 200-day EMA sit just above the lower range.

And with risks that Canada’s inflation may surprise to the upside, perhaps we’ll a break beneath the 50% level and head for 1.3400. However, there’s a decent chance that the Fed meeting may not be as dovish as some hope and, with oil prices looking set for a pullback, perhaps USD/CAD can carve out a swing low following the FOMC meeting.

20230919usdcad
 

WTI crude oil finally set to mean revert? Asian Open - 20/09/2023​

Market Summary:

  • Canada’s inflation rose faster than expected which raises the odds of another BOC hike on 25 October
  • Whilst deputy BOC governor Zokicki acknowledged that headline inflation was volatile, and supported by energy costs, underlying inflation is “well above” a level consistent with their 2% inflation target
  • The Bank of Canada’s preferred measure of inflation also turned higher, with median CPI rising 4.1% y/y (3.7% expected, prior upgraded to 3.9%) and trimmed mean rising 3.9% y/y (3.5% expected, 3.6% prior). CPI rose 4% y/y (3.8% forecast, 3.3% prior) and 0.4% m/m (0.2% forecast, 0.6% prior).
  • The Canadian dollar was the strongest forex major, sending USD/CAD down to our lower target around the 200-day EMA and 50% retracement level before bouncing into the close. CAD/JPY probed the October high and GBP/CAD hit a 6-month low
  • US bond yields continued to climb ahead of the FOMC meeting, with yields seemingly siding with the prospects of a more hawkish Fed meeting. It’s possible we’ll see an upgrade to their CPI forecast, although my immediate attention will be to see whether the dot plot edges higher for the 2023 or 2024 period, and prompt money markets to price in another potential hike and send they
  • Wall Street was initially lower but the S&P 500 managed to hold above trend support projected from the 4 May low and closed just beneath the 50-day EMA
  • EUR/USD rallied into the 61.8% Fibonacci level mentioned in yesterday’s report before reversing lower and forming a bearish hammer on the daily chart and closing back beneath 1.07
  • USD/JPY continued to trade within a tight range, clearly awaiting the outcome of the FOMC meeting. 148 remains the clear barrier for bulls to break or bears to fade into over the near term. Big move coming, one way of the other
20230920movers


Events in focus (AEDT):

  • 09:50 – Japan trade balance
  • 11:30 – Australian leading index (Melbourne Institute)
  • 11:15 – PBoC Loam Prime Rate (1yr, 5yr)
  • 16:00 – UK inflation: With US and Canadian inflation now curling higher, it could set the scene for another undesirably hot inflation report from the UK today. And that could cement another rate hike from the BOE tomorrow
  • 04:00 – FOMC meeting:
  • 04:30 – FOMC press conference:


ASX 200 at a glance:

  • The ASX 200 continued lower for a second day to erase most of Friday’s gains and closed beneath the 200-day EMA and 7200 level
  • Wall Street and SPI also point to a weak open, which could make 7200 as a resistance level early in today’s session
  • There’s a decent chance that volatility could be reduced in today’s Asian session due to the pending FOMC meeting, and to place a directional bet for the remainder of the week would be to take a punt on if the Fed are more hawkish than expected (likely bearish stocks) or less hawkish than expected (likely supportive of stocks)
  • Otherwise, traders may want to step aside and see how the dust settles tomorrow, before choosing a bias
20230920asxglance


WTI crude oil technical analysis (daily chart):

We have all been watching oil prices climb alongside concerns of higher inflation. It’s rally barely paused for breath with a break above $90, although WTI crude oil has hinted at a potential retracement via a key reversal, with a bearish hammer on high volume and a bearish divergence with the RSI (2). That its high failed to retest the October and November highs adds to the case for a near-term reversal.


With the FOMC meeting looming and the potential for the Fed to deliver a more hawkish tone than the Fed Fund futures imply, a stronger USD and growth concerns could weigh on oil prices over the near term to finally trigger a retracement.


A break beneath $90 opening up a run for $87 – near the volume node of the preceding leg higher. Alternatively, bears could seek to fade into minor rallies with a stop above the hammer high or October / November highs in anticipation of a break below $90. An obvious risks to keep in mind is if the Fed are not as hawkish as I suspect, which could weigh on the US dollar and support appetite for risk and send oil prices higher.

20230920wti
 

EUR/USD, GBP/USD, WTI crude oil analysis: European open – 20/09/2023​

Asian Indices:

  • Australia's ASX 200 index fell by -45.6 points (-0.63%) and currently trades at 7,151.00
  • Japan's Nikkei 225 index has fallen by -149.72 points (-0.45%) and currently trades at 33,092.87
  • Hong Kong's Hang Seng index has fallen by -134.81 points (-0.75%) and currently trades at 17,862.36
  • China's A50 Index has fallen by -46.88 points (-0.37%) and currently trades at 12,553.07


UK and Europe:

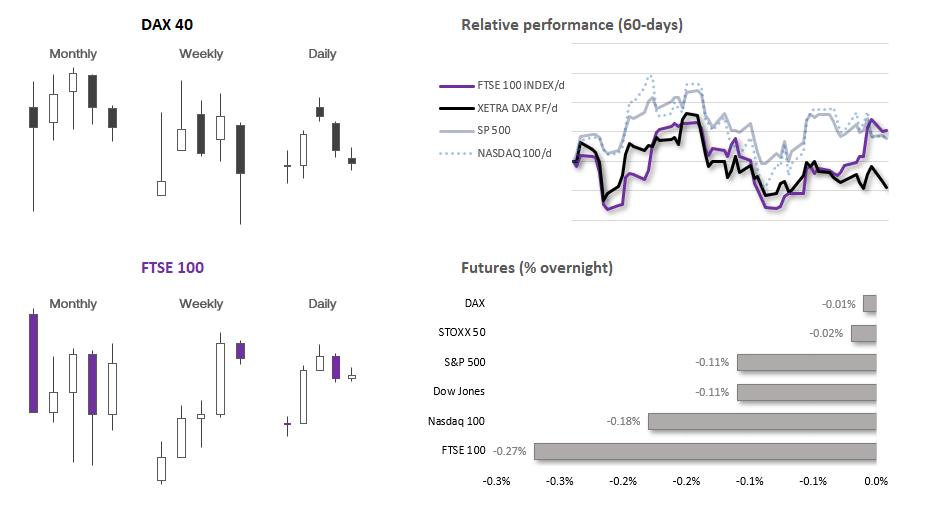
  • UK's FTSE 100 futures are currently down -21 points (-0.27%), the cash market is currently estimated to open at 7,639.20
  • Euro STOXX 50 futures are currently down -1 points (-0.02%), the cash market is currently estimated to open at 4,241.70
  • Germany's DAX futures are currently down -1 points (-0.01%), the cash market is currently estimated to open at 15,663.48


US Futures:

  • DJI futures are currently down -37 points (-0.11%)
  • S&P 500 futures are currently down -4.75 points (-0.11%)
  • Nasdaq 100 futures are currently down -27.5 points (-0.18%)


Events in focus (GMT+1):

  • 16:00 – UK inflation
  • 04:00 – FOMC meeting
  • 04:30 – FOMC press conference


20230920indices


The People’s Bank of China (PBOC) kept their benchmark lending rates unchanged. Whilst this is in line with expectations, it could be taken as a sign that Beijing see early signs of the economy stabilising.

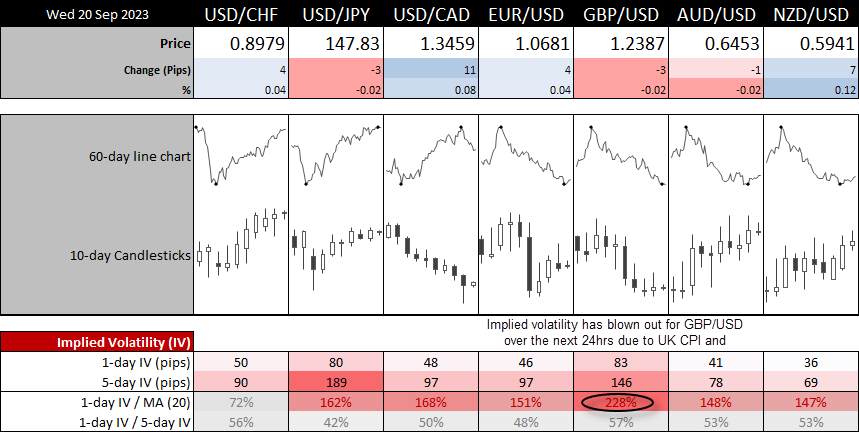
Implied volatility levels for the next 24 hours are elevated ahead of today’s FOMC meeting. In particular, GBP/USD IV is more than twice its 20-day average due to the UK inflation report up shortly. At 228% of its 20-day MA, it suggests a ~146 pip move on GBP/USD, while EUR/USD IV suggests a ~190 pip move.

UK inflation data is the first main event at 07:00 BST (16:00 Sydney), where another hot set of CPI figures could seal another hike from the Bank of England tomorrow. And given the British pound has underperformed of late, it could give GBP pairs a bit of a bounce before the FOMC meeting. If this were to be coupled with a surprisingly dovish FOMC meeting, we may even see GBP/USD lift itself up materially from its 3-month lows. Although at this stage I suspect bears may be looking to fade into minor rallies on GBP/USD to see if it can head for the 1.23 handle. Clearly, a refreshingly soft set of inflation figures could see GBP/USD break to a fresh 3-month low ahead of the FOMC meeting.


20230920forex


GBP/USD technical analysis (4-hour chart):

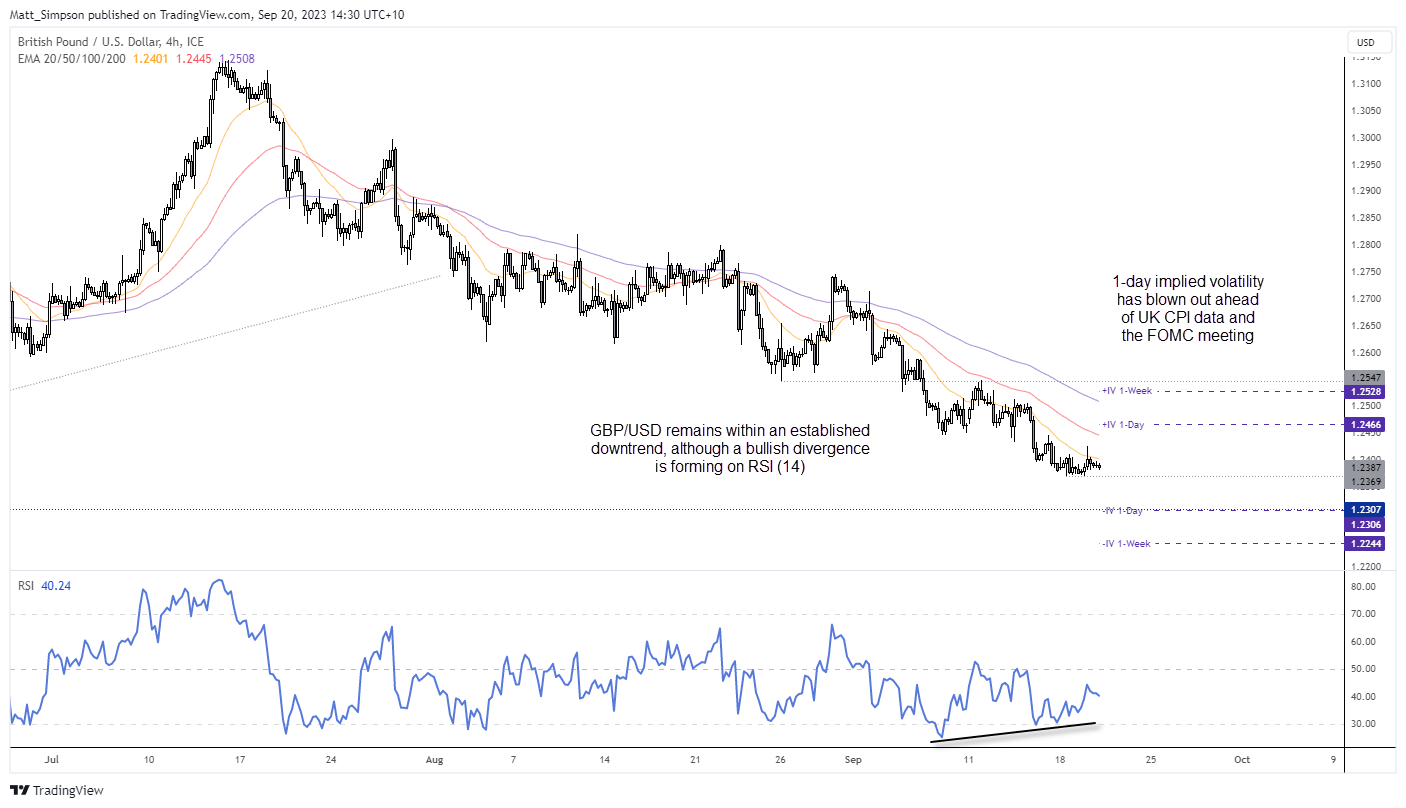
The British pound remains within an established downtrend on the 4-hour chart, although a bullish RSI divergence is forming on the RSI (14). Still, with volatile event spending, GBP/USD has the potential to move aggressively in either direction. The 1-day implied volatility level is relatively large to the weekly range.

Given its close proximity to the cycle lows, bears may want to see if prices can revert higher and form a swing high to suggest momentum is set to return to its downtrend at a higher price (to increase the potential reward to risk ratio. If UK inflation surprise to the downside, perhaps we’ll see a break to a new cycle low and head towards 1.23.

20230920gbpusd


EUR/USD technical analysis (1-hour chart):

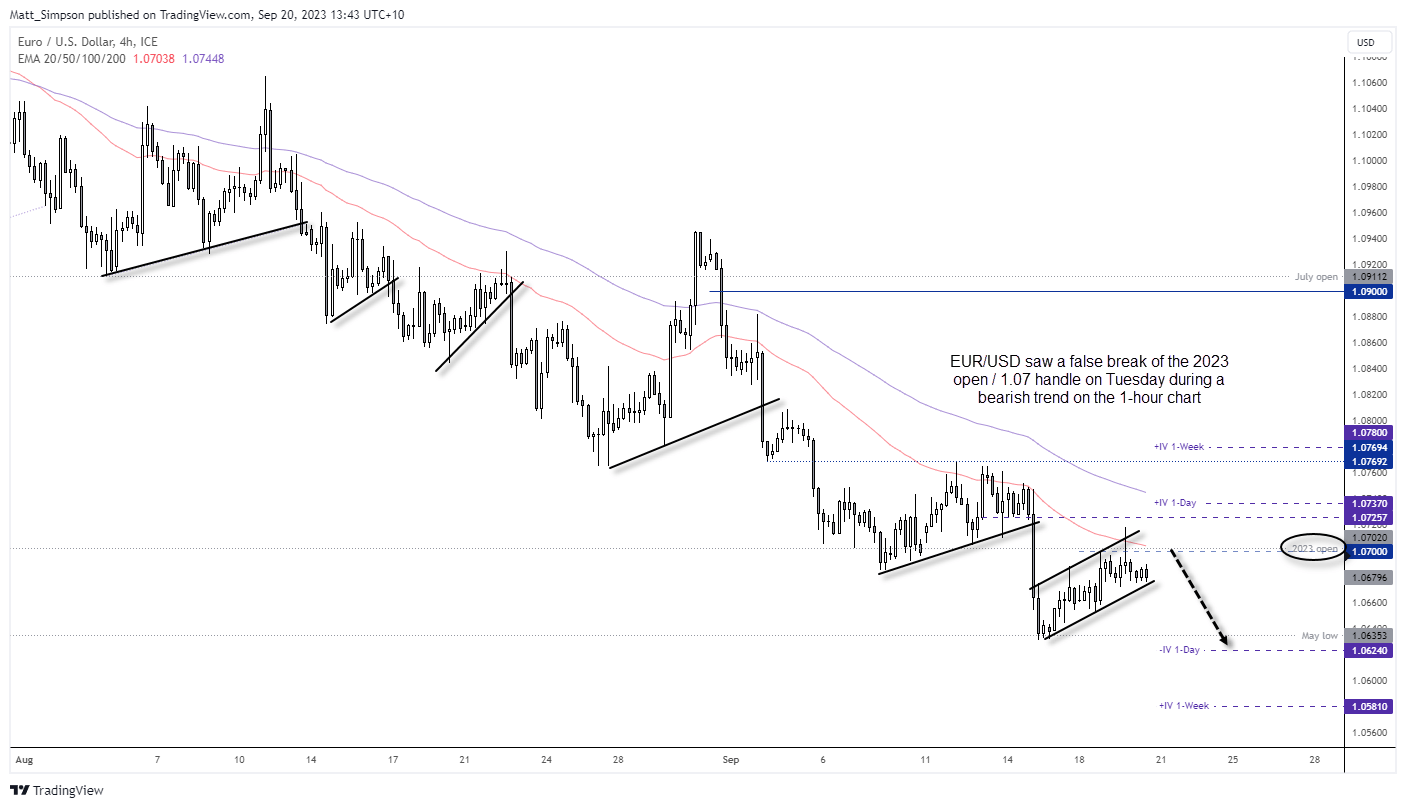
I have outlined my bearish bias in recent articles and I retain that view today. But in a nutshell. I suspect the Fed will be more hawkish than expected, the ECB are done tightening, futures traders are increasing shorts against the euro whilst culling longs and the USD is on the cusp of reaching net-long exposure against G10 currencies.

I noted in Wednesday’s Asian Open report that EUR/USD had rallied straight into the 61.8% Fibonacci level before reversing and closing the day back beneath 1.07. However, what makes the ‘fakeout’ particularly interesting is that this sits around the 2023 open price, which means the EUR/USD has effectively gone nowhere this year and traders are clearly watching this level.

Yesterday’s bearish hammer may have even marked a high, but any moves towards the 1.0700 area ahead of the meeting may interest bearish swing traders. Ultimately, my bias remains bearish beneath 1.0730 and for a move back towards 1.064 May lows initially, and eventually beyond on route towards 1.0500.

20230920eurusdH1


WTI crude oil technical analysis (4-hour chart):

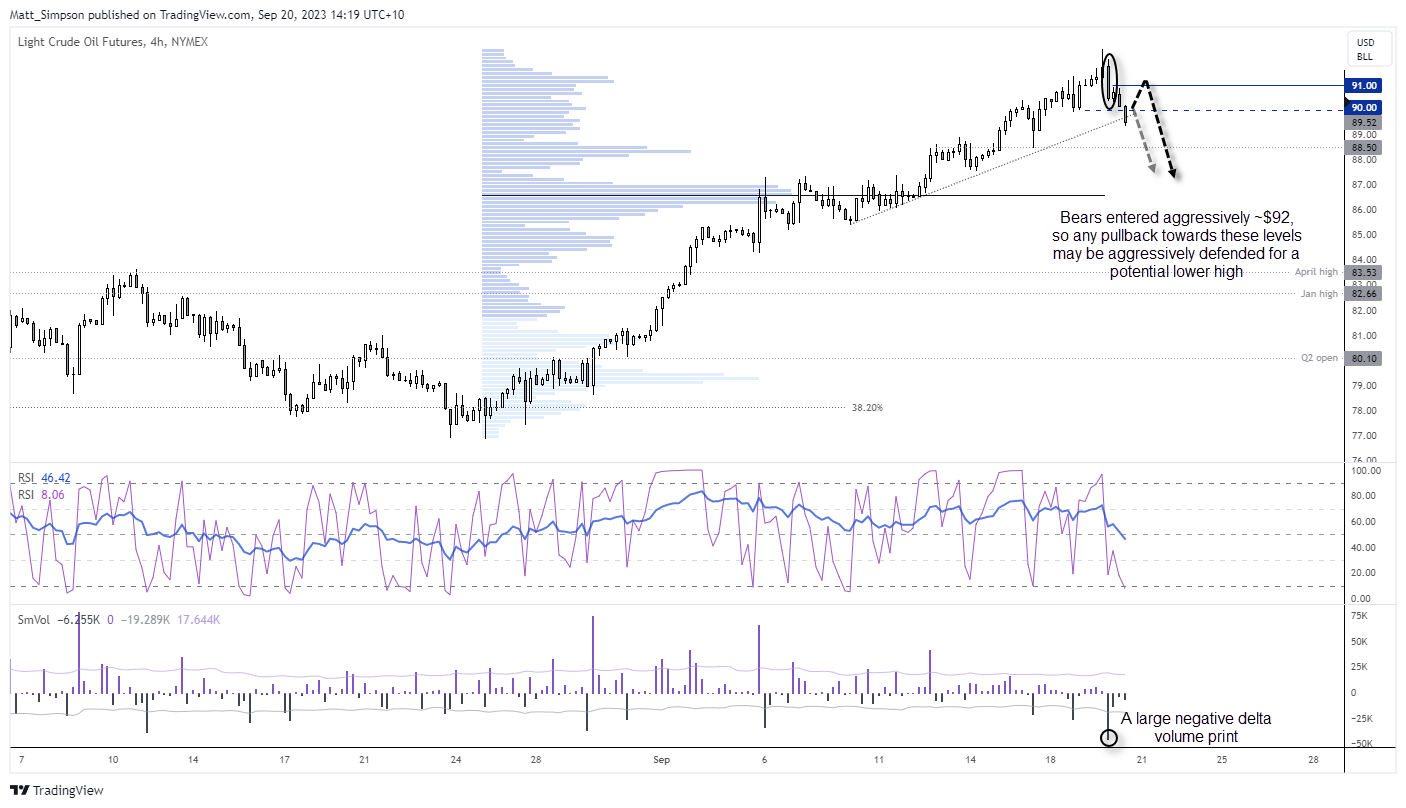
I noted earlier in today’s Asian session that a potential key reversal formed on WTI, which leaves the potential for a pullback against its strong, bullish trend. Of course, a hawkish FOMC meeting could help it move lower sooner, but its 45% rally since the June low suggests we’re probably closer to a retracement than not.

Prices have since broken beneath Tuesday’s low and the $90, and now probing trend support on the 4-hour chart. I’m always a bit suspicious of breakouts in the Asian session, especially when it is ahead of an important event like the FOMC meeting.

I therefore wouldn’t be too surprised to see prices pop back higher above $90 before the real move lower begins. We can see that Volume delta was very negative during the selloff from $92, and those bears are presumably still short. Subsequent volumes have been relatively low, hence the hunch of a pullback in the European session. Ultimately, any move towards the $94 area could be of interest for bearish swing traders to seek its next leg lower (and hopefully a true break of the trendline).


20230920wtiH1
 

AUD/USD, ASX 200 headwinds to persist with ‘higher for longer’ Fed rates: Asian Open 21.09.2023​

t the most basic level the Fed delivered what was expected; another policy pause with the potential for further hikes. The opening paragraph tipped noted an economy which is “expanding at a solid pace” with a slower but “strong” job growth and elevated inflation. There’s nothing remotely dovish there. And then we look at the numbers.


The median Fed fund futures rate has been increased to 5.1% in 2024 (4.6% previously) and 3.9% in 2025 (3.4% prior). Growth has been upgraded for 2023 and 2024, PCE inflation increased for 2023 and 2025, Core PCE lifted in 2025 (but lowered in 2023), unemployment is lower from 2023 through to 2025.


20230921FedProjectionas


If there’s anything to celebrate, the Fed don’t appear to have a hike up their sleeve for this year. But now even a ‘soft landing’ seems unlikely, let a lone a recession. And the Fed are going to allow the economy to run hot.


Ultimately, incoming data remains key and the threat of further hikes continues to be dangled by a committee which is “prepared to adjust the stance of monetary policy as appropriate”. Higher for longer is here to stay. And that is quite apparent with the 2-year yield at a 17-year high and the 10-year at a 15-year high.


The US dollar shamelessly sucked in a few dovish bets ahead of the meeting, yet quickly reversed course post meeting to close slightly higher for the day. And that’s probably a fair finish given the Fed delivered what was expected.


  • US2yr yield: 17-year high
  • US10yr yield: 15-year high
  • US30yr yield: Sits just beneath its 13-year high
  • USDJPY: Fresh 9-month high (BOJ up next...)
  • DXY: Probing its 6-month high
  • GBP/USD: 16-week low, also helped by a weaker inflation report
  • Nasdaq, S&P 500: 3-week lows


20230921movers


Events in focus (AEDT):

  • 08:45 – NZ GDP (Q2)s
  • 11:30 - RBA bulletin, reserve assets total
  • 12:30 – HK interest rate decision
  • 17:30 – SNB interest rate decision
  • 21:00 – BOE interest rate decision: The BOE seem unlikely to raise interest rates today given the weaker than expected inflation report delivered yesterday. Whilst many economists now have it down to a coin flip (and just the day prior, almost a certainty the BOE will hike), I’ll take a punt on a hold based on the fact that there is a political pressure for them to stop hiking. And the BOE have previously showed their desire to stop hiking as soon as possible in Q4 – not that rising inflation helped then do that back then.


Technically Speaking:

  • A bearish pinbar / shooting star formed just beneath 1950 on gold, and a move towards 1920 now seems feasible with its series of lower highs alongside higher yields
  • USD/JPY has broken above 148 to a fresh 9-month high, although its volatility seems supressed – perhaps by the fact that the BOJ meeting is pending
  • WTI crude oil pulled back into the 91 handle before reversing and closing just above 89. With a second day lower, I continue to suspect a move towards $87 is on the cards
  • Nikkei 225 futures were lower overnight and it does not look set to embark upon a breakout above its 33-year high
  • And that means we can expect weak sentiment across APAC stocks, with the big question being whether the ASX 200 can hold above a key trendine


ASX 200 at a glance:

We’re not expecting miracles on the ASX 200 today, but given it fell three days leading into the meeting and SPI futures are just -0.2% lower, it may not be a complete disaster today either. The key question is whether it can cling on to trend support from the March 2020 low, as failure to do so likely brings the 7100 and 7000 handles into focus.

20230921asxglance


20230921xjo


AUD/USD technical analysis (daily chart):

AUD/USD high-fived 65c in what was the ‘last hurrah’ on Wednesday as it essentially marked the high of the day. Momentum quickly turned and the Aussie formed a 1-day bearish reversal pattern beneath 0.6450. Yield differentials make it hard to justify a rally, yet its resilience above 64c means we may have to contend with some sticky trade in muddy conditions between 64-65c.

20230921audusd
 

USD/JPY falters around 148 ahead of CPI and BOJ: Asian Open 22/09/2023​

Market Summary:

  • Global equity markets were broadly lower on Thursday following the Fed's hawkish meeting, as investors came to grips with upwardly revised growth and inflation targets alongside fewer cuts in the median Fed fund projection in 2024
  • US bond yields – particularly at the longer end of the curve – accelerated higher. The 20-year and 30-year rose +18.25 and +18.81bp respectively, which is over three times their average positive daily return over the past year
  • Wall Street indices gapped lower, opened around the highs of the day to closed at their lows.
  • China’s CSI 300 fell to a YTD low, the China A50 closed beneath 12,400 support for the first time since May (which marked a swing low, btw…)
  • The US dollar index (DXY) rose to a 6-month high although traders seemingly booked profits just 15 points from its YTD high, to see the day close with a bearish pinbar
  • AUD/USD fell to a 6-day low yet once again 64c came to the rescue for prices to recover slightly and close the day just above it, EUR/USD recovered back above its May low and USD/JPY formed a bearish outside day ahead of today’s BOJ meeting and inflation report
  • The Bank of England held interest rates at 5.25% on Thursday, following softer than expected inflation data earlier in the week. The Monetary Policy Committee (MPC) voted 5-4 in favour of the hold, but most notably it was Governor Bailey, Ramsden, Pill and Broadbent which voted for the pause which could back up the case that the terminal rate is indeed in place. GBP/USD fell to a 6-month low.
  • WTI crude oil fell for a third day although is only closed marginally lower after volatility cut both ways. Support was found above $88 before prices recovered to $91 and pulled back, to close the day with a spinning top doji (is a low in already?)


20230922movers


Events in focus (AEDT):

  • 08:45 - New Zealand’s trade data
  • 09:00 - Australian flash manufacturing, services PMI
  • 09:30 – Japan’s national CPI
  • 10:00 – Japan’s flash manufacturing, services PMI
  • 16:00 – UK retail sales
  • 17:30 – Germany’s flash manufacturing, services PMI
  • 18:00 – Eurozone’s flash manufacturing, services PMI
  • 18:30 – UK flash manufacturing, services PMI
  • 22:30 – Canada’s retail sales
  • 23:45 – US flash manufacturing, services PMI

ASX 200 at a glance:

  • The ASX 200 endured its worst day in five weeks on Thursday, falling -1.36% by the close and comfortably below 7100
  • A weak lead from Wall Street and SPI futures falling -1.36% points to another weak open for the ASX cash index today
  • 7,000 is the next major support level for bulls to defend, 7090 (August 22 swing low) is resistance

20230922asxglance


20230922spi


USD/JPY technical analysis ( chart):

The US dollar failed to hold into its initial post-FOMC gains, which saw major pairs reverse course and hold their ground despite higher yields. And that also saw USD/JPY print a bearish outside day after a false break above 148. Whilst that flies in the face of my bias for a move to at least 149 (potentially 150), I had also outlined a scenario where pullbacks towards the 20-day EMA had actually been supported in recent weeks. It therefor appears the latter scenario may be playing out.

The 1-hour chart shows the 10-day EMA and 147.46 low was breached but not conquered, hence the bias for an initial bounce from current levels. Yet the 2-day bearish reversal pattern hints at another leg lower, so perhaps we’ll see a swing high around the daily pivot point. Either way, the 20-day EMA sits around the 147 handle, which may make a potential bearish target for countertrend bears or an opportunity for sidelined bulls to seek evidence of a swing low.

20230922usdjpyH1
 
Back
Top