Daily Market Report

Bonds could trump data next week if yields keep surging: The Week Ahead​

The most notable reaction following the latest FOMC meeting was the reaction of bond markets, which continued to plunge and send yields higher. Not even the US dollar could extend its rally meaningfully despite the rise of yields. But global stock markets certainly took notice and fell in tandem as investors finally took the Fed seriously that interest rates are likely to remain higher for longer. So whilst we have US PCE inflation, consumer sentiment, GDP, retail sales and the likes of China PMIs and Australian CPI, it is likely to be how bond yields behave next week as to how important these economic data points become.


The week that was:

  • The Fed held interest rates as widely expected, although upgraded their forecasts for growth, inflation and trimmed 50bp of cuts of the 2024 median Fed rate forecast
  • This not only hammers home the ‘higher for longer’ theme for interest rates in the US, but also brings with it the potential for further hikes – even if money markets are not really pricing them in
  • Notably softer US jobless claims figures after the Fed also served as a reminder that the US economy really is withstanding higher interest rates. For now at least.
  • Bond yields surged on bets that rates will remain higher for longer, with the 20 and 30-year rising over 17bp each
  • Global equity markets were lower after the Fed meeting, and higher yields weighed notably on technology stocks and sent the Nasdaq 100 to a 5-week low and on track for its worst week in six months
  • The Bank of England (BOE) also held their interest rate thanks to a softer-than-expected set of inflation numbers the day prior (and with four key members including governor Bailey opting for a hold, it suggests the peak is at 5.25%)
  • The BOJ kept their policy unchanged widely expected

The week ahead (calendar):

  • Bondcano: Will higher yields crush sentiment?
  • US PCE inflation
  • US consumer confidence
  • China PMIs


20230922calendarFX


Bondcano: Will higher yields crush sentiment?

When I looked at next week’s calendar, a lot of the usual high-tier data seemed to have lost its shine following this week’s FOMC meeting. For example, PCE inflation will likely have to post an extremely wide deviation from estimates to sway markets expectations that the Fed aren’t simply in hold mode, will hold for a while and are more likely to hike than cut.

And then my colleague hit the nail on the head as to why economic data may have lost its shine, when he succinctly said “bondcano, baby - that’s all that matters”. In a nutshell, the higher yields move and the longer they stay there, the more likely it is that risk assets are going to be in for a rude awakening. And if yields somehow pull back as investors decide to buy bonds? Then it should boost sentiment. But that seems unlikely right now given the rate at which bond yields are falling. Market to watch: Bonds/yields, USD/JPY, AUD/JPY, GBP/JPY, EUR/JPY, Nasdaq 100, S&P 500, Dow Jones, Nikkei 225, China A50, Hang Seng, VIX

US PCE inflation

Energy prices and the basing effect have saw the annual rate of US inflation curl higher for a second month, although it is the core measure of inflation that really matter going forward. The Fed’s preferred measure of inflation is the personal consumption expenditure series (PCE) which is released next week. Core PCE is less volatile than core CPI and has been stickier than its CPI counterpart. And with the Fed having hammered home that high rates are here to stay, it would require an abnormally large miss to the downside for markets to ignore this week’s memo. That means PCE data is unlikely to be a market mover, unless is surprises to the upside to generate fresh bets of another Fed hike.

Market to watch: EURUSD, USD/JPY, WTI Crude Oil, Gold, S&P 500, Nasdaq 100, Dow Jones

20230922pce


US consumer confidence

Two measures of consumer confidence are released for the US next week; the Conference Board Consumer Confidence survey and the University of Michigan Survey of Consumers. The two have clearly diverged in since March 2020, with the latter being the more pessimistic and volatile. Yet is also has a smaller sample size of 500 compare with the CB’s 5000, and focuses more on the individual’s state of affairs whereas CB is more about their perception of the economy as a whole. Yet they have both turned lower recently, and that is a trend that needs to continue to lessen the likelihood of higher for longer rates. But again, if the bond market continues to plunge and send yields sky rocketing, that could surely have a negative effect on sentiment and the wider economy as a whole.

Market to watch: EURUSD, USD/JPY, WTI Crude Oil, Gold, S&P 500, Nasdaq 100, Dow Jones

20230922usconsumersentiment


As for the rest…

US retail sales, GDP, jobless claims: As suggested earlier, bond markets are the main driver in town. And that means second-tier data is even less appealing. With that said, retail sales is a form of consumer sentiment so any notably weak data from the US could at least hint at a cooling economy.

We also have the final US GDP prints on Thursday, although jobless data is released at the same time and that may prove to be the bigger market mover if it prints another strong data set.

Australian inflation, retail sales: The majority of recent economic data points to a peak RBA rate of 4.1%. Whilst the Fed’s meeting was hawkish, it doesn’t really place any extra pressure on the RBA to hike unless they do themselves. Unless of course we see Australian inflation curl higher like we saw in the US and Canada recently. If not, it’s another reason not to be bullish AUD/USD.

China’s PMIs: I write this ahead of a series of flash PMI data from the US and Europe, and that could help shape expectations for China’s PMIs next week. With that said, the slowdown in the manufacturing sector has troughed according to the official government NBS data, although services PMI continues to grow at a weaker pace and is arguably the more important PMI to follow next week. Take note that the privately run survey by Caixin are released at the end of the week. But at this stage, an upside surprise may be required to be considered any sort of surprise at all.

Market to watch: USD/CNH, China A50, Hang Seng
 

S&P 500 suffered its worst week in six months: Asian Open – 25/09/2023​

Market Summary:

  • Flash PMIs were the latest economic reports to point to an economic slowdown for Europe on Friday
  • Lower demand and new orders weighed on France (the second largest economy in Europe) with the manufacturing, services and composite PMIs contracting faster than expected
  • Germany’s composite PMI contracted for a fourth month although not as fast as expected, manufacturing contracted for a 13th month although services contracted at a slower pace of 49.8 (above 50 is expansion)
  • The UK composite PMI contracted at its fastest pace since February 2021, adding to the case for the BOE to have reached their peak intertest rate this cycle, and sending GBP/USD to a fresh 6-month low
  • The US flash composite PMI barely expanded at 50.1, the services PMI softened to 50.5 and manufacturing contracted for a fourth month at 47.9 (although has contracted for 9 of the past 10)
  • Australian PMIs were mixed, with manufacturing contracting at its fastest pace in three months (and falling for a sixth) although services PMI expanded for the first month in three
  • The Bank of Japan (BOJ) kept monetary policy unchanged during another uneventful meeting, even though core CPI remained above the BOJ’s 2% target for a 13th month at 3.1% y/y
  • Global stock market indices were under pressure last week, with Wall Street leading the way lower. The S&P 500 fell nearly 3% during its worst week in six month and fell to a 14-week low, and its weekly range was 189% of its 10-week average true range (ATR)
  • WTI crude oil snapped a 3-week winning streak with a bearish spinning top week
  • The US dollar index rose for a 10th consecutive week, which is only its second such bullish sequence in history (and last seen in 2014). Given it has failed to break above its YTD high, it remains a candidate for some mean reversion which could help AUD/USD remain above the 64c
20230925movers

Events in focus (AEDT):

  • 18:00 – German Ifo business sentiment
  • 23:00 – ECB President Lagarde speaks
  • 11:30 – Australian business sentiment (NAB)

ASX 200 at a glance:

  • The ASX 200 fell as much as -1.6% on Friday, although market sentiment reversed just after the open to recoup all losses and close the day with an elongated bullish pinbar
  • Prices also rebounded back above the 7,000 handle to show demand around that key level, although it may simply be a case of bears booking profits ahead of the weekend as opposed to it being a bullish signal
  • With sentiment damaged, we’d prefer to see pullbacks towards the 7,000 handle before reconsidering longs and to focus on intraday opportunities
  • 7092, 7100, 7133 and 7200 make likely resistance levels (and area of potential interest for bears to consider fading into)
20230925asxglance


S&P 500 technical analysis (daily chart):

It certainly wasn’t the best week for bullish stock market investors last week, with global indices falling in tandem. However, the daily range for the S&P 500 on Friday was the lowest in three days, and the market held above the 4300 handle and 38.2% Fibonacci retracement level. It appears that it wants to at least test the bullish trendline projected from the September low, but that doesn’t mean it will get there in a straight line. The RSI (2) also touched oversold to warn of a potential inflection point over the near-term, and we wouldn’t be too surprised to see prices retrace higher at the start of the week before bearish momentum returns. It is then a case of seeking evidence of a swing high on the daily timeframe lower for bearish setups, in hope of an improved risk to reward ratio.

20230925sp500
 

WTI crude oil, ASX 200 analysis: Asian Open – 26/09/2023​

Market Summary:

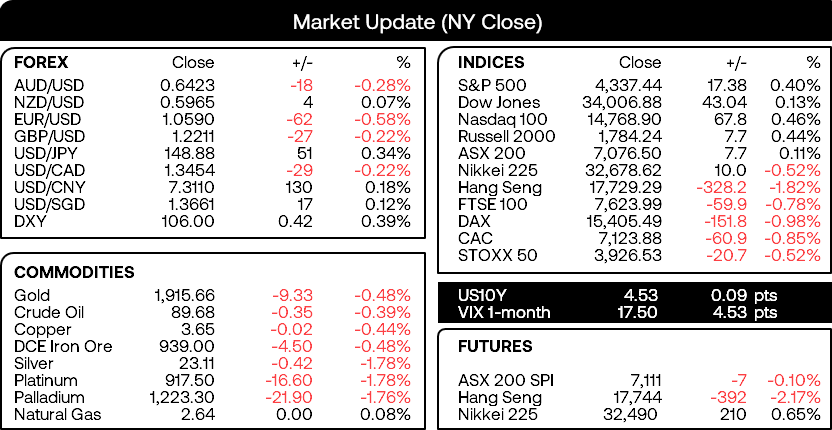
  • The long end of the US yield curve continued to surge on Monday, sending the 30-year yield to a 12-tear high of 4.64%
  • Germany’s business sentiment soured for a fifth consecutive month according to the Ifo survey, sending EUR/USD and DAX to fresh 6-month lows, and helping the US dollar index close to its highest level since November
  • USD/JPY reached an 11-month high and within pips of the 149 handle, although BOJ Governor Ueda remined speculators that it is important for FX to move stably to reflect fundamentals
  • The Bank of Canada’s (BOC) monetary policy minutes revealed members debated a pause of a hike, alongside concerns that markets may misinterpret their recent hold that hikes were done and cuts would be their next move. This essentially tells us that the BOC will retain a hawkish bias over the coming meetings, and keep the door open to further hikes to dampen any dovish expectations. The Canadian dollar was one of the few currencies with withstand USD strength, and saw USD/CAD close beneath the 200-day EMA.
  • In a statement that could give Captain Obvious a run for their money, Moody’s warned that a US government shutdown would be bad for their credit rating
  • Gold was slightly lower on Monday and price action remains choppy on the daily chart, and trapped between the 200-day MA (yesterday’s resistance) and above the 200-day EMA ~1913.
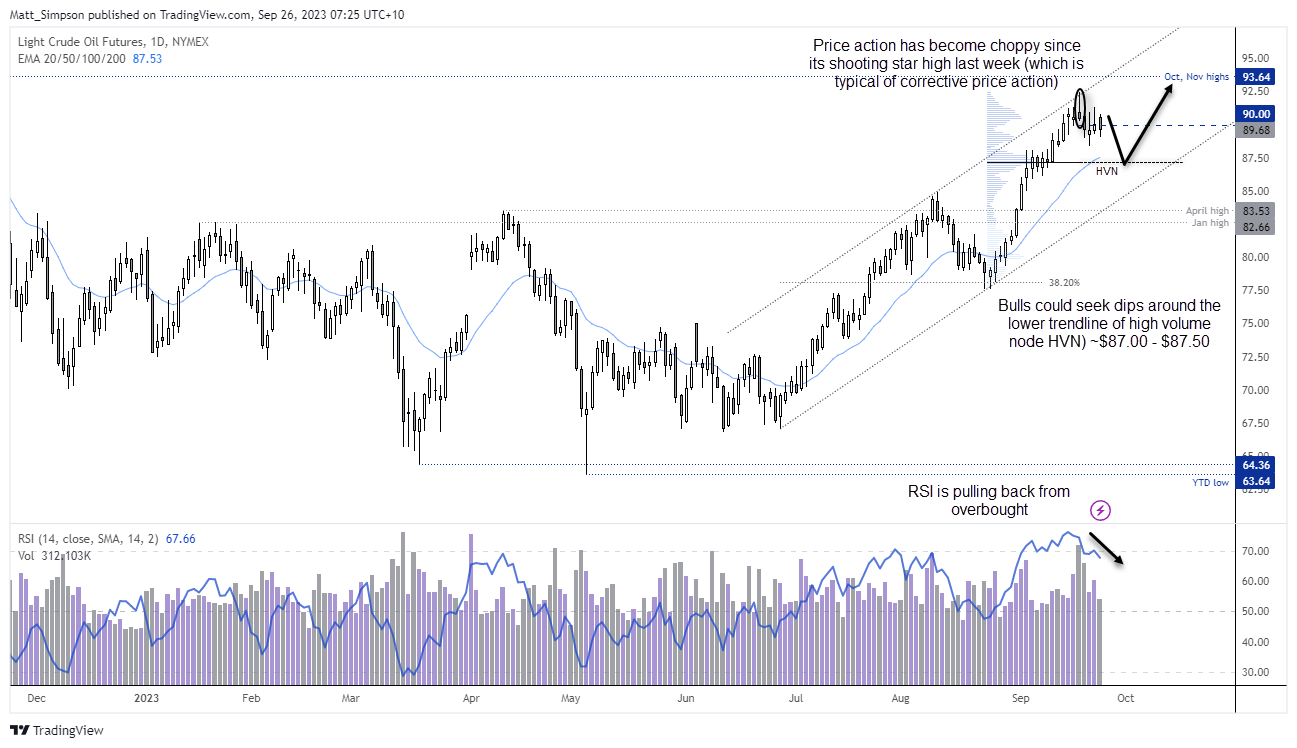
  • The same could be said for WTI crude oil, which is meaning around $90 after pulling back from its shooting start candle it formed around $92.50 last week. This is typical of corrective price behaviour and points to tricky trading conditions ahead.
20230926movers


Events in focus (AEDT):

  • 09:50 – Japan’s corporate services price index
  • 15:00 – BOJ CPI
  • 15:00 – Singapore industrial production
  • 22:00 – US building permits
  • 23:00 – US house price index
  • 00:00 – US consumer confidence (Conference Board)

ASX 200 at a glance:

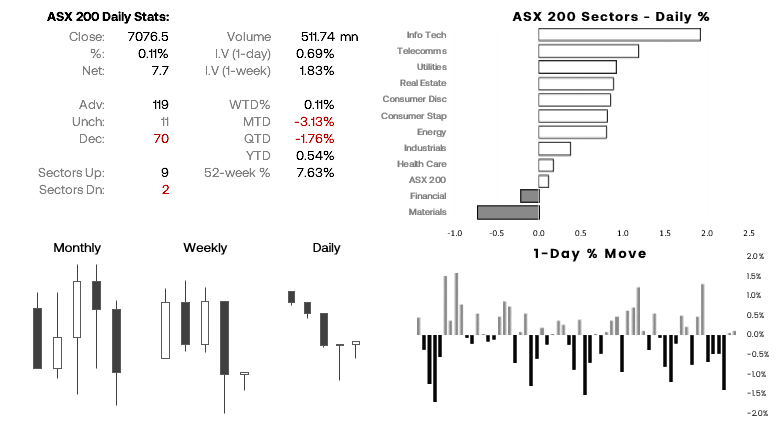
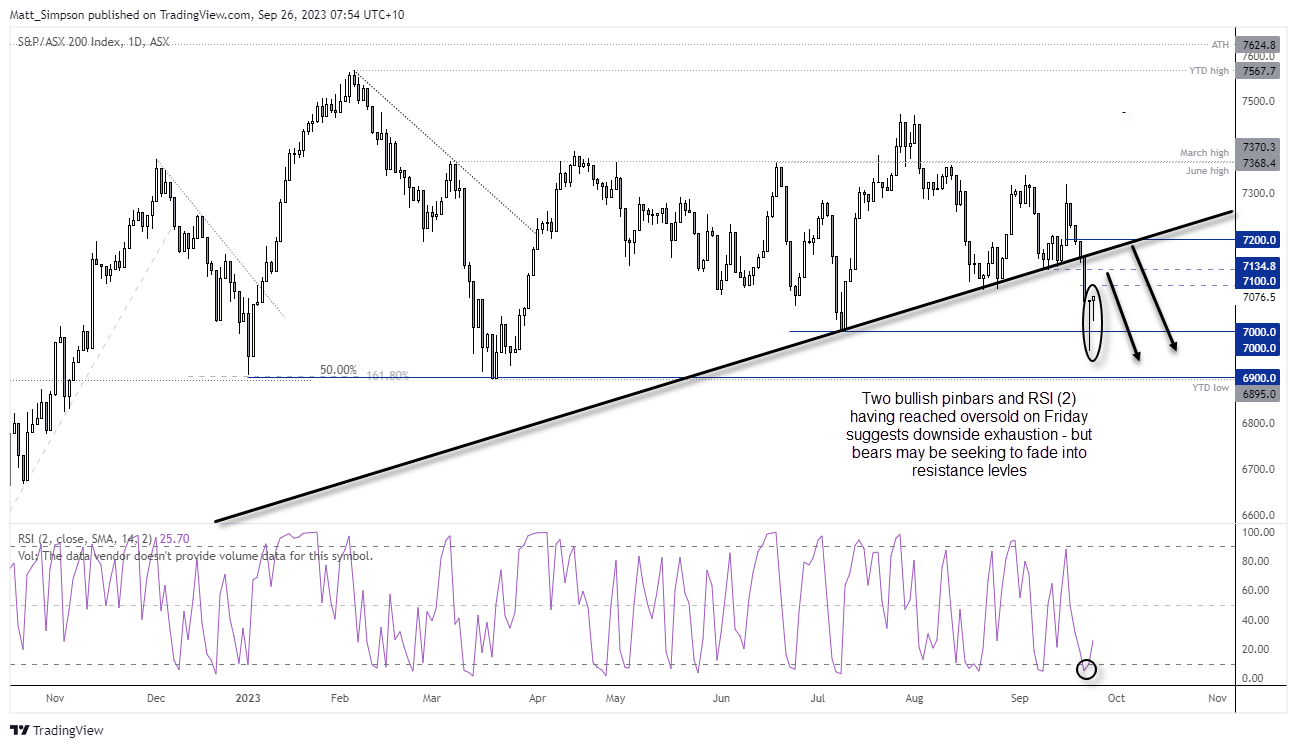
  • The ASX 200 cash index formed a second daily consecutive (although much smaller) bullish pinbar on Monday, to show demand above 7,000
  • SPI 200 futures are a touch lower and the ‘positive’ lead from Wall Street was on the weak side
  • Whilst we see the potential for the ASX 200 to drift higher as part of a retracement against last week’s losses, bears may want to seek area of resistance to fade into
  • 7100, 7135 and 7200 are key levels we’re keeping an eye on for evidence of a swing high
20230926asxglance


20230926asx200


WTI crude oil technical analysis (daily chart):

Price action remains choppy on WTI crude oil’s daily chart after printing a shooting star candle last week formed ~$92.50. This is typical behaviour of a correction and may take a new catalyst to either send it back to trend move of prompt a deeper pullback with cleaner price action. This is also allowing the RSI (14) to pul back from overbought levels. However, we can at least see that the characteristics if of price action has changed compared to the strong, clean rally into $92.50 and adjust accordingly; traders can either seek intraday opportunities within the typical daily range, or wait for evidence of a swing low.

If prices continue lower, an area to seek a potential swing low could be around $87 which marks a high-volume node formed during its rally into $92.50. That could either interest bears as a potential target, or for patient bulls looking to re-enter the market at a discount. The lower trendline is another area of interest for potential support.

20230926wti
 

EUR/USD, FTSE 100 analysis: European open – 26/09/2023​


Asian Indices:

  • Australia's ASX 200 index fell by -33.9 points (-0.48%) and currently trades at 7,042.60
  • Japan's Nikkei 225 index has fallen by -398.98 points (-0.91%) and currently trades at 32,678.62
  • Hong Kong's Hang Seng index has fallen by -149.26 points (-0.84%) and currently trades at 17,580.03
  • China's A50 Index has fallen by -88.8 points (-0.71%) and currently trades at 12,485.38


UK and Europe indices:

  • UK's FTSE 100 futures are currently up 2 points (0.03%), the cash market is currently estimated to open at 7,625.99
  • Euro STOXX 50 futures are currently down -8 points (-0.19%), the cash market is currently estimated to open at 4,159.37
  • Germany's DAX futures are currently down -12 points (-0.08%), the cash market is currently estimated to open at 15,393.49


US Futures:

  • DJI futures are currently down -94 points (-0.27%)
  • S&P 500 futures are currently down -14 points (-0.32%)
  • Nasdaq 100 futures are currently down -58.25 points (-0.39%)


Events in focus (GMT+1):

  • 13:00 – US building permits
  • 14:00 – US house price index
  • 15:00 – US consumer confidence (Conference Board)


20230926indices


The Conference board release their consumer sentiment survey at 3pm London, and whilst the August report the expectations index as a “hairline above 80” – a level they use to assume a prediction - the board still suspects that a recession is pending. So it will be interest to see if the consumer reads deteriorate further today to reinforce their view.

Bond market implied volatility is rising according to my colleague David Scutt, with the MOVE index seeing its fastest daily rise in three months on Monday. As noted in the Week Ahead, bond markets and their rise in yields is more likely to direct sentiment this week over economic data. And that means if Wall Street manages to lift itself further from last week’s lows, I suspect it could be a last hurrah ahead of its next leg lower.

Volatile was very low for currency pairs overnight with a lack of market-driving news released across APAC. 1-day implied volatility is also on the low side for most forex majors, although EUR/USD has the highest 1-day IV relative to its 20-day MA of 146%.

Asian equity markets were modestly lower, but we’re keeping an eye on the China A50 to see if it can rebound from the magical 12,400 level once more – a level that keeps coming to the rescue for the struggling index.


20230926forex


EUR/USD technical analysis (daily chart):

EUR/USD prices finally caved on Monday and broken beneath 1.06 in line with my bias last week. IN all the tie yields rip higher and European data comes in soft, the potential for a lower EUR/USD remains. Especially since large speculators remain net-long EUR/USD futures (although at a 436-week low).

But this is not a new trend, and the risks of a countertrend bounce are growing. But as of yet, there’s no immediate signs of a bottom forming, which means we’d prefer to fade into minor rallies or breaks of support, for a potential move towards the target around 1.050,


20230926eurusd


EUR/USD technical analysis (1-hour chart):

EUR/USD traded in a very narrow range just above Monday’s lows during today’s the Asian session. The fact it failed to retest the low (let along break it) leaves the potential for a bounce higher. But given the volatile and often unfriendly nature of the London Open, we’re equally open to Monday’s low being tested before prices rebound that we are to prices simply bouncing higher after the open.

What has also caught my eye is how prices are holding just below the monthly S2 and weekly S1 pivot levels, which makes me suspect it wans to revert above them – at least temporarily. The upper 1-day implied volatility level sits just beneath the May low, which makes it a potential target for countertrend bulls (or an area of bears to consider fading into). Ultimately, we’re looking for evidence of a swing high to capture an initial move towards the 1.050 target, with 1.0540 also making an interim support level.


20230926eurusdH1


FTSE 100 technical analysis (daily chart):

The FTSE may have benefited from a weaker British pound and prospects that the Bank of England (BOE) have finished hiking interest rates, but it is now getting caught in the crosswinds of rising bond yields. Its 7.4% rally from the August low to September high failed to produced a daily close above the July high. And when you see several failed attempts to close above a structural level before momentum moves the other way, it can indicate an inflection point.

In this case, the FTSE saw four failed attempts to close above 7725 before momentum turned lower and closed just beneath the 200-day MA on Monday. Prices have edged lower during the Asian session, and area of interest for bears to consider fading into include the 200-day MA at 7646 or Monday’s high at 7685.

An initial target could be the 7531.6 open price, with a break beneath 7500 bringing the 7368.3 low into focus.

20230926ftse
 

USD/CHF aims for 12th bullish day, DAX on the ropes: European open 27/09/2023​

Asian Indices:

  • Australia's ASX 200 index fell by -21.7 points (-0.31%) and currently trades at 7,016.50
  • Japan's Nikkei 225 index has fallen by -83.32 points (-0.26%) and currently trades at 33,231.73
  • Hong Kong's Hang Seng index has risen by 111.03 points (0.64%) and currently trades at 17,577.93
  • China's A50 Index has risen by 8.6 points (0.07%) and currently trades at 12,486.14

UK and Europe:

  • UK's FTSE 100 futures are currently down -11.5 points (-0.15%), the cash market is currently estimated to open at 7,614.22
  • Euro STOXX 50 futures are currently down -1 points (-0.02%), the cash market is currently estimated to open at 4,128.18
  • Germany's DAX futures are currently down -16 points (-0.1%), the cash market is currently estimated to open at 15,239.87

US Futures:

  • DJI futures are currently up 69 points (0.2%)
  • S&P 500 futures are currently up 11.25 points (0.26%)
  • Nasdaq 100 futures are currently up 32.5 points (0.22%)

Events in focus (GMT+1):

  • 07:00 – Germany GfK consumer climate
  • 09:00 – Swiss ZEW expectations
  • 09:00 – EU loans
  • 12:00 – US mortgage data
  • 13:30 – US core durable orders
  • 14:00 – SNB quarterly bulletin
  • 15:30 – Crude oil inventories


20230927indices


DAX technical analysis (daily chart)

The DAX has joined Wall Street at 6-month lows on Tuesday, having seen a decisive close beneath its 200-day EMA the day prior. Its low may have found support at a 61.8% Fibonacci retracement level, but unless sentiment can turn around fast it appears more likely the DAX could be headed for 15,000 before it retests its 200-day EMA. Besides, RSI (14) is not yet oversold on the daily chart, let alone form a bullish reversal to warn of a retracement higher. And unless we see prices print a particularly large bullish candle, any bounces higher are likely tempting to bears to fade into around resistance levels.


20230927dax


The US dollar index continued to rise during Wednesday’s Asian session to reach a fresh 10-month high. The US dollar has seen little in the way of pullbacks, which has seen GBP/USD and EUR/USD inch their way to fresh 6-month lows. But let’s not forget about the Swiss franc, which is trying to tally up its 12th consecutive day – a bullish sequence not seen since the 1970s.

USD/CHF is the ideal divergent theme with the ‘higher for longer’ and rising bond yields driving the US dollar, alongside an increasingly bearish view on the Swiss franc. The Swiss National Bank’ (SNBs) recent decision to announce the end of their tightening cycle clearly came as a surprise to many, given it has a relatively low interest rate of 1.75%. And that has seen its 20-day correlation with the US dollar index rise to 0.95, just a fraction between EUR/USD’s negative correlation of -0.99.

The SNB are not set to announce another monetary policy decision until 14 December, which leaves plenty of time for markets to sway their opinion. But the SNB will release their quarterly bulletin at 14:00 GMT+1 which will include an update to their global and domestic economic forecasts. Ad if CPI expectations come in lower, it could prompt more bears to return form the sideline and short the Swiss franc.


20230927cotCHF


As of last week’s COT report, asset managers and large speculators saw a notable rise in gross-short exposure. Although net-short exposure does not appear to be near a historical extreme for either group.


Keep in mind that the US releases final GDP data on Thursday and PCE inflation on Friday, and that runs the risk of a retracement in the US dollar if data comes in soft enough. Especially when it’s considered that the US dollar has already rallied for 10 weeks and USD/CHF shares a strong correlation with it. But for now, dollar bulls seem happy to remain bid ahead of the key data sets.

USD/CHF technical analysis (daily chart):

The daily chart shows a very strong uptrend which has shown little in the way of any pullback. It is also amid its 12th day high, which suggests it could be fast approaching the need for a pullback. However, with no immediate signs of a top, and the apparent need to tap 0.92, bears may want to step aside until we see clear evidence of a momentum shift around its cycle highs. Perhaps this may occur around the US data scheduled on Thursday or Friday and trigger some sort of a shakeout.

Beyond that, a pull back to 0.9100 could be tempting to bulls. But trying to chase such an extended move at the cycle highs seems like a risky bet for bulls at present.

20230927usdchf
 

AUD/USD support caves as USD continues melt up continues: Asian Open 28/09/23​

Market Summary:

  • Rising bond yields and oil prices were the main attraction on Wednesday, which further suppressed sentiment for Wall Street as these rallies play nicely into the hand of ‘higher for longer’ interest rates
  • Concerns over a US government shutdown continued to mount after Republicans blocked a stopgap funding bill from advancing to the Senate, further adding to negative sentiment for risk
  • The US dollar retained its spot at the top as the strongest FX major currency, which saw the dollar index rise to a 10-month high, EUR/USD an 8-month low ad reach my 1.05 target and USD/CHF rise for a 12th day to a 3-month high
  • The Swiss franc was helped lower by the SNB’s quarterly bulletin, which reaffirmed the end of their tightening cycle by stating that the “significant tightening of monetary policy over recent quarters is countering remaining inflationary pressure” (even though their rates are just 1.75%.
  • The surging dollar and risk-off tone also saw key support for AUD/USD finally give way with the Aussie closing to its lowest level since November. This suggests the record level of net-short bears among large speculators and asset managers are currently on the correct side of the market, and for now we can forget any chance of a short-covering rally
  • A sharp decline in US crude stocks saw WTI crude oil and brent reach fresh YTD highs on Wednesday
  • Spot gold closed beneath 1900 for the first time in six month, during its worst day since early June. At current prices, gold is on track for its worst week in eight months and worst month in six.
  • Wall Street indices extended their three-month low, although the S&P 500, Nasdaq 100 and Dow Jones all formed small bullish hammers to suggest early signs of stability
  • Australia’s weighed mean CPI rose 5.2% y/y as expected, although the headline CPI of 0.8% m/m raised concerns and remains a metric to watch, given the acceleration of oil prices. Whilst I do not personally think it will prompt the RBA to raise rates soon, some noises of that scenario were made following yesterday’s CPI report.

Events in focus (AEDT):

  • 10:00 – New Zealand business confidence (ANZ)
  • 11:30 – Australian retail sales
  • 17:00 – Spanish CPI
  • 17:00 – ECB Enria speaks
  • 17:45 – ECB McCaul speaks
  • 18:00 – German state CPIs
  • 19:00 – European Economic Sentiment Index (ESI)
  • 22:00 – German CPI
  • 22:30 – US jobless claims, Q2 GDP (final), PCE prices
  • 22:30 – Canada average weekly earnings


ASX 200 at a glance:

The ASX 200 continues to hold above 7,000 (looking beyond a dew points lower here and there on Wednesday). But when you consider all of the negative sentiment that has been thrown at it, it really is doing well to hold above that key level.

At this stage, the best bet the ASX has of rallying from this key support level are positive headlines from Washington that the US government shutdown could be avoided, as this could entice bond traders back from the sideline and suppress yields. And that is looking unlikely over the next 24hrs or even this week, with Republicans blocking a stopgap funding bill.

But with bears failing to break it lower amid a slew of negative headlines, perhaps a surprise bullish catalyst could shake out some bears from these lows to prompt a near-term bounce. But even then, bears may simply look to fade into resistance levels such as 7100, 7130 or 7200. And with AUD breaking lower, is that the canary in the coalmine which leads the ASX toward 6900? Either way, 7,000 is the level to watch.


20230928asxglance


20230928asx200


We finally saw a decisive break lower on AUD/USD as it closed beneath 64c and the September low. The RSI (14) also broke its own retracement line and momentum is headed lower with prices, in line with its dominant trend. The question now is whether this triggers a bearish follow-through today in Asia or whether it seems sticks around yesterday’s lows, waiting to be told what to by US markets. 63c is an obvious target for bears over the near-term, and the September low or 64c level make area of bears to consider fading into should prices to revert higher.

20230928audusd
 
Last edited:

AUD/USD rebounds as USD reversal gives sentiment a breather: Asian Open 29/09/2023​

Bond markets loosened their grip on sentiment on Thursday, with the US yield curve lower and dragging the USD lower with it. USD/CHF snapped its 12-day winning streak and pulled back from the 0.92 handle, AUD/USD recouped all of Wednesday's losses and closed above 64c and EUR/USD closed back above 1.06 (just). Wall Street bounced from cycle lows in an apparent short squeeze. The question now is whether it was a 1-day reprieve, or there is more juice in the risk-off tank. Today’s US PCE inflation data could answer that question.


20230929usd


Market Summary:

  • The US dollar index posted a bearish engulfing candle and pulled back towards the March high, a likely pivotal area over the near-term
  • AUD/USD to fully recoup Thursday’s losses and closed back above 0.64. There was a lot of excitement above its break to a fresh YTD low on Wednesday, but its move above 64c once again shows its resilience and reminds us why it is called ‘the batter’. More importantly, what will the record level of near-short exposure make of this development?
  • USD/CHF snap a 12-day winning streak around 0.9200
  • USD/JPY hasn’t quite managed to test 150 – the level which triggered the MOF to instruct the BOJ to intervene in October. I suspect a move above it will more likely trigger some harsh words from officials over actual intervention, but the hesitancy for USD/JPY to blast through it this time around suggests traders remain wary. Besides, the speed of the rise to 150 is slower than it was last October, and it is speed which concerns the BOJ over its precise level
  • Wall Street also rallied from its cycle lows which saw the S&P 500 bounce further key support (the October trendline and 200-day EMA).
  • We can stop short of calling it a risk-off rally with oil pulling back aggressively from its highs and closing back below 92 (likely from profit taking as markets retraced earlier moves)
  • With key US inflation report scheduled for today, we may find price action is limited up to the event. But it may answer the question as to whether yesterday’s apparent short squeeze was a one day event of if there’s more juice left in the tank.

Events in focus (AEDT):

  • Public holiday in China
  • 09:30 – Tokyo CPI (a good leading indicator for Japan’s nationwide CPI)
  • 09:50 – Japan’s industrial output (preliminary), retail sales, unemployment, jobs/applications ratio
  • 11:30 – Australian private/housing credit, broad money supply
  • 15:00 – Japan’s consumer confidence, construction orders, housing starts
  • 16:0 – German import prices, retail sales
  • 16:00 – UK GDP, business investment
  • 19:00 – Eurozone HICP inflation
  • 22:30 – US PCE inflation
  • 00:00 – US University of Michigan Consumer Sentiment (final)
  • 11:30 – (Saturday) China’s manufacturing, services, composite PMI (NBS)


ASX 200 at a glance:

  • The ASX 200 is set for a positive open with SPI 200 futures rising 0.64% overnight and a stronger lead from Wall Street
  • We outlined the near-term bullish case for the ASX 200 in Thursday’s report, due to its resilience above 7,000 in recent sessions and volume analysis
  • 7100, 7130 and 7200 are key resistance levels for bulls to target or bears consider fading into
20230929asxglance


20230929spi


AUD/USD technical analysis (daily chart):

AUD/USD produced a bullish engulfing candle on the daily chart as it once again defied bears with a sustainable break below 64c. With it now back within the 64c-65c range, the contrarian in me suspect its wants to return to the highs of that range. Furthermore, net-short exposure to AUD futures reached a record low last week and if the US delivers a soft inflation report today then it could scale back hawkish Fed bets and potentially catapult risk assets (ad therefore the Aussie).

20230929audusdD1


AUD/USD technical analysis (1-hour chart):

AUD/USD produced a sharp reversal higher following its false break of the September low. Its rally also broke a bearish retracement line, and prices look now they want tap the weekly pivot point. This may not provide an adequate reward to risk ratio for bulls, but dips towards 64c may provide a better opportunity for bulls assuming a run for 65c. Whilst the risk of a hot US inflation report could weigh on AUD/USD, the contrarian in me is placing extra emphasis on the false break of the September low at a time traders are net-short by a record level (so moves higher could trigger a short squeeze and more impressive rally compared to downside potential).

20230929audusdH1
 
Last edited:

Can US PMI surveys and employment reports sway bonds? The Week Ahead

Last week we noted that bond yields could trump economic data this week, and for the most part they did. We can also extend that comment into next week, especially if they continue to retreat and loosen their grip on bearish sentiment and allow risk assets to rebound. With China on holiday all next week the trading volumes may be lower than usual (and the faltering gold market may find it has fewer buyers to support it than usual). With that said, notable economic events in next week’s calendar include the monthly Nonfarm payroll and ISM PMI reports, RBA and RBNZ monetary policy meetings, the quarterly Tankan survey for Japan and Canada’s employment report.

The week that was:

  • US bond yields continued to surge in the first half of the week with the long end of the curve leading the way (otherwise known as a bear steepener, as bond prices at the long end were falling the fastest)
  • A multitude of concerns including higher oil prices, hawkish Fed comments, expectations of higher-for-longer Fed rates and rising risks of a US government shutdown fueled the bond rout and sent the US dollar to YTD highs
  • Kashkari hinted at a 60% chance of a soft landing for the US economy, a backing for another 25bp hike with a risk that they may need to hike further
  • Global bonds followed the US and the rise of Australian yields saw the RBA’s cash rate futures imply a 96% chance of a 25bp hike by June 2024
  • Yet what could have simply been profit-taking triggered a pullback on the US dollar and yields on Thursday, which allowed risk assets such as Wall Street indices and AUD/USD recoup some losses from their cycle lows
  • The Swiss National Bank (SNB) reiterated their commitment to no further tightening in their quarterly bulletin, saying that their “significant tightening of monetary policy over recent quarters” is reigning in inflation
  • The DAX fell to a 6-month low following another weak Ifo business sentiment report

The week ahead (calendar):

20230929weekaheadFX


The week ahead (key events and themes):

  • USD strength, bond rout
  • US employment (Nonfarm payroll, JOLTS job openings, jobless claims)
  • ISM manufacturing, services PMI
  • Canadian employment data
  • Japan Tankan
  • RBA and RBNZ cash rate decisions
  • China PMIs (manufacturing, services, composite – Caixin)
  • China public holiday (all week)

US data: (ISMs, PMIs, NFP, jobless claims, job layoffs and openings)

The key US data point can be split into two main groups; employment and business surveys. S&P global release their final revisions of their PMIs, all of which are pointing lower to show a soft economy. The Composite and services are on the cusp of joining manufacturing in contraction (below 50) which is at odds with the ISM surveys. The ISM services expanded at its fastest pace in six months whilst ISM manufacturing is curling higher and contracting at a slower pace. So which one is correct?

20230929ismPMIs


The US employment situation is also providing slightly missed signals. NFP Job growth is trending lower yet remains at healthy ‘expansive’ levels, and whilst unemployment has curled high it remains historically low at 3.8%. Job openings fell to a 48-month low, yet significantly elevated relative to its long-term average, and whilst layoffs rose over 50k last month it still pales in comparison to the times of covid. Overall, employment is remains tight but slightly softer and we’re going to have to see some surprisingly soft figures to bring the ‘higher for longer’ narrative into question. And if employment remains firm but business surveys pick up, if anything it could further fuel the bond rout and send yields and the US dollar higher.

Market to watch: EURUSD, USD/JPY, WTI Crude Oil, Gold, S&P 500, Nasdaq 100, Dow Jones

20230929usemployment


RBA and RBNZ cash rate decisions

It’s unlikely we’ll see the RBA or RBNZ change their policy next week, although it will be the first meeting for the new RBA governor Michell Bullock. It’s difficult to say whether she’ll make a mark, given there is only the joint statement of the board members to go off of. But perhaps it leaves more wriggle room for it being less of a ‘cut and paste’ job.

With markets having now prices in a 96% chance of a 25bp RBA hike by June thanks to rising bond yields, it will be interesting to see if the RBA somehow tip their hat towards it and give away another “further tightening” clue. But with household spending and retail sales pointing lower, it’s difficult to justify a hike this year.

The RBNZ are likely to change policy given their forecasts have essentially confirmed the peak rate a 5.5%.

Market to watch: AUD/USD, NZD/USD, AUD/NZD, NZD/JPY, AUD/JPY, ASX 200

China PMIs (manufacturing, services, composite – Caixin)

With China’s PMIs being released over the weekend and China on a public holiday all next week, the data really serves for sentiment outside of the region. And is the case with most data out of China this year, it likely requires an upside surprise for it to be considered a surprise at all.

Market to watch: USD/CNH, USD/JPY, S&P 500, Nasdaq 100, Dow Jones, VIX, AUD/JPY

Canadian employment data

The Bank of Canada (BOC) may have another hike up their sleeve given the return of inflation, at already elevated levels. And another hot employment report could tip them over the edge. That it is released alongside US nonfarm payrolls makes USD/CAD a candidate for unhealthy levels of volatility, but traders can also consider crosses such as CAD/JPY for a potentially cleaner move.

Market to watch: USD/CAD, CAD/JPY, NZD/CAD, AUD/CAD
 

Crude oil: WTI correction a healthy development for longevity of the bullish trend 03/10/2023​


* WTI crude down 7% in three sessions

* Fundamentals remain bullish while near-term technical picture is bearish

* Price action around these levels could determine the scale of the current correction

Healthy bull markets need to breathe​

One of the first lessons I was taught was that for bull markets to be sustainable, they needed to breathe occasionally, allowing fresh longs to join in whenever prices deviated a little too far from reality. In that context, the pullback in crude oil recently could be deemed a healthy development, correcting an unsustainable, one-sided trade which left the contract overbought and over-loved.

Bullish fundamental backdrop for crude remains in place​

As is often the case, there have been no shortage of narratives to fit the price action, ranging from demand destruction from higher bond yields, potential supply disruptions in the Middle East being potentially resolved, along with fresh bearish forecasts from one analyst on the street. Perhaps they drove the reversal, but the fact the catalyst can’t be pinpointed suggests the rally simply ran out of bulls willing to buy.

But now we have better levels, will that remain that way given tightness in physical markets? Demand has held up even with higher prices while Saudi Arabia and Russia have already committed to curb oil production and exports until the end of the calendar year, seemingly suggesting the bullish fundamental picture remains much the same.

WTI price action today may determine scale of correction​

Looking at WTI on the daily, prices have now fallen over 7% from the highs hit on Thursday, underlining the speed of the current reversal. With the fundamental picture remaining bullish but the technical picture bearish near-term, the price action around this level may be informative as to where crude is likely to head next.

A sharp dip below $88 in late September attracted solid buying, resulting in a bullish hammer pattern being generated on the charts. Sitting just below that level today, which also acted as resistance earlier on in the crude rally, you get the sense that today holds the key as to just how far this correction will play out.

Trade optionality for WTI around these levels​

On the downside, there isn’t any significant visible support until we get back to channel support found just above $85. Given the proximity to a long-term support/resistance zone between $83.50 to $84.50, that would likely be the limit to downside in the absence of a sharp turn in the fundamental backdrop. On the upside, minor resistance may be found around $91. Beyond that, $92.40 and the YTD high around $94.60 are the levels to watch.

Depending on which way price evolve today, a stop-loss either below or above $87.80 to $88 will offer protection against the trade working against you.

wti oct 3
 

USD/JPY falls on apparent BOJ intervention, ASX hits 6-month low: Asian Open 04/10/2023​

A surge of yen strength shook currency markets when USD/JPY crossed above 150, prompting calls that the BOJ had finally intervened after much warning. Whether they have remains to be confirmed by officials, but the -290 pip fall in five minutes suggests they likely have.

The last time the BOJ intervened back in October, it marked the beginning of a -16% decline on UD/JPY over the next three months. Yet with US bond yields screaming higher along with the US dollar, it seems unlikely we'll see a similar move on USD/JPY over the coming weeks unless bond traders step up to the mark to support prices to suppress yields. But even then, the Fed remains hawkish and the US dollar remains bid. And that makes USD/JPY is a difficult market to bet against as pullbacks are likely to be bought.

20231004usdjpy


Still, prices are a little shell-shocked and that could make for difficult trade today in Asia. Prices have already flat-lined to a narrow range Tuesday’s aggressive selloff, which suggests prices may struggle to find a clean move today as traders absorb the latest developments.

US employment data bolsters Fed hike bets, bond rout deepens​

US JOLTS job openings rose 690k to 9.61 million, bolstering bets that the Fed may have to hike at least one more time. Fed fund futures now imply a 30.1% chance of a 25bp hike in November, up from 16% one week ago. The Fed’s Mester says she is likely to support another hike at the next meeting if the current economic situation holds and does not see cuts happening any time soon. And whilst Bostic sees a single 25bp, it is not until the end of next year.

20231004yields


US bond yields continued to scream higher, particularly at the long end with the 10, 20 and 30-year rising ~2-3x their normal 1-year ‘up-day’ average. The 30-year yield reached a 16-year high and within striking distance of 5% as yield curve attempts to normalise, which is when the long end of the curve is higher than the short end (currently the yield curve is inverted with shorter yields trading higher than longer yields).

  • AUD was the weakest FX major, with AUD/USD down nearly 1% and falling to its lowest level since November and within pips of testing 63c
  • JPY was the strongest FX major, which saw AUD/JPY suffer its worst day in nearly 7 months
  • The S&P 500 broke beneath its October trendline yet held above the 4200 handle, the VIX (volatility index) rose to a 6-month high
  • The MOVE index (bond market implied volatility) rose to a 4-month high
  • The US dollar index reached a fresh YTDF high, although it was a small-range shooting star which suggests a loss of momentum to the trend
  • Gold fell for a seventh consecutive day to a 7-month low and trade just $20 above $1800, the next key level of support for bulls to defend
  • APAC futures point to a weak open for local share markets today, with the Nikkei expected to open at a 4-month low and the ASX down at a 6-month low around a key support level at 6900

Events in focus (AEDT):

  • Public holiday in China
  • 09:00 – Australian AIG construction, manufacturing index, S&P global services PMI
  • 10:00 – South Korean industrial production, retail sales, service sector output
  • 11:30 – RBA chart pack
  • 12:00 – RBNZ interest rate decision, statement
  • 18:55 – German services, composite PMIs
  • 19:00 – ECB president Lagarde speaks
  • 19:30 – UK services, composite PMIs
  • 20:00 – Euro PPI, retail sales
  • 21:00 – OPEC meeting
  • 23:15 – US ADP employment change
  • 00:45 – S&P Global US services, composite PMIs
  • 01:00 – ISM services PMI


ASX 200 at a glance:

  • The ASX 200 fell to a 6-month low on Tuesday and below 7,000 for the first time since March
  • 6900 is a major support level which has supported the ASX 200 for the best part of a year, so how it interacts with that level today could be key for sentiment going forward
  • A weak lead from Wall Street and SPI futures overnight points to a weak open, but should just above hold above 6900 (initially at least)
  • If dip buyers manage to support the market, 7,000 comes into focus, where bears may be waiting on the sideline to re-enter and seek a break below 6,900
  • Rising AU yields are likely to keep pressure on ASX stocks, so they may need to pull back from their cycle highs for the ASX to stand any chance of finding a swing low


20231004asxglance


20231004asx200
 
Back
Top