Friday update and response to Rubin's post
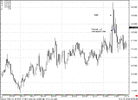
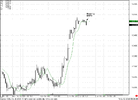
I wonder if this nice long daily bar would qualify as the first side of a railroad track? I know it's not ideal (not long enough) but it *is* quite tall compared to the previous bars, and everybody is guessing in the forex world how the EUR exploded so high today.
Hi Rub,
First of all this is not a RRT at least for 2 reasons. First - there is no such thing as (magic -just kidding) 'First leg of RRT". RRT should be recognised at a point of recognition (POR) only after the second leg will not just appear but closed.
Second - there should not be any price action to the left side of RRT. It should be clear rejection of price. Even if you'll see something like RRT but in current conditions I call it W&R rather than RRT. Because market was at this price just 1 month ago aprox. If market will fall - this falling will have another reasons than RRT.
How high do you think the EUR could realistically go before turning back down?
Thanks!
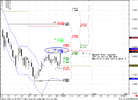
Well, If you remember a couple day Ago we've talk with Sentinel about weekly B&B and I've said that market is exiting from monthly oversold, so I prefer to see deeper retracement up, probably even to weekly overbought. It happens very often. I want you to tell two major things
1. Current up rally will be sold - 100%. I never buy first leg of rally, because it definitely will be sold by new sellers who wait for retracement to enter short. And I think that it can happen from 2 areas - 1.2620-1.2630 - daily confluence resistance, or 1.31 - weekly confluence resistance and weekly oversold.
2. Personally, I like 1.30-1.31 area for long term bearish position, just reread my weekly research. But market does not have to reach it. It can, but does not have to.
Now about current situation...
First of all - market has reached COP target at daily overbought and weekly pivot resistance 1 area. Definitely I do not want to buy here, and want to see some pull back. Besides, market starts to form DRPO on hourly chart, today NFP and long week end (5th of July - is a holiday). Just look for attachments.
Second, if it really reverse H&S on daily, and for now I think that this is it, usually the target of H&S is XOP, which is right at 1.30-1.31 area.
My plan is as follows - I would like to enter long on a pullback from current long bar on Tuesday (somewhere around 1.24 possibly), I do not want to see deep retracement. Nearest target - 1.2620-1.2630 daily Confluence resistance and daily overbought.
I'll write about it in more detail in weekly research.
")