Sive Morten
Special Consultant to the FPA
- Messages
- 18,669
EUROPEAN FOREX PROFESSIONAL WEEKLY
Analysis and Signals
April 7, 2010
Analysis and Signals
April 7, 2010
Fundamentals
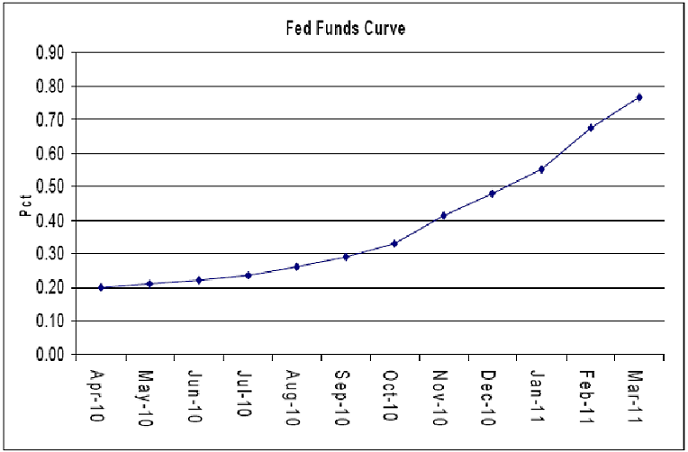
Although current week in general, is linked with retail sales and CPI release, I suppose that this data will not have much influence on the market. The more interesting issue is today’s B. Bernanke testimony. The previous rhetoric has chilled out hot heads a bit with statement of “extending period”, recent macro data didn’t show any drastic changes. Nevertheless, the focus on the potential removal of the extended period language still stays. Further, the trade will be looking to see the Fed’s view on the vibrancy of growth and level of inflation. As you remember, the Fed’s staff downgraded their expectations on inflation and real GDP growth. At the same time, yesterday, it was reported that regional Fed bank directors saw risks to the recovery’s sustainability and saw economic activity as mixed. The Dallas Fed wanted an additional discount rate hike. Fed Fund futures contracts also show a growing probability for tightening. Also worth noting is that the EU harmonized CPI was released at 0.6% and it can be some upside risk for US inflation. In general, CPI is a lagging indicator and the better index is growth in commodities prices. The Fed Fund curve shows that November is a point X for now, because there will not be an FOMC rate meeting in October. The probability of rate hiking should become even stronger in the beginning of 2011.
The other two important themes to discuss are the Greece bailout plan and Chinese macro data. It looks like market has caught some euphoria about Greece’s success in bailout program. Yesterday Greece successfully issued bills and demand was 6 times greater that supply and this gave some support to EU currency in recent days. At the same time PIMCO has noted that they will not buy Greek debts and it continues to be downgraded. Also we should not count on any economic improvements in the near-term future. So, my thought is that this euphoria a bit misguided for now. The Euro zone’s economy still should answer on Spain, Italy Portugal and Greek debts at near future. I even do not even want to mention Eastern Europe.
The last two days there was additional attention to Chinese macro data and rumors about possible Yuan revaluation. CNY Revaluation is a very tough topic – when it has happened for the first time in 2005, USD loss was about 3%. This issue has made additional pressure on the USD. The Chinese President yesterday downplayed the need for Yuan rebalancing, saying that it would neither balance Sino-U.S. trade nor solve the U.S. unemployment problem. The comments were made in the wake of China’s first trade deficit in six years reported over the weekend. A reduced revaluation could potentially support the dollar.
Résumé: The USD growing has become a bit weaker in recent months due to mentioned events, basically because of soft Fed statement and flat macro data. At the same time some of the events has shown just fast reaction and still are not adopted by the market. That’s why I think that perception of Greece success was strongly overreacted as well as a rumor about Yuan revaluation. I think that for now it is just a splash due to some changes in situations and we should not perceive them as determinants of market behavior. I expect that the EUR/USD down move should continue, but maybe with lower pace.
Technical
Quarterly (EURO FX all sessions CME futures)
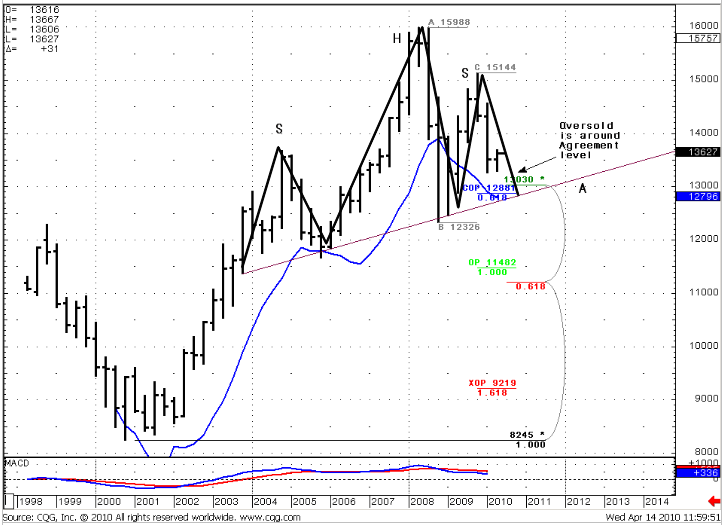
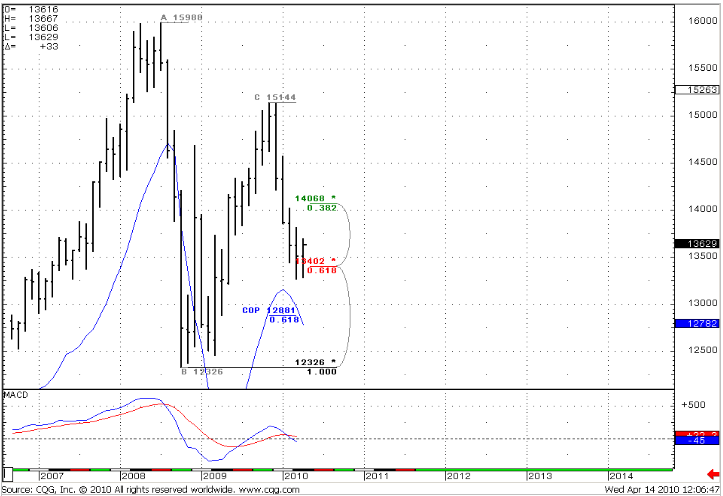
The quarterly situation still in place - we have a down trend. The blue line on the chart is the lower bound of Oscillator predictor that shows us an oversold level of the market. There is no oversold yet, but the market is close to this. Very important thing – Agreement support that includes COP target at 1.2881 and 0.382 major support level at 1.3030. If we add to this quarterly oversold condition then we get a very strong support at 1.28-1.30 level. Also I’ve marked possible H&S pattern – it skewed a bit, but possibly this is one. We have neck line precisely in the Agreement area. All this stuff makes me expect that we shouldn’t break the neck line on the first attempt. I expect retracement higher from the 1.28-1.30 area. Taking into consideration that this is a quartery chart, the market should stay above 1.28 till July 2010. In general, this is in a row with fundamental expectations –we see a down move in April, but the Fed still talks about softening the tightening policy and that can lead to consolidation in the second half of April and May. Although the market has penetrated 1.3030 support level – it didn’t close below it, so I think that it still works. By the way support of 25x5 MA (not shown) is also in the area between 1.28 and 1.30
Quarterly EUR/USD
Monthly (EURO FX all sessions CME futures)
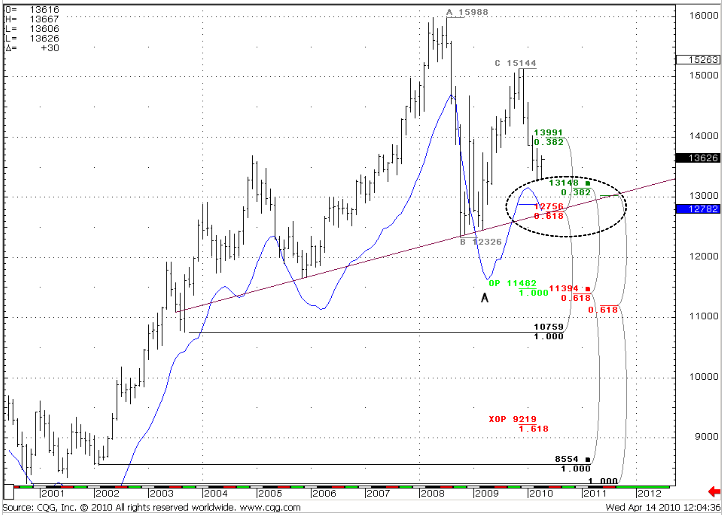
Monthly #1 chart shows some additional detail to the quarterly graph – additional 0.618 support at 1.2756. So, we have monthly Confluence (although it a bit wide) and Agreement with COP=1.2881. Also we have April Oversold level there (1.2782) and a possible neck line of the H&S pattern. The result is the same - 1.28-1.30 is a very strong support, we have all rights to expect a pullback from this somewhere around May. The trend is bearish.
Monthly #2 chart shows another price swing. We have a down trend no oversold yet. In fact, just one support stays for this price swing – 0.618 major support at 1.3402. And market has returned back – above this level.
Monthly #1 EUR/USD
Monthly #2 EUR/USD
Weekly (EURO FX all sessions CME futures)
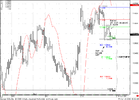
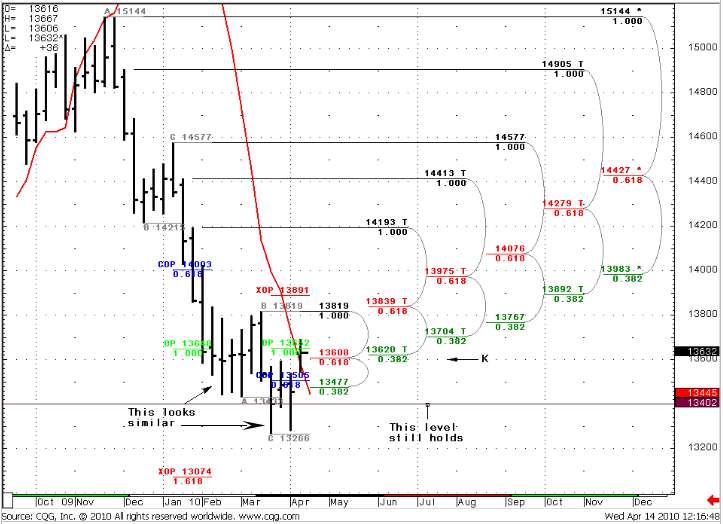
On the weekly chart, the market shows some pull back from 1.3402 level, we have an unconfirmed bullish trend, and it will stay bullish if the current week will close above 1.3585 level. Nevertheless, I think that we should reach an XOP target at 1.3074 level. For the nearest days the market will be in a struggle with serious resistance. First, at weekly – this is a Confluence resistance area at 1.3608-1.3620, second – OP resistance at 1.3652. And as you’ll see below, this entire situation is compounded with a Daily Overbought condition… So, I expect something like the previous situation (marked on the chart). We have seen attempts to break 1.3400 with 3 week doji and short pullback after that. For me the current situation looks similar – 3 attempts to break and pullback higher. That’s why for now I do not expect deep retracement up. Of course, anything is possible, but i my mind I think that we should to touch XOP first…
Besides, if the current trend will not confirm bullish turning, the probability of down move to XOP increases.
Weekly EUR/USD
Daily (EURO FX all sessions CME futures)
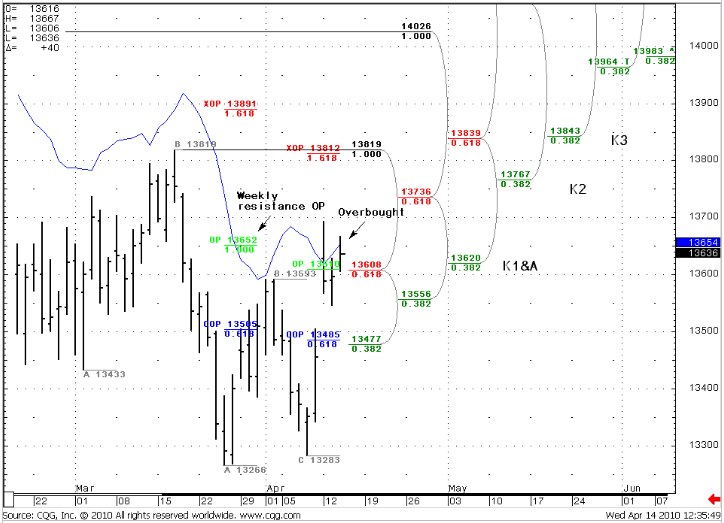
The market is at a strong resistance area at daily that consists of three objectives – daily Confluence and Agreement area at 1.3608-1.3620 and market hasn’t closed above it yet. Second – Weekly OP resistance at 1.3652 and the third – Overbought condition. Certainly, I won’t to buy at such circumstances. Well, of course, we can see some breakout, including volatility breakout (when overbought can double) but this is a question of probability, and I do not want to buy EUR/USD.
Second, we have “Stretch” pattern here – combination of overbought condition and strong Fib resistance. So, this is a Directional pattern and Direction overruled Trend which is bullish. This is another point to the “not to buy” assumption. So what should we do?
To my mind the better way is to watch for hourly chart for some signs of a down thrust. If it will appear, this may be a possibility to trade short. If it will not appear - to stand aside for some time is a better decision for me.
Daily EUR/USD
Trade possibilities (1):
Monthly
The nearest long-term target is COP=1.2880. I expect that we will see retracement higher from 1.28-1.30 area in IIQ.
Weekly
We have both a down and unconfirmed up trend, no oversold conditions. Weekly nearest target is 1.3074-1.3112 area. I still expect that we will reach XOP and think that the current pull back should not be too deep. Watch carefully for trend changing confirmation. If it will fail, the probability to reach XOP increases.
Daily and Hourly
I do not want to buy EUR/USD at current conditions – the market is just under a strong resistance area. We have a bearish Directional signal. I will look for signs of a down thrust at hourly time frame. If it will appear, may be I’ll try to trade the “Stretch” on the short side. If not – I’ll stand aside for some days.
Current European Forex Professional Weekly Signal - Forex Peace Army Forum
(1) “Trade possibilities” are not detailed trade signals with specific entries and exits. They are expectations about possible moves of the market during the week based on market analysis.
<!-- AddThis Button BEGIN -->
<div class="addthis_toolbox addthis_default_style">
<a class="addthis_button_facebook"></a>
<a class="addthis_button_email"></a>
<a class="addthis_button_favorites"></a>
<a class="addthis_button_print"></a>
<span class="addthis_separator">|</span>
<a href="http://www.addthis.com/bookmark.php?v=250&pub=fb-promotion" class="addthis_button_expanded">More</a>
</div>
<script type="text/javascript" src="http://s7.addthis.com/js/250/addthis_widget.js?pub=fb-promotion"></script>
<!-- AddThis Button END -->
General Notice: Information has been obtained from sources believed to be reliable, but the author does not warrant its completeness or accuracy. Opinions and estimates constitute author’s judgment as of the date of this material and are subject to change without notice. Past performance is not indicative of future results. This material is not intended as an offer or solicitation for the purchase or sale of any financial instrument. The opinions and recommendations herein do not take into account individual client circumstances, objectives, or needs and are not intended as recommendations of particular securities, financial instruments or strategies to particular clients. The recipients of this report must make their own independent decisions regarding any securities or financial instruments mentioned herein.