Sive Morten
Special Consultant to the FPA
- Messages
- 18,654
EUROPEAN FOREX PROFESSIONAL WEEKLY
Analysis and Signals
October 29, 2009
Analysis and Signals
October 29, 2009
Fundamentals
Looks like we see risk aversion in the market. That coincides with point 6 in “Basic Macroeconomic Issues”. Investors have borrowed much to finance their positions in equities, corporate bonds and other risky assets. Now they have to close it (at least a part of it), and they need USD to do this. Besides, the end of the year is near, and most investors want to go into the holidays with profit, even it will not be as much as they want.
So let’s try to find out the reasons for that “running into quality”. First, is the US macro data, particularly Consumer Confidence Index that slash below the 50 points. PPI has showed no inflation (-0.6% vs 1.7% in September). Data from a real estate market also wasn’t in line with expectations. It’s showed stagnation rather than growth and just confirmed that pace of recovery has become slower.
Second, equities… There was great disappointment from Bank of America, Lloyds, ING and Capmark. Besides, the dollar short trade was clearly overcrowded. The banking sector has hardly pressed on the equity market – JPM argued that the main return is not from commercial banking. Banks still have to hold solid reserves, loan activity is weak due to unemployment, low solvency of the borrowers and, as a result, low demand for loans. Delinquencies and foreclosure provisions are still strong. Besides, there are talks appeared that GMAC will receive more financing. This is a sign that US financing sector is slow to heal.
Third, as I say, as the year closes, traders are likely inclined to remove the winning trades that they have had on since the bottom of the equity market in March. Given the destruction of wealth over the course of the last year, profit taking is more likely as traders are happy to walk away with any sort of returns. Furthermore, money market mutual funds are at a level that may allow for a more substantial correction.
The great attention will be on today’s GDP release, especially for Inventories. The lower the inventories, the more probability that we will get a “V” shape of recovery. Also great attention will be given for residential construction, because the real estate market is a barometer of economy. If we will receive weak data – then the EUR/USD will continue its down move in near perspective.
So what the result? I think that the general down trend for dollar will continue in the long term unless the fundamentals change. The low LIBOR rate didn’t disappear; investors will close some positions in risky assets, New Year's day will pass and pressure on the USD will resume. We need great fundamentals changing to talk about USD strengthening in the long term. Yes, from time to time we can see growth, but it more technical rather than fundamental. Now the market shifts its attention to the idea of sustainable recovery from a cyclical upturn.
Basic macroeconomic issues:
1.Investors basically pay attention only to the nearest perspective. Since FED rate tightening is too blurring, we should not to expect meaningful USD strengthening until next year (or till first signs of a rate hike possibility);
2.USD will become stronger when investors see these signs, so the expectations concerning EUR/USD rates parity will change;
3.We can expect growth in the USD, if the possibility of second leg of recession will grow, and if investors will have large borrowing positions in USD;
4.EU economic recovery will have a time lag about 1-2 quarters compared to the US recovering;
5.When EU rate hike expectations will appear, the dollar will turn to weakeness;
6.We can see temporary USD strengthening from time to time due some technical movements (risk aversion, stocks buying etc) until the first signs of a rate hike possibility appear.
7.The primary US economic data that will be under scrutiny are personal credit, spending, wages and employment, inflation. This is a final segment in the chain, and it’s very important.
Technical
Previous “trade possibilities (1)” Oct-22-2009:
Monthly:
Momentum is up; extreme price for October is 1.52-1.5240 level. Possibly it can be reached.
Weekly:
The most important thing – market has reached monthly 1.50 target and stay now around it. For now there are still no signs of retracement. If it can go further on next week then the next target is 1.5200 that coincides with extreme overbought level. Retracement is much probable from the 1.5200 level.
Monthly (EURO FX all sessions CME futures)
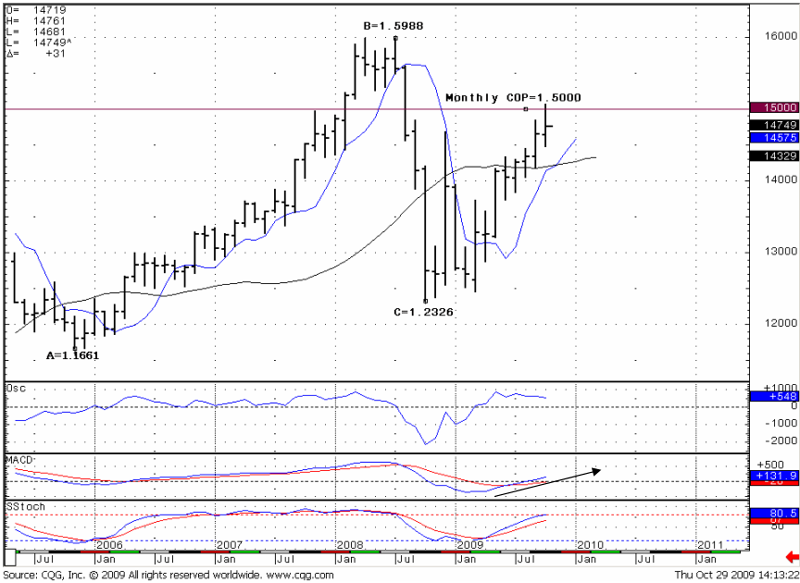
Well, finally we have some signs of retracement (although not on the monthly chart). The monthly chart gives us necessary context for retracement – obtaining of Contraction objective point (COP) at 1.5000 level. COP is just a Fibonacci expansion. At the same time, the trend remains bullish, so in monthly terms we still have to interpret this down move as a retracement. We will not talk in this research about support levels on a monthly basis, because it is too early, and these levels are too far. We have enough time for that in the near future.
The main thing from the monthly chart – obtaining COP and bullish trends, so we expect retracement, but not reversal yet.
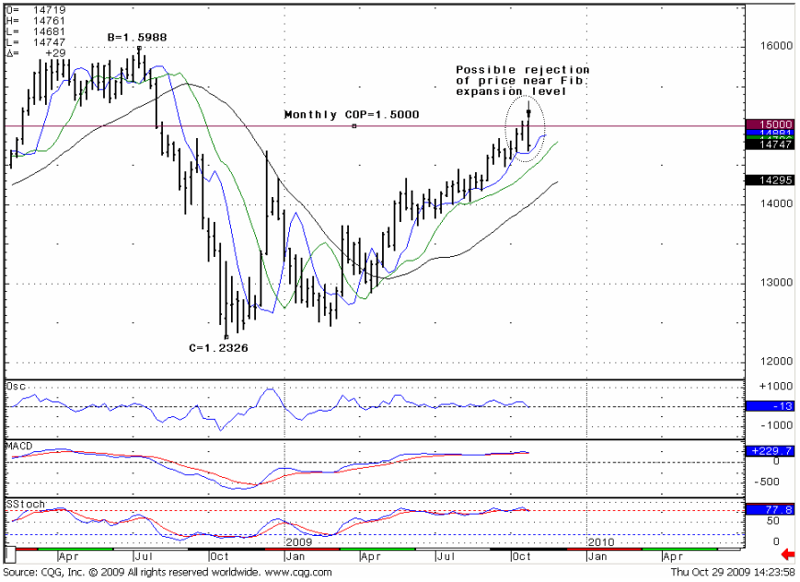
Weekly (EURO FX all sessions CME futures)
There is not much to add from a weekly chart – trends are still bullish, one thing that worthy to talk – possibly it could be a rejection of price from Fib expansion level (COP). It’s important, but, at the same time this pattern is not perfect, it’s too smooth.
So, from the weekly basis we also expect only retracement yet, because trends are bullish. And we will take into consideration that it can be a price rejection –this fact is confirm that COP level is important resistance.
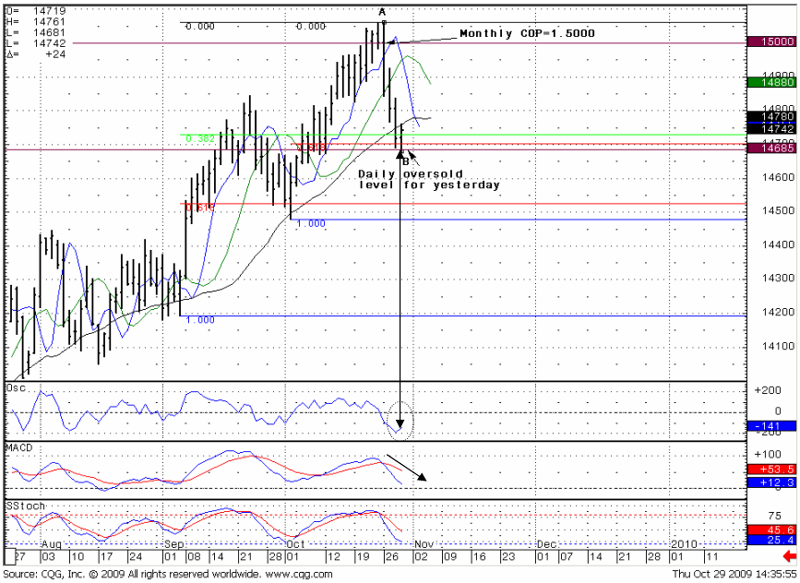
Daily (EURO FX all sessions CME futures)
The daily basis analysis is important and very interesting, it gives us real opportunity. As we can see, the market has turned up from the 1.4686-1.4702 level. This level has huge support, especially for yesterday (due to oversold level). First, there was a daily record oversold. Second – there is a Fib retracement levels conjunction. Third, as you will see on hourly chart, this level has coincided with 1 hour chart moving targets. So, I expect that market will retrace higher from that level. Possibly it will be a deep retracement (0.618), because of previous strong and long up move, but it is not necessary – we see strong thrusting bars down.
So, what do I expect? We already have points A and B. During the higher retracement, I expect to get C points for target calculation, then we can estimate the possible nearest down move targets. This higher move will be just a retracement – daily trends are bearish, and this retracement is only a reaction to an oversold level and strong support. For further analysis let’s look at the hourly chart (but keep in mind daily levels, especially 1.4702).
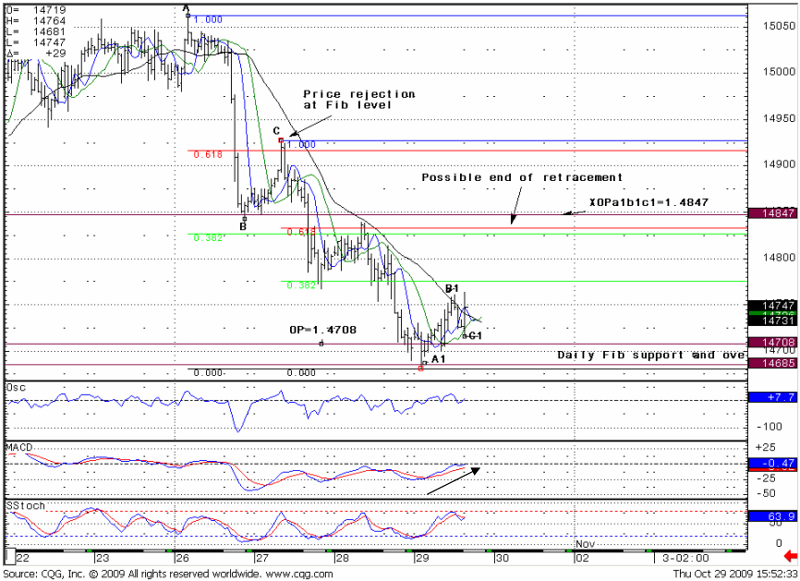
Hourly (EURO FX all sessions CME futures)
So, when we have got the first down move, we could estimate the targets – Fib expansions. Look at A-B-C points – they give us COP = 1.4792, OP = 1.4708 and XOP (expanded objective point) =1.4573. The most interesting for us an OP = 1.4708 (remember daily support level), so they are in agreement. If we surplus a daily overbought, then we have a very strong support level currently. And an upside move has started from this level. So, what am I waiting for? The same thing – I need a retracement on the hourly chart to estimate how high this up move will be and to estimate possible points to go short on daily basis. I do not know for sure now –will it reach 1.4686-1.4702 support again or stop at some Fib level before going higher – we need to watch.
Oh, GDP data just has been released, it not go down further, it start an up move (3.5% vs 3.2% expected), so I’m in a long position with target 1.4820. Now there is a possibility that this up move can stop at 1.4820-1.4840. Try to explain… Look at the chart – hourly trends are bullish, at 1.4820-1.4830 level – this is a conjunction of Fib resistance. Besides, there is an XOP = 1.4847 that in agreement with these levels. So, this is a strong resistance and is my target.
Trade EUR/USD possibilities (1):
Hourly:
When the current retracement ends then it will be possible to calculate a high move target. I’ll try to post it here in th forum. So, on an hourly basis, the up move I expect will continue. Maybe it will end tomorrow or on Monday. The most burn-headed traders can buy at this retracement, based on 5-minute chart (look at my last trade, we will post the description on forum). There is a solid probability that up move will end at 1.4820-1.4840 level as it shown at the chart.
Daily:
When the retracement ends, we can estimate targets for the down move. We have to enter market on the short side from one of the levels that we will estimate during the retracement on the Hourly chart. Be careful during data releases.
(1) “Trade possibilities” are not detailed trade signals with specific entries and exits. They are expectations about possible moves of the market during the week based on market analysis.
<!-- AddThis Button BEGIN -->
<div class="addthis_toolbox addthis_default_style">
<a class="addthis_button_facebook"></a>
<a class="addthis_button_email"></a>
<a class="addthis_button_favorites"></a>
<a class="addthis_button_print"></a>
<span class="addthis_separator">|</span>
<a href="http://www.addthis.com/bookmark.php?v=250&pub=fb-promotion" class="addthis_button_expanded">More</a>
</div>
<script type="text/javascript" src="http://s7.addthis.com/js/250/addthis_widget.js?pub=fb-promotion"></script>
<!-- AddThis Button END -->
General Notice: Information has been obtained from sources believed to be reliable, but the author does not warrant its completeness or accuracy. Opinions and estimates constitute author’s judgment as of the date of this material and are subject to change without notice. Past performance is not indicative of future results. This material is not intended as an offer or solicitation for the purchase or sale of any financial instrument. The opinions and recommendations herein do not take into account individual client circumstances, objectives, or needs and are not intended as recommendations of particular securities, financial instruments or strategies to particular clients. The recipients of this report must make their own independent decisions regarding any securities or financial instruments mentioned herein.
")