Forex Chart Pattern Recognition technique on the Breakout System

Hi mystikal.

Thanks for sharing some examples of your winning trades. I'm getting a hint of what you are doing in your trades, but how about putting down exactly what the rules are in a post, or in an attached file so we can be sure exactly what needs to be done. It will reduce the confusion.

Standing by,
PistolDave


Hello Pistol Dave,

Do you understand exactly how mystikal got his figures exactly.i understand the maths involved but the figures is what i dont understand how he got
 
sell gbpusd @1.9930
stop loss @1.9965
target point@ 1.9770

Hi pistoldave, as a forex trainer and fund manager, disclosing the EDGE on my trading system in which cash is made from the forex markets, on an open forum is not a very wise thing to do. I hope you guys understand that it renders it ineffective by the ''crowd'' and dealing desk brokers from which my stdents and clients would not be better served in their best interests.

The CHART PROJECTION STRATEGY tells us exactly which direction price is going and how far. These information are priceless when trading and making money in the forex markets.The challenge is that this system is not a mechanical system where you send it in a package or where you say if a=b, then buy or sell at c..

It is more of a discretionary system where you are like a professional pilot checking different guages to see how the plane is in relation to the sky and flying with the wind to achieve your objectives.
 
Last edited:
Hello mystical,

I use a similar system as yours to trade, hence i was excited to find yours on this forum.

I'm a little confused about some instances of divergance that you site, it seems to me that you have a different ways of identifying divergance.

Could you throw more light on your different ways of spotting divergance.


Thanks.
 
hi mystikal,i spents some time reading ur posts and all i can say is dat its awesome,thrillin and educative!u shud be on a reality show.i understand if u r reluctant in givin away proprietary system dat took lots of time,energy,money n resources to perfect and i want to assure you dat i aint out for a free lunch.please lets discuss business.we holding an international traders expo/seminar at johanesbourg,south africa along wit my partners and wonder if you can be at the 3 day event to teach select top traders on how exactly u apply this strategy real time.please reply my email is stick_las@yahoo.com.
 
Thanks, Schindler, for the invitation,I've recieved and replied your mail.

Well, we got stopped out on that call on Monday so we scratch that out and say ''NEXT''! Nothing is 100% perfect in forex, mon ami.

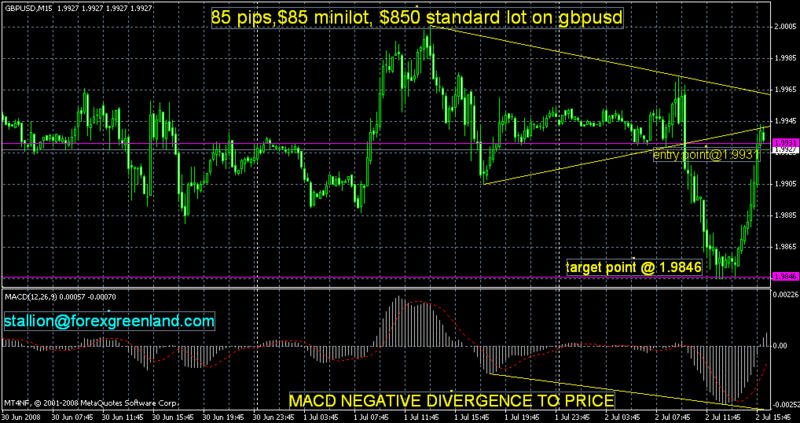
So lets review what happened this morning. Price on the gbpusd made a 1-2-3 top before collapsing on a downward bearish move from teusday's high. 85pips,$85 minilot, $850 standard lot was made in a couple of hours before started retracing upwards. 1.9846 was our final target point , in which price made a low of 1.9845.
We would look into MACD DIVERGENCE next and see how it can be applied in live forex trading. Please feel free to ask any questions or make any comments.

1.9997-1.9912=0.0085
1.9931-0.0085=1.9846

here_s10.gif
 
Last edited:
Hi Mystikal,

Firstly, may I offer my thanks for an interesting and informative thread.

I have a couple of questions...

Is your 1-2-3 pattern based on the Joe Ross 123 high/low chart pattern and if so, do you use the 'Ross hook' as part of your identification of this pattern?

My next question refers to your last post:

...So lets review what happened this morning. Price on the gbpusd made a 1-2-3 top before collapsing on a downward bearish move from teusday's high. 85pips,$85 minilot, $850 standard lot was made in a couple of hours before started retracing upwards. 1.9846 was our final target point , in which price made a low of 1.9845...


1.9997-1.9912=0.0085
1.9931-0.0085=1.9846

What was your reason for choosing the prices 1.9997 and 1.9912 to obtain a measuring range to get your target point?

I understand that you do not wish to divulge the specifics of you system.
But without the knowlege of why you chose these apparently arbitrary prices, and seeing that you posted all of these details post-trade....it would appear that somthin' ain't right here.

with the greatest respect,
Shane
 
Same problem

Hi Mystikal,

What was your reason for choosing the prices 1.9997 and 1.9912 to obtain a measuring range to get your target point?

I understand that you do not wish to divulge the specifics of you system.
But without the knowlege of why you chose these apparently arbitrary prices, and seeing that you posted all of these details post-trade....it would appear that somthin' ain't right here.

with the greatest respect,
Shane

-----------------------------------------------------------------------


The only thing i can see is that they are the rough prices of the body (not tails) of part 1 of the "1-2-3" - lets see if this is consistant with future signals

just my two cents
 
Last edited:
Macd Divergence

[08:37:55] Stalion : BUY GBPUSD @ 1.9782,STOP LOSS @ 1.9747, TARGET POINT @ 1.9869


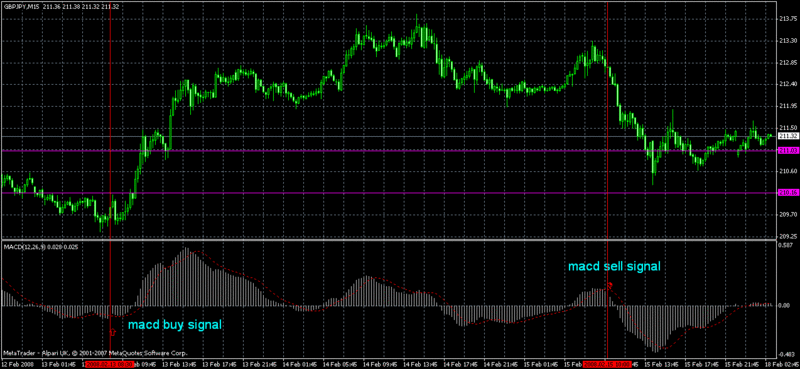
he moving average convergence/divergence-MACD- is a momentum oscillator develpoed by Gerald Appel in the early 70's. Flunctuations in prices are reflected in MACD; if there's a sudden increase in price, the MACD will move upward. It flunctuates above and below a neutral 0.0 line.If MACD is above the zero line, it is bullish. If it is below the zero line, it is bearish.
MACD passing through the zero line successfully anticipates the begining of a strong trend. The crossing of the fast line (lighter) above the signal line (darker) is a buy signal. and it also measures the divergence, or convergence, of a shorter moving average with a longer one.
On Mt4 platforms that was referred to, we only see the red line and MACD Histogram. By improvising and tweaking the interpretation of the MACD, we notice that when MACD Histogram crosses the red line to the upside, it suggests a buy signal.
When MACD Histogram crosses the red line to the downside, it suggests a sell signal.

MACD respects zero and crosses to above its signal line.
Signals
Bull Signals
When MACD crosses to above zero
Bear signals
When MACD crosses to below zero


macd_m10.gif


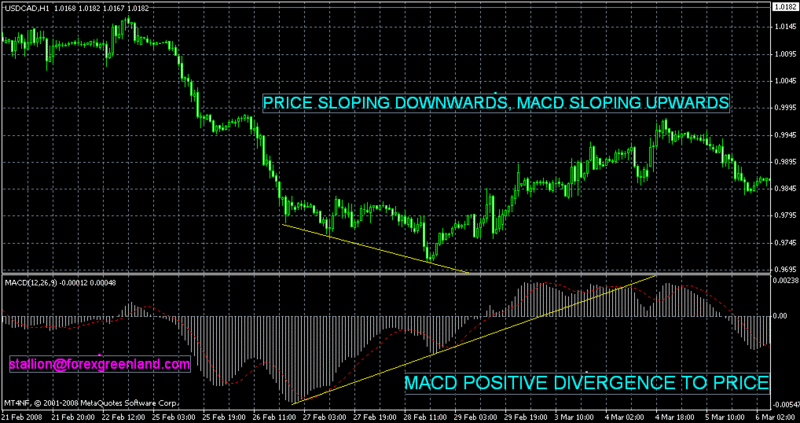
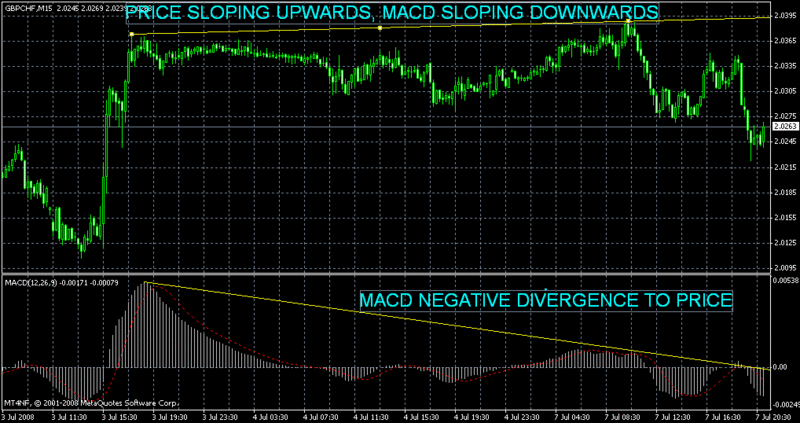
Okay, lets go to MACD DIVERGENCE...We notice this pattern as price trends in one direction while MACD is trending in another. For example, price may be making higher lows but MACD is forming lower lows in its wave pattern.When you see divergence, it foretells the movement of the market. Positive divergence (MACD going up while price is declining) indicates a rally (rise) in the near future.

macd_p10.gif


macd positive divergence to price

Negative divergence (MACD going down while price is rising) indicates a drop in price in the near future.

macd_n10.gif


macd negative divergence to price

To plot divergence, connect the highs of the price 'waves' to each other and the highs of the MACD waves to each other. Or connect the lows of price waves and MACD waves.
 
Back
Top