Sive Morten
Special Consultant to the FPA
- Messages
- 18,673
Fundamentals
Through the weekend investors wait for sentiment, which markets will set on next week, after G20 meeting. Gold market shows no progress by far, and I think it would be better to take a look at GBP again. Besides, here we see interesting divergence between UK economy stats and BoE decisions.
As you know, we have long-term bearish view on GBP with nearest 1.13 target to USD due Brexit and specific role of UK in Europe. While EU core countries start process of involving and accommodation to new reality of global economy and politics, UK stands a bit out of this as historical US ally. Major source of UK income that comes from Banking and Insurance services probably will be harmed due capital outflow and trigger chain reaction in other spheres - services, employment, construction etc.
Britain’s current account deficit with the rest of the world ballooned to its highest since late 2016 earlier this year, official figures showed on Friday, though much of the increase was driven by volatile gold trades.
At first glance, the bigger shortfall in the deficit — which Bank of England Governor Mark Carney has long warned leaves Britain dependent “on the kindness of strangers” — suggested greater vulnerability for the world’s fifth-largest economy ahead of Brexit.
The deficit widened by 6.3 billion pounds in the first three months of 2019 to 30.0 billion pounds, or 5.6% of economic output, its biggest since the third quarter of 2016.
However, the ONS said the rise was driven by imports of unspecified goods — mostly gold from London’s major trading hub — rather than a fundamental weakening of the trade balance.
Stripping this out, Britain’s current account deficit would stand at 3.7% — still large by international standards.
A drop-off in foreign demand for British assets after Brexit could trigger a further fall in sterling and make it harder for businesses and consumers to raise finance or borrow, the BoE has warned.
“An elevated shortfall is a potential source of vulnerability for the UK economy, particularly if there was any major loss of investor confidence in the UK for any reason, most obviously due to heightened concerns over the economy if there was a no-deal Brexit,” EY ITEM Club economist Howard Archer said.
Office for National Statistics figures also showed robust economic growth in early 2019 as businesses rushed to stockpile raw materials to offset the risk of trade disruption in March, when Britain was originally due to leave the European Union.
“GDP grew solidly and was unrevised in the first quarter of 2019, with manufacturing seeing strong growth due to orders being brought forward ahead of the UK’s original EU departure date,” ONS statistician Rob Kent-Smith said.
Quarter-on-quarter the economy grew by 0.5%. The 1.8% annual rate of gross domestic product growth was the highest since the third quarter of 2017.
Businesses increased inventories by a net 5.7 billion pounds during the first quarter on an adjusted basis. Unadjusted figures pointed to inventory building adding 0.9 percentage points to GDP growth.
Economists expect payback during the current quarter, however, and the BoE predicts zero GDP growth as business investment remains on hold ahead of the new Brexit date of Oct. 31. Annual growth will slow to 1.5% this year, even if Britain leaves the EU with a transition deal, it estimates.
Both contenders to become prime minister have said they are prepared to leave the EU without a transition deal if necessary.
Britain’s economy has slowed since the Brexit referendum, and now faces increased headwinds from trade tensions between the United States and China and a slowdown in Europe.
Business investment showed an annual fall of 1.5%, a fraction bigger than earlier reported, while household spending remained the mainstay of growth, up 1.9% on the year.
There are some signs consumer demand is softening, however, despite a robust job market. A consumer sentiment survey showed morale fell in June.
Recent CFTC data shows slow but stable growth of net short speculative positions in GBP. Last week has not become an exception. At the same time, overall position stands far from record lows and has enough room to grow more.

Source: cftc.gov
Charting by Investing.com
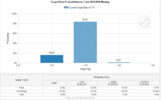
According to CME Watching to BoE tool, based on UK interest rate futures, market doesn't expect any rate change till November 2019. At the same time, take a look at the table under the chart - within 1 month probability of rate cut has increased more that two times - from around 7% to 16%.

Source: cmegroup.com
This expectation contradicts to BoE relations and their understanding of UK economy statistic data. This phenomenon we discuss below.
Meantime, nobody takes Brexit riddle out of the table. Last time, when we've talked on GBP, it was a question of new Prime Minister and inner elections of UK Conservatives Party.
As Reuters reports, Sterling fell to a new 5-month low to EUR on Friday as investors continued to fret about the possibility of a no-deal Brexit should Boris Johnson win the Conservative party leadership race and replace Prime Minister Theresa May as prime minister.
Investors have been reluctant to take big positions in the pound amid the Conservative party leadership contest, which should end with a new prime minister in place by the end of July.
Johnson, the frontrunner, has said Britain will leave the European Union on Oct. 31 deal or no-deal, but he has also said there is only a one in a million chance of leaving without an agreement in place.
“It is going to be a bumpy ride. GBP looks a bit more cheap. But the fact that it is cheap and unloved means there is a risk we see a slightly stronger GBP. We could potentially see a stronger reaction if more market friendly news are delivered,” said Joseph Little, global chief strategist at HSBC Global Asset Management.
Some say that the pound is likely to remain under pressure until there is clarity around Brexit.
“As long as a no-deal Brexit remains a possibility, that should keep the pound below the psychological 1.30 mark against the U.S. dollar,” said Han Tan, market analyst at FXTM.
“Even though the UK leadership transition is set to be completed within the next month, sterling is expected to remain exposed to political risks leading up to the Oct. 31 Brexit deadline, as the UK continues to pursue its exit from the European Union.”
“An increasing political risk premium is the clear driver, with the perceived risk of an early election continuing to creep higher,” said Adam Cole, chief currency strategist at RBC Capital Markets.
Traders also reported the presence of large options expiring around $1.27 levels over the next two weeks as having an upward push on the pound.
Finally Fathom consulting suggests that some divergence exists between investors and BoE view on current situation in UK, as Investors ignore official warnings of higher rates as UK economy stagnates
Our UK Economic Sentiment Indicator (ESI) slipped to 0.1% in May, matching the reading seen in the immediate aftermath of the EU referendum. Back then, sentiment recovered quickly, as both firms and households refocused their attentions on more near-term issues, placing Brexit in the ‘something to worry about later’ category. But with political and economic uncertainty likely to remain elevated, at least until the autumn, we are unlikely to see such a pronounced rebound in confidence this time around.
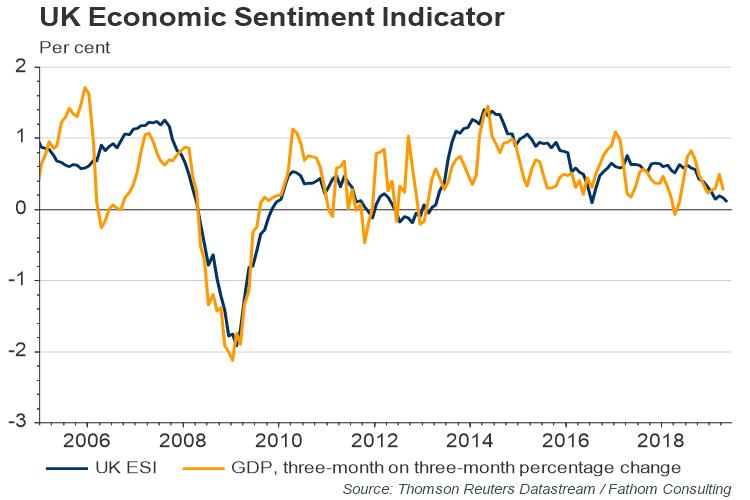
Our UK ESI tends to be more stable than the ONS estimate of economic growth, and for that reason we view it as a measure of underlying momentum in the economy. With UK economic growth erratically strong in the first quarter, reportedly buoyed by preparations for a ‘no deal’ Brexit, we expect a much weaker reading in the second quarter. Official monthly data show that UK GDP fell by 0.1% in March and by 0.4% in April. We expect to see a 0.1% contraction in the size of the UK economy in Q2, with risks around this projection to the downside.
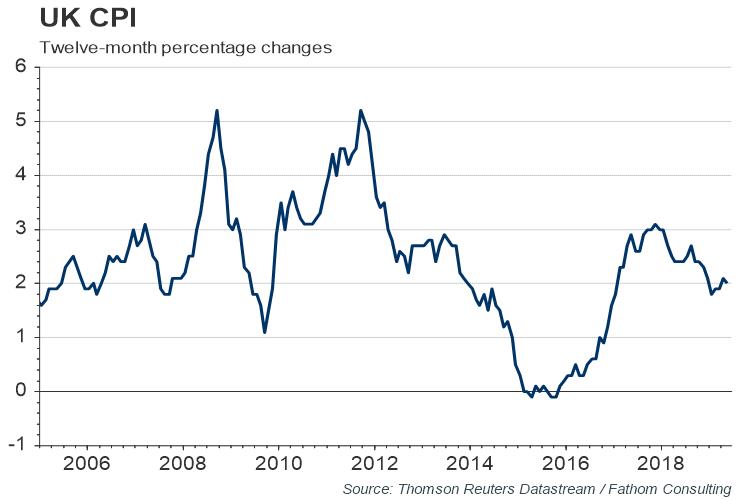
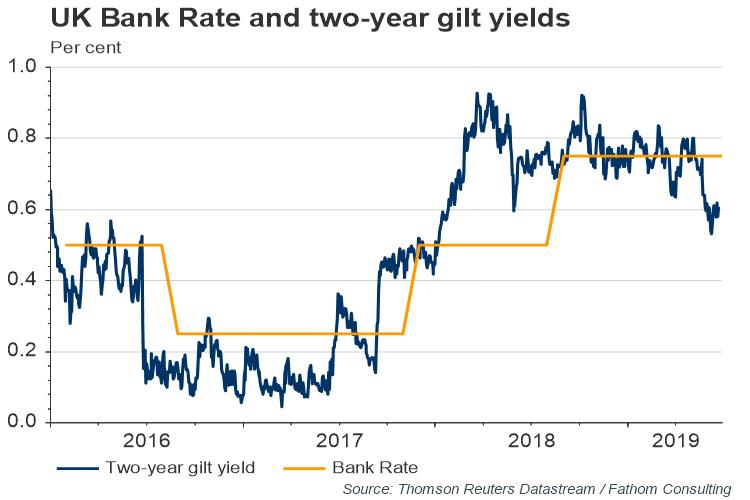
At the meeting that concluded on 20 June, the Bank of England’s Monetary Policy Committee revised down its projection for growth in Q2 from 0.2% to 0.0%. Nevertheless, members continue to warn of higher interest rates. With inflation on target in May, and set to fall through the second half of this year, reflecting the effects of weaker energy prices, investors have rightly taken a different view. A comparison of two-year gilt yields with current Bank Rate provides a simple metric of the direction of change of official interest rates judged likely by market participants. By late June, the two-year yield had dropped some 15 basis points below the policy rate — a clear sign that investors were expecting looser, rather than tighter policy.
Thus, our long-term context holds bearish. With long-term bearish view on GBP any bullish setups on daily and intraday charts should be treated as short-term and tactical. Long-term traders could use them for taking long-term bearish positions on GBP.
Technicals
Monthly
Our long-term view mostly stands the same. Here you can see our major targets chain.
On monthly chart trend has turned bearish, price has dropped below YPP, confirming long-term bearish sentiment. Bearish grabber that has been formed in the beginning of the year is still valid and suggests drop below 1.24 area.
On monthly chart we need to follow the sequence of the swing to understand where we're now. Action down to 1.21 was the CD leg of our major all-time pattern. Once COP extension has been hit, market turned to reasonable retracement and completed harmonic swing. We see that upside harmonic swing to 1.46 area is slower than downside drop.
Now market is going down again. It could mean that CD leg continues and in long-term perspective, OP at 0.95 target could be completed. But this is too long-term perspective for us. We need something closer to use it as real target in day-by-day trading.
Also I wouldn't talk on AB=CD upside action after major COP. COP is minor target and it is quite rare leads to deep retracement in shape of 2 legs. So we exclude chances of ab-cd upside action now to major 1.52-1.54 K-resistance area.
Overall price action shape lets us to suggest appearing of butterfly pattern, with first target around 1.1335. YPS1 already has been tested once. As market returns back to it now significant support will be provided there on second test.

Weekly
Weekly trend stands bearish as well, oversold level is around 1.22 area.
Here we also have our major weekly target - COP around 1.2170 area. OP target of the weekly AB=CD stands around 1.1350 and coincides with monthly butterfly target, as 100 pips difference is not significant for a big scale charts.
As we've said previously the valuable moment for us here is a failure of reverse H&S pattern. As market has broken the harmony of the pattern and price dropped under the low of the left shoulder, standing close to the head - final downside breakout is just a question of time.
Still, last week we've discussed some upside retracement as dollar-bearish driving factors have made an impact on GBP/USD as well, although with less degree than the others. Thus, although our long-term view is bearish, in short-term perspective, market could show a bit deeper upside retracement.
I've marked last week as "R" reversal one as it shows some features of short-term reverse, while it is not absolutely reversal as close not above the top of previous week. But it could trigger some upside continuation especially on a background of some G20 news.

Daily
Here, on daily our major view stands bearish as well. By looking at AB=CD pattern shape we see strong acceleration of CD leg right to OP target, so that market has dropped slightly below it, by momentum action. It means that drop to XOP will happen sooner rather than later.
Although MACD trend stands bullish here, upside action looks heavy and price can't break through minor 3/8 resistance. Here we consider reverse H&S shape that could make a job for us as separate trading setup as indicator of downside continuation in a case of its failure.
It means that 1.26 is a signal area for us, where we could consider taking a short-term bullish trade, but at the same time be aware of failure, if GBP breaks it down.

Intraday
On 4H chart you can see this H&S pattern better. If our suggestion will be correct - we could keep an eye on AB=CD pattern, which creates Agreement with 5/8 Fib support. As a result we could get "222" Buy pattern and it becomes a background for scalp long trade.

On 1H chart once we've mentioned already direct H&S pattern and on Friday, market finally has reached 5/8 Fib resistance and formed top of right arm. Overall H&S shape doesn't look perfect. We do not have intention to trade it short and just wait when price will reach our 1.2610 area.

Conclusion:
Analysis of fundamental factors this week confirms existing of bearish sentiment and we keep our long-term bearish view on GBP. As B. Johnson becomes most probable PM candidate, we think that he becomes the factor of increasing uncertainty as B. Johnson has recommended himself as very contradicted politician. He will have too few time to provide improved Brexit Agreement and we suspect that he is the choice of UK political forces who takes bet on hard way of Brexit. Thus, we treat his election as bearish sign for GBP.
Simultaneously UK statistics gives signs of slowdown as inflation as overall performance which will exacerbated closer to October. Now people try to prepare to Brexit day and behaves more active, forming reserves on "difficult" times. This improves economy data.
In short-term perspective we have bearish target around 1.22 area. We intend open short position either using deeper upside retracement of daily reverse H&S pattern or act on its failure on breakout of 1.26 right arm bottom.
The technical portion of Sive's analysis owes a great deal to Joe DiNapoli's methods, and uses a number of Joe's proprietary indicators. Please note that Sive's analysis is his own view of the market and is not endorsed by Joe DiNapoli or any related companies.
Through the weekend investors wait for sentiment, which markets will set on next week, after G20 meeting. Gold market shows no progress by far, and I think it would be better to take a look at GBP again. Besides, here we see interesting divergence between UK economy stats and BoE decisions.
As you know, we have long-term bearish view on GBP with nearest 1.13 target to USD due Brexit and specific role of UK in Europe. While EU core countries start process of involving and accommodation to new reality of global economy and politics, UK stands a bit out of this as historical US ally. Major source of UK income that comes from Banking and Insurance services probably will be harmed due capital outflow and trigger chain reaction in other spheres - services, employment, construction etc.
Britain’s current account deficit with the rest of the world ballooned to its highest since late 2016 earlier this year, official figures showed on Friday, though much of the increase was driven by volatile gold trades.
At first glance, the bigger shortfall in the deficit — which Bank of England Governor Mark Carney has long warned leaves Britain dependent “on the kindness of strangers” — suggested greater vulnerability for the world’s fifth-largest economy ahead of Brexit.
The deficit widened by 6.3 billion pounds in the first three months of 2019 to 30.0 billion pounds, or 5.6% of economic output, its biggest since the third quarter of 2016.
However, the ONS said the rise was driven by imports of unspecified goods — mostly gold from London’s major trading hub — rather than a fundamental weakening of the trade balance.
Stripping this out, Britain’s current account deficit would stand at 3.7% — still large by international standards.
A drop-off in foreign demand for British assets after Brexit could trigger a further fall in sterling and make it harder for businesses and consumers to raise finance or borrow, the BoE has warned.
“An elevated shortfall is a potential source of vulnerability for the UK economy, particularly if there was any major loss of investor confidence in the UK for any reason, most obviously due to heightened concerns over the economy if there was a no-deal Brexit,” EY ITEM Club economist Howard Archer said.
Office for National Statistics figures also showed robust economic growth in early 2019 as businesses rushed to stockpile raw materials to offset the risk of trade disruption in March, when Britain was originally due to leave the European Union.
“GDP grew solidly and was unrevised in the first quarter of 2019, with manufacturing seeing strong growth due to orders being brought forward ahead of the UK’s original EU departure date,” ONS statistician Rob Kent-Smith said.
Quarter-on-quarter the economy grew by 0.5%. The 1.8% annual rate of gross domestic product growth was the highest since the third quarter of 2017.
Businesses increased inventories by a net 5.7 billion pounds during the first quarter on an adjusted basis. Unadjusted figures pointed to inventory building adding 0.9 percentage points to GDP growth.
Economists expect payback during the current quarter, however, and the BoE predicts zero GDP growth as business investment remains on hold ahead of the new Brexit date of Oct. 31. Annual growth will slow to 1.5% this year, even if Britain leaves the EU with a transition deal, it estimates.
Both contenders to become prime minister have said they are prepared to leave the EU without a transition deal if necessary.
Britain’s economy has slowed since the Brexit referendum, and now faces increased headwinds from trade tensions between the United States and China and a slowdown in Europe.
Business investment showed an annual fall of 1.5%, a fraction bigger than earlier reported, while household spending remained the mainstay of growth, up 1.9% on the year.
There are some signs consumer demand is softening, however, despite a robust job market. A consumer sentiment survey showed morale fell in June.
Recent CFTC data shows slow but stable growth of net short speculative positions in GBP. Last week has not become an exception. At the same time, overall position stands far from record lows and has enough room to grow more.
Source: cftc.gov
Charting by Investing.com
According to CME Watching to BoE tool, based on UK interest rate futures, market doesn't expect any rate change till November 2019. At the same time, take a look at the table under the chart - within 1 month probability of rate cut has increased more that two times - from around 7% to 16%.
Source: cmegroup.com
This expectation contradicts to BoE relations and their understanding of UK economy statistic data. This phenomenon we discuss below.
Meantime, nobody takes Brexit riddle out of the table. Last time, when we've talked on GBP, it was a question of new Prime Minister and inner elections of UK Conservatives Party.
As Reuters reports, Sterling fell to a new 5-month low to EUR on Friday as investors continued to fret about the possibility of a no-deal Brexit should Boris Johnson win the Conservative party leadership race and replace Prime Minister Theresa May as prime minister.
Investors have been reluctant to take big positions in the pound amid the Conservative party leadership contest, which should end with a new prime minister in place by the end of July.
Johnson, the frontrunner, has said Britain will leave the European Union on Oct. 31 deal or no-deal, but he has also said there is only a one in a million chance of leaving without an agreement in place.
“It is going to be a bumpy ride. GBP looks a bit more cheap. But the fact that it is cheap and unloved means there is a risk we see a slightly stronger GBP. We could potentially see a stronger reaction if more market friendly news are delivered,” said Joseph Little, global chief strategist at HSBC Global Asset Management.
Some say that the pound is likely to remain under pressure until there is clarity around Brexit.
“As long as a no-deal Brexit remains a possibility, that should keep the pound below the psychological 1.30 mark against the U.S. dollar,” said Han Tan, market analyst at FXTM.
“Even though the UK leadership transition is set to be completed within the next month, sterling is expected to remain exposed to political risks leading up to the Oct. 31 Brexit deadline, as the UK continues to pursue its exit from the European Union.”
“An increasing political risk premium is the clear driver, with the perceived risk of an early election continuing to creep higher,” said Adam Cole, chief currency strategist at RBC Capital Markets.
Traders also reported the presence of large options expiring around $1.27 levels over the next two weeks as having an upward push on the pound.
Finally Fathom consulting suggests that some divergence exists between investors and BoE view on current situation in UK, as Investors ignore official warnings of higher rates as UK economy stagnates
Our UK Economic Sentiment Indicator (ESI) slipped to 0.1% in May, matching the reading seen in the immediate aftermath of the EU referendum. Back then, sentiment recovered quickly, as both firms and households refocused their attentions on more near-term issues, placing Brexit in the ‘something to worry about later’ category. But with political and economic uncertainty likely to remain elevated, at least until the autumn, we are unlikely to see such a pronounced rebound in confidence this time around.
Our UK ESI tends to be more stable than the ONS estimate of economic growth, and for that reason we view it as a measure of underlying momentum in the economy. With UK economic growth erratically strong in the first quarter, reportedly buoyed by preparations for a ‘no deal’ Brexit, we expect a much weaker reading in the second quarter. Official monthly data show that UK GDP fell by 0.1% in March and by 0.4% in April. We expect to see a 0.1% contraction in the size of the UK economy in Q2, with risks around this projection to the downside.
At the meeting that concluded on 20 June, the Bank of England’s Monetary Policy Committee revised down its projection for growth in Q2 from 0.2% to 0.0%. Nevertheless, members continue to warn of higher interest rates. With inflation on target in May, and set to fall through the second half of this year, reflecting the effects of weaker energy prices, investors have rightly taken a different view. A comparison of two-year gilt yields with current Bank Rate provides a simple metric of the direction of change of official interest rates judged likely by market participants. By late June, the two-year yield had dropped some 15 basis points below the policy rate — a clear sign that investors were expecting looser, rather than tighter policy.
Thus, our long-term context holds bearish. With long-term bearish view on GBP any bullish setups on daily and intraday charts should be treated as short-term and tactical. Long-term traders could use them for taking long-term bearish positions on GBP.
Technicals
Monthly
Our long-term view mostly stands the same. Here you can see our major targets chain.
On monthly chart trend has turned bearish, price has dropped below YPP, confirming long-term bearish sentiment. Bearish grabber that has been formed in the beginning of the year is still valid and suggests drop below 1.24 area.
On monthly chart we need to follow the sequence of the swing to understand where we're now. Action down to 1.21 was the CD leg of our major all-time pattern. Once COP extension has been hit, market turned to reasonable retracement and completed harmonic swing. We see that upside harmonic swing to 1.46 area is slower than downside drop.
Now market is going down again. It could mean that CD leg continues and in long-term perspective, OP at 0.95 target could be completed. But this is too long-term perspective for us. We need something closer to use it as real target in day-by-day trading.
Also I wouldn't talk on AB=CD upside action after major COP. COP is minor target and it is quite rare leads to deep retracement in shape of 2 legs. So we exclude chances of ab-cd upside action now to major 1.52-1.54 K-resistance area.
Overall price action shape lets us to suggest appearing of butterfly pattern, with first target around 1.1335. YPS1 already has been tested once. As market returns back to it now significant support will be provided there on second test.
Weekly
Weekly trend stands bearish as well, oversold level is around 1.22 area.
Here we also have our major weekly target - COP around 1.2170 area. OP target of the weekly AB=CD stands around 1.1350 and coincides with monthly butterfly target, as 100 pips difference is not significant for a big scale charts.
As we've said previously the valuable moment for us here is a failure of reverse H&S pattern. As market has broken the harmony of the pattern and price dropped under the low of the left shoulder, standing close to the head - final downside breakout is just a question of time.
Still, last week we've discussed some upside retracement as dollar-bearish driving factors have made an impact on GBP/USD as well, although with less degree than the others. Thus, although our long-term view is bearish, in short-term perspective, market could show a bit deeper upside retracement.
I've marked last week as "R" reversal one as it shows some features of short-term reverse, while it is not absolutely reversal as close not above the top of previous week. But it could trigger some upside continuation especially on a background of some G20 news.
Daily
Here, on daily our major view stands bearish as well. By looking at AB=CD pattern shape we see strong acceleration of CD leg right to OP target, so that market has dropped slightly below it, by momentum action. It means that drop to XOP will happen sooner rather than later.
Although MACD trend stands bullish here, upside action looks heavy and price can't break through minor 3/8 resistance. Here we consider reverse H&S shape that could make a job for us as separate trading setup as indicator of downside continuation in a case of its failure.
It means that 1.26 is a signal area for us, where we could consider taking a short-term bullish trade, but at the same time be aware of failure, if GBP breaks it down.
Intraday
On 4H chart you can see this H&S pattern better. If our suggestion will be correct - we could keep an eye on AB=CD pattern, which creates Agreement with 5/8 Fib support. As a result we could get "222" Buy pattern and it becomes a background for scalp long trade.
On 1H chart once we've mentioned already direct H&S pattern and on Friday, market finally has reached 5/8 Fib resistance and formed top of right arm. Overall H&S shape doesn't look perfect. We do not have intention to trade it short and just wait when price will reach our 1.2610 area.
Conclusion:
Analysis of fundamental factors this week confirms existing of bearish sentiment and we keep our long-term bearish view on GBP. As B. Johnson becomes most probable PM candidate, we think that he becomes the factor of increasing uncertainty as B. Johnson has recommended himself as very contradicted politician. He will have too few time to provide improved Brexit Agreement and we suspect that he is the choice of UK political forces who takes bet on hard way of Brexit. Thus, we treat his election as bearish sign for GBP.
Simultaneously UK statistics gives signs of slowdown as inflation as overall performance which will exacerbated closer to October. Now people try to prepare to Brexit day and behaves more active, forming reserves on "difficult" times. This improves economy data.
In short-term perspective we have bearish target around 1.22 area. We intend open short position either using deeper upside retracement of daily reverse H&S pattern or act on its failure on breakout of 1.26 right arm bottom.
The technical portion of Sive's analysis owes a great deal to Joe DiNapoli's methods, and uses a number of Joe's proprietary indicators. Please note that Sive's analysis is his own view of the market and is not endorsed by Joe DiNapoli or any related companies.