Sive Morten
Special Consultant to the FPA
- Messages
- 18,699
Fundamentals
(Reuters) Sterling edged up on Friday but was on track for a fifth consecutive quarter of losses against the dollar - the currency's worst run since 1984.
The pound plunged to a 31-year low after Britain voted to leave the European Union, falling as low as $1.28 early in the third quarter, having already weakened in the run-up to the June referendum on worries about its outcome.
Sterling is now trading more than 40 U.S. cents - or 25 percent - lower than the six-year highs it reached in mid-2014, with uncertainty over Brexit and a drying-up of expectations for the Bank of England having weighed.
Last month the BoE cut its key interest rate to another record low and relaunched an asset-purchase programme in an effort to cushion the blow dealt by the referendum outcome, and some expect it to ease policy again before the end of the year.
Data showing Britain's giant services sector grew much more strongly than expected in July, in the clearest sign to date that the economy did not slow sharply after the shock of the referendum, lifted sterling only briefly, and by 1500 it flat on the day below $1.30.
After a media report said an agreement between Deutsche Bank and U.S. authorities was being discussed - which would slash huge fines over alleged misselling - sterling jumped to a day's high of $1.3024. But it was still down 1 percent for the month, and more than 2 percent down over the quarter.
"From where we're sitting today, sterling remains a pretty vulnerable currency," said Rabobank currency strategist Jane Foley. "There does seem to be an appetite now to sell into rallies, and I think that does highlight the market's sensitivity to the political uncertainty the UK faces."
"We're all very much aware of the fact that Brexit hasn't begun yet. All we've had in the referendum, and we've still got to do all the hard work," she added.
A survey published earlier on Friday showed British consumer morale rocketed back to pre-Brexit levels in September, confounding expectations that the vote to leave the EU would wreak more lasting damage on Britons' willingness to spend.
"The good news is that from the perspective of UK consumers, the Brexit shock has been fleeting," wrote Bank of Tokyo-Mitsubishi UFJ currency strategist Derek Halpenny.
Against the euro, sterling edged up 0.1 percent to 86.42 pence, but for the quarter was down more than 3 percent against the single currency.
Next week, manufacturing and production data should provide indicators of the health of the British economy.
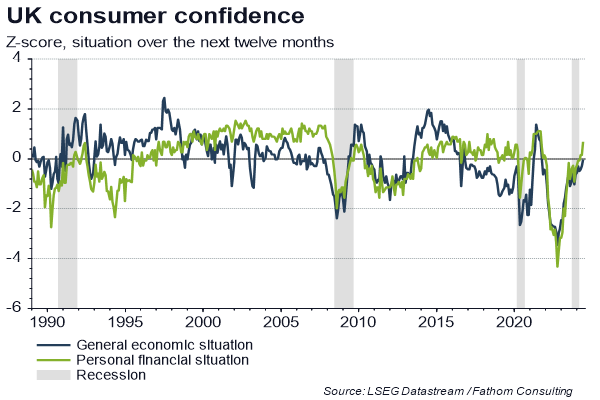
Fathom consulting has taken snapshot on UK consumer confidence:
UK consumer remains resilient, but for how long?
UK consumers have largely shrugged off the EU referendum result, with data released today revealing that the headline GfK Consumer Confidence Index rebounded in September to levels last seen before the UK's Brexit vote in June.
Service sector data for July, also released today, were far stronger than expected, with output rising by 0.4% between the months of June and July.
Overall, today's data are consistent with positive GDP growth in the third quarter, meaning that the UK will avoid recession this year - in line with our forecast.
But looking ahead, the increased probability of a 'Hard Brexit' is likely to continue to weigh on business investment, with the anticipated triggering of Article 50 early next year a key pressure point.
COT Data
Last week CFTC numbers shows clear bearish picture. Speculative net-short position has increased significantly. Although increasing itself was mostly due closing of longs, but open interest also has increased slightly, thus it means that some new shorts also have been taken. This situation mostly supports our previous view on GBP perspectives:

Technicals
Monthly
Right now monthly trend is bearish, but market is not at oversold on monthly chart. We've said that lows will not survive because market has all-time 0.618 AB=CD target below them, so that has happened. Market has dropped and right now stands there, no W&R.
Overall picture looks bearish by some signs. First is - acceleration down to AB-CD target. Usually fast drop on this point tells that market has chances to continue to AB=CD target, which stands at 1.06 area. Currently it seems too brave suggestion, but at least some minor continuation down is very probable.
The point is if you will take a look at all-time GBP chart, you'll see that market already has broken major 5/8 Fib support and on a way down, drop is really fast since first leg was on 2008 crisis. Overall fundamental situation is mostly supportive to this scenario, besides, 20 points is not really big distance to GBP that is more volatile than many other major currencies:

That's why technically there is nothing impossible with 1.06 area. - that will be AB=CD on a way down.
Second stands for shorter-term perspective. GBP has dropped below YPS1 and this indicates starting of new bearish trend, not just a retracement down, but trend.
Swings right now are so large, that monthly chart let's us talk on very long-term perspective and does not bring any clarity on shorter-term perspective.
So, as no bounce has happened yet, in short-term perspective market could try to reach another AB-CD 0.618 traget. Initially we were focused on AB-CD pattern with 1.3080 target since it was more probable. As GBP has hit it already but shows no reaction, it could mean that A'B-CD target around 1.2450 area also could be hit, if we adjust our initial "A" point and shift it to "A' " as it is shown on the chart.
Last two months GBP stands rather tight. This is also looks bearish. As GBP has reached minor AB-CD target @ 1.3080 area, it should show at least some minor bounce, but price wasn't able to do this. That's why downside continuation is very probable here:

Weekly
Today we will not talk again on our VOB pattern. It's still valid, but market has not shown upside bounce fast, so, we will keep an eye on it, but our trade based on VOB is postponed a bit, probably. Or may be market needs to complete some closer targets before VOB pattern will start to work... Anyway...
Last week's range was rather tight. So it has made no impact on overall picture and patterns that we've discussed last week mostly stand the same.
On weekly chart we have triangle consolidation that could shift to butterfly "Buy" pattern. As our monthly target stands around 1.2450 - it could be reached by butterfly pattern.
Also, we have bearish evening star candlestick shape, and take a look - some kind of bearish dynamic pressure, as trend has turned bullish while price action is not:

Daily
Last week guys, even on daily chart action was very quiet. Take a look, whole week action was mostly inside one to Friday's drop two weeks ago.
Our idea here mostly stands the same and is based on triangle. As we've estimated last week this triangle has solid chances to shift into butterfly. Take a look at our initial triangle and setup that we've discussed 3-weeks ago - "222" Buy" pattern, remember?
In general this setup has worked well, but market has not quite reached AB=CD upside target and turned down too early. This indicates GBP weakness. Also, CD leg was two times longer than AB. So, inability of the market to complete target is a bearish sign.
Now take a look how market fluctuates around trend line of triangle, on our "222" setup it was broken up, on a way back price has tested it tried to move up but failed and returned back inside triangle. And then most important thing has happened - GBP has re-tested the same line but from the opposite direction and stays inside the triangle. Total combination of upside triangle breakout and inability to continue move up or at
least to hold above triangle is a bearish sign. And it means that downward breakout is just a question of time. Trend is bearish on daily chart:

4-hour
Last week we have seen another testing of triangle trend line and downward pullback. Currently GBP shows very weak reaction on any GBP supportive data. Cable shows even less volatility than EUR last week. Right now market has no significant support, just lower border of triangle.
On Friday bearish grabber has been formed which suggests appearing of butterfly pattern and reaching one of its targets. Still, overall action mostly stands sideways, doesn't show any significant thrust, MACD shows strong bullish divergence that could lead to upside retracement to WPR1 or even testing of October MPP.
GBP recently stands flat as attention of investors mostly was on Deutsche Bank scandal and EUR. We do not expect any strong action on GBP, at least to upside. Retracement even to MPP will not change medium-term bearish scenario:

Conclusion:
Currently we do not want to look too far in the future. Yes, market shows strong bearish action, especially on very long-term charts, drops down indeed look miserable, and from that standpoint GBP could reach even 1.06 target, but right now we're mostly interested in tactical weekly/daily setup.
Last 3 weeks GBP looks heavy no signs of upward bounce and even has shown clear signs of weakness on daily chart. Thus, we should be ready for downward breakout and completion of our nearest downside target around 1.2450 area. Meantime, it seems that GBP is loosing shor-term downward steam either, which could lead to minor upside retracement in the beginning of the week. Mostly our view stands the same here as last week was inside one and hasn't brought anything really new to overall picture.
The technical portion of Sive's analysis owes a great deal to Joe DiNapoli's methods, and uses a number of Joe's proprietary indicators. Please note that Sive's analysis is his own view of the market and is not endorsed by Joe DiNapoli or any related companies.
(Reuters) Sterling edged up on Friday but was on track for a fifth consecutive quarter of losses against the dollar - the currency's worst run since 1984.
The pound plunged to a 31-year low after Britain voted to leave the European Union, falling as low as $1.28 early in the third quarter, having already weakened in the run-up to the June referendum on worries about its outcome.
Sterling is now trading more than 40 U.S. cents - or 25 percent - lower than the six-year highs it reached in mid-2014, with uncertainty over Brexit and a drying-up of expectations for the Bank of England having weighed.
Last month the BoE cut its key interest rate to another record low and relaunched an asset-purchase programme in an effort to cushion the blow dealt by the referendum outcome, and some expect it to ease policy again before the end of the year.
Data showing Britain's giant services sector grew much more strongly than expected in July, in the clearest sign to date that the economy did not slow sharply after the shock of the referendum, lifted sterling only briefly, and by 1500 it flat on the day below $1.30.
After a media report said an agreement between Deutsche Bank and U.S. authorities was being discussed - which would slash huge fines over alleged misselling - sterling jumped to a day's high of $1.3024. But it was still down 1 percent for the month, and more than 2 percent down over the quarter.
"From where we're sitting today, sterling remains a pretty vulnerable currency," said Rabobank currency strategist Jane Foley. "There does seem to be an appetite now to sell into rallies, and I think that does highlight the market's sensitivity to the political uncertainty the UK faces."
"We're all very much aware of the fact that Brexit hasn't begun yet. All we've had in the referendum, and we've still got to do all the hard work," she added.
A survey published earlier on Friday showed British consumer morale rocketed back to pre-Brexit levels in September, confounding expectations that the vote to leave the EU would wreak more lasting damage on Britons' willingness to spend.
"The good news is that from the perspective of UK consumers, the Brexit shock has been fleeting," wrote Bank of Tokyo-Mitsubishi UFJ currency strategist Derek Halpenny.
Against the euro, sterling edged up 0.1 percent to 86.42 pence, but for the quarter was down more than 3 percent against the single currency.
Next week, manufacturing and production data should provide indicators of the health of the British economy.
Fathom consulting has taken snapshot on UK consumer confidence:
UK consumer remains resilient, but for how long?
UK consumers have largely shrugged off the EU referendum result, with data released today revealing that the headline GfK Consumer Confidence Index rebounded in September to levels last seen before the UK's Brexit vote in June.
Service sector data for July, also released today, were far stronger than expected, with output rising by 0.4% between the months of June and July.
Overall, today's data are consistent with positive GDP growth in the third quarter, meaning that the UK will avoid recession this year - in line with our forecast.
But looking ahead, the increased probability of a 'Hard Brexit' is likely to continue to weigh on business investment, with the anticipated triggering of Article 50 early next year a key pressure point.
COT Data
Last week CFTC numbers shows clear bearish picture. Speculative net-short position has increased significantly. Although increasing itself was mostly due closing of longs, but open interest also has increased slightly, thus it means that some new shorts also have been taken. This situation mostly supports our previous view on GBP perspectives:
Technicals
Monthly
Right now monthly trend is bearish, but market is not at oversold on monthly chart. We've said that lows will not survive because market has all-time 0.618 AB=CD target below them, so that has happened. Market has dropped and right now stands there, no W&R.
Overall picture looks bearish by some signs. First is - acceleration down to AB-CD target. Usually fast drop on this point tells that market has chances to continue to AB=CD target, which stands at 1.06 area. Currently it seems too brave suggestion, but at least some minor continuation down is very probable.
The point is if you will take a look at all-time GBP chart, you'll see that market already has broken major 5/8 Fib support and on a way down, drop is really fast since first leg was on 2008 crisis. Overall fundamental situation is mostly supportive to this scenario, besides, 20 points is not really big distance to GBP that is more volatile than many other major currencies:
That's why technically there is nothing impossible with 1.06 area. - that will be AB=CD on a way down.
Second stands for shorter-term perspective. GBP has dropped below YPS1 and this indicates starting of new bearish trend, not just a retracement down, but trend.
Swings right now are so large, that monthly chart let's us talk on very long-term perspective and does not bring any clarity on shorter-term perspective.
So, as no bounce has happened yet, in short-term perspective market could try to reach another AB-CD 0.618 traget. Initially we were focused on AB-CD pattern with 1.3080 target since it was more probable. As GBP has hit it already but shows no reaction, it could mean that A'B-CD target around 1.2450 area also could be hit, if we adjust our initial "A" point and shift it to "A' " as it is shown on the chart.
Last two months GBP stands rather tight. This is also looks bearish. As GBP has reached minor AB-CD target @ 1.3080 area, it should show at least some minor bounce, but price wasn't able to do this. That's why downside continuation is very probable here:
Weekly
Today we will not talk again on our VOB pattern. It's still valid, but market has not shown upside bounce fast, so, we will keep an eye on it, but our trade based on VOB is postponed a bit, probably. Or may be market needs to complete some closer targets before VOB pattern will start to work... Anyway...
Last week's range was rather tight. So it has made no impact on overall picture and patterns that we've discussed last week mostly stand the same.
On weekly chart we have triangle consolidation that could shift to butterfly "Buy" pattern. As our monthly target stands around 1.2450 - it could be reached by butterfly pattern.
Also, we have bearish evening star candlestick shape, and take a look - some kind of bearish dynamic pressure, as trend has turned bullish while price action is not:
Daily
Last week guys, even on daily chart action was very quiet. Take a look, whole week action was mostly inside one to Friday's drop two weeks ago.
Our idea here mostly stands the same and is based on triangle. As we've estimated last week this triangle has solid chances to shift into butterfly. Take a look at our initial triangle and setup that we've discussed 3-weeks ago - "222" Buy" pattern, remember?
In general this setup has worked well, but market has not quite reached AB=CD upside target and turned down too early. This indicates GBP weakness. Also, CD leg was two times longer than AB. So, inability of the market to complete target is a bearish sign.
Now take a look how market fluctuates around trend line of triangle, on our "222" setup it was broken up, on a way back price has tested it tried to move up but failed and returned back inside triangle. And then most important thing has happened - GBP has re-tested the same line but from the opposite direction and stays inside the triangle. Total combination of upside triangle breakout and inability to continue move up or at
least to hold above triangle is a bearish sign. And it means that downward breakout is just a question of time. Trend is bearish on daily chart:
4-hour
Last week we have seen another testing of triangle trend line and downward pullback. Currently GBP shows very weak reaction on any GBP supportive data. Cable shows even less volatility than EUR last week. Right now market has no significant support, just lower border of triangle.
On Friday bearish grabber has been formed which suggests appearing of butterfly pattern and reaching one of its targets. Still, overall action mostly stands sideways, doesn't show any significant thrust, MACD shows strong bullish divergence that could lead to upside retracement to WPR1 or even testing of October MPP.
GBP recently stands flat as attention of investors mostly was on Deutsche Bank scandal and EUR. We do not expect any strong action on GBP, at least to upside. Retracement even to MPP will not change medium-term bearish scenario:
Conclusion:
Currently we do not want to look too far in the future. Yes, market shows strong bearish action, especially on very long-term charts, drops down indeed look miserable, and from that standpoint GBP could reach even 1.06 target, but right now we're mostly interested in tactical weekly/daily setup.
Last 3 weeks GBP looks heavy no signs of upward bounce and even has shown clear signs of weakness on daily chart. Thus, we should be ready for downward breakout and completion of our nearest downside target around 1.2450 area. Meantime, it seems that GBP is loosing shor-term downward steam either, which could lead to minor upside retracement in the beginning of the week. Mostly our view stands the same here as last week was inside one and hasn't brought anything really new to overall picture.
The technical portion of Sive's analysis owes a great deal to Joe DiNapoli's methods, and uses a number of Joe's proprietary indicators. Please note that Sive's analysis is his own view of the market and is not endorsed by Joe DiNapoli or any related companies.