Sive Morten
Special Consultant to the FPA
- Messages
- 18,690
Fundamentals
Data showing a seventh straight monthly decline in U.S. business spending plans knocked the dollar lower on Friday and gave Federal Reserve policymakers even less reason to raise near-zero interest rates any time soon.
The euro backed away from a two-week high against the dollar after euro zone finance ministers told Greece it will get no more aid until it strikes a full economic reform plan.
U.S. non-defense capital goods orders excluding aircraft, a proxy for business spending activity, declined 0.5 percent last month after a revised 2.2 percent drop in February, the U.S. Commerce Department said. Economists had forecast core capital goods orders gaining 0.3 percent in March, according to a Reuters poll.
Friday's durable goods report followed lukewarm data on U.S. retail sales, employment and housing starts, which suggest soggy growth that could cause Fed policymakers to delay raising rates for the first time in nearly a decade until later this year.
"This puts more concern on the performance of the U.S. economy and adds to the pressure the dollar has experienced over the last month," said Sireen Haraji, currency strategist at Mizuho in New York. "Markets are concerned that this might postpone the Fed normalizing policy."
Yields on U.S. Treasury debt rose after the durable goods report.
Against the yen, the dollar was off 0.60 percent at 118.87 yen .
Sterling was up 0.75 percent to $1.5172 after touching a five-week high against the dollar, despite assumptions that uncertainty ahead of next month's UK general election is a mounting risk for the pound.
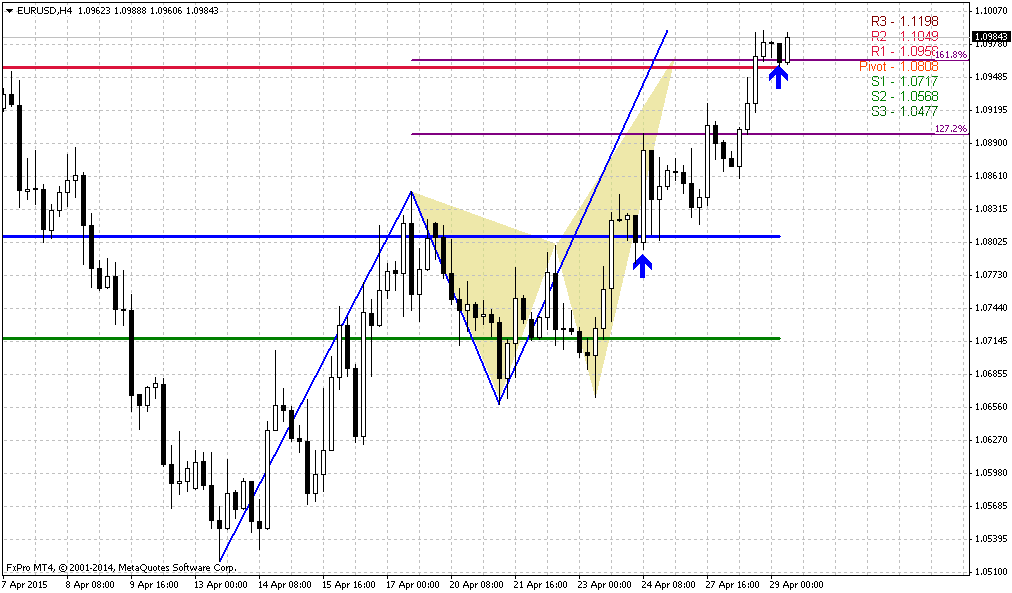
The euro was last up 0.40 percent against the dollar at $1.0866, after touching a two-week high of $1.09, as lingering hopes that cash-strapped Greece was making progress toward securing fresh funding were dashed.
Jeroen Dijsselbloem, chairman of the euro zone finance ministers, said Greece still needs to deliver a list of reforms to receive funding, adding Athens needs to work faster and euro zone ministers will take stock of progress at the next meeting on May 11 in Brussels.
Similarly, EU Economics Commissioner Pierre Moscovici said that despite some progress in talks with Athens, a deal was still far off.
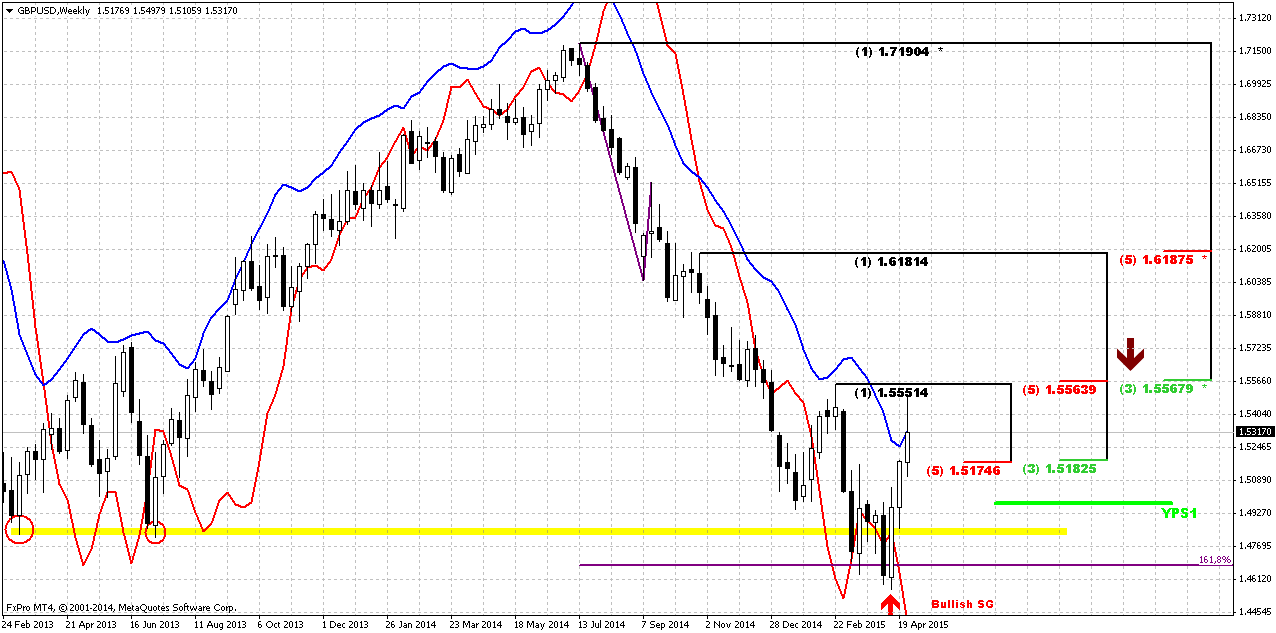
As we’ve talked a lot about EUR last week, today we will take a look at GBP again. On previous weekly research we’ve said that in short-term perspective GBP could show opposite action and move not in normal relation with other European currencies. Now we see this. First stage of our trading plan has been completed – GBP has reached solid weekly resistance area around 1.5150. Currently is really hot period in UK, since it is just couple of weeks till voting day.
CFTC recent data right now clearer and clearer shows the tendency. Open interest is contracting with simultaneous flat speculative long position and contracting short one. It gives us very important information. First is, it confirms that current upside action is just a retracement, but not new trend yet. And this upside action is driven mostly by closing of the shorts but not new inflows from investors. Here we could meet the same situation as on gold last month. Recall that jump from the moment of superb last NFP data was driven by closing of shorts. But right now – when no more shorts rest for closing – gold is returning back to downward action. Something of this sort we could see on GBP, if sentiment balance will not change.
Open interest:
 Shorts:
 Longs:

Technicals
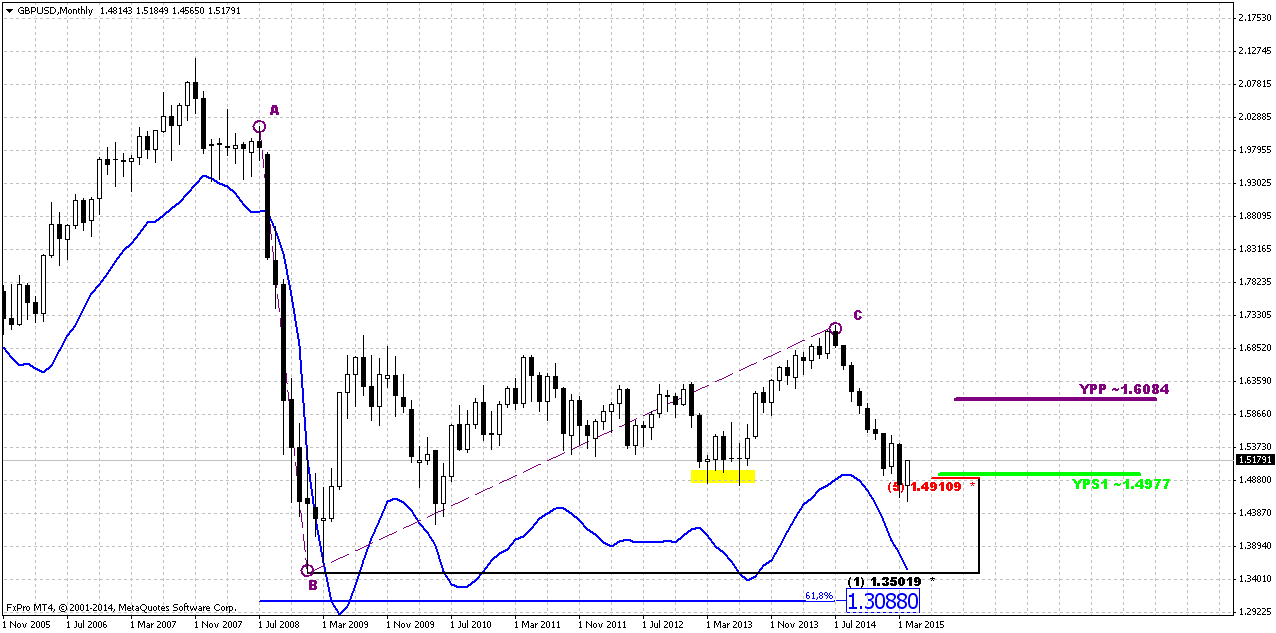
Monthly
Since it is still valid – I would like to keep showing you monthly chart and analysis that we’ve made in December 2013 in our Forex Military School Course, where we were learning Elliot Waves technique.
https://www.forexpeacearmy.com/forex-forum/forex-military-school-complete-forex-education-pro-banker/30110-chapter-16-part-v-trading-elliot-waves-page-7-a.html
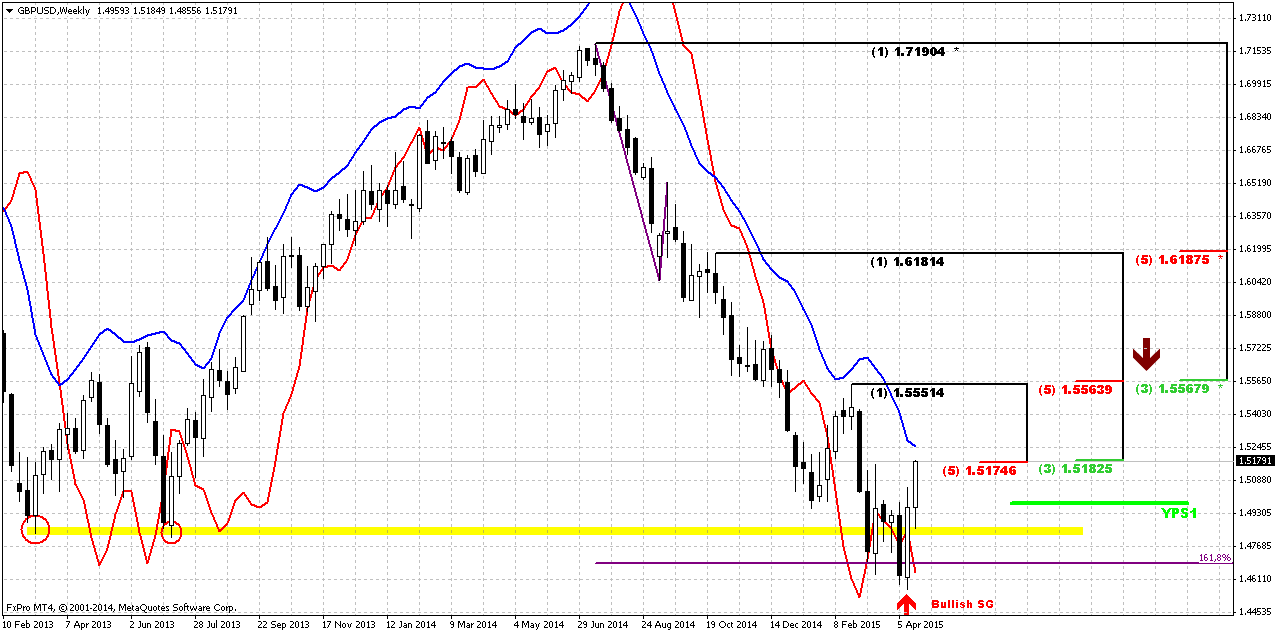
Our long term analysis suggests first appearing of new high on 4th wave at ~1.76 level and then starting of last 5th wave down. First condition was accomplished and we’ve got new high, but it was a bit lower – not 1.76 but 1.72. This was and is all time support/resistance area. Now we stand in final part of our journey. According to our 2013 analysis market should reach lows at 1.35 area. Let’s see what additional information we have right now.
Trend is bearish here, but GBP is not at oversold. Approximately month ago market has reached strong support area – Yearly Pivot support 1 and 5/8 major monthly Fib level. As we’ve mentioned on our previous research – “although market right now stands ~200 pips below this level, it seems that it has not been broken totally yet” and now market confirms this thought. Market gradually struggling through YPS1 but it seems that first attempt to pass through it has failed. It means that we could meet meaningful pullback in nearest future. Although in long term it will not mean the capitulation of the bears. This will be probably just temporal pullback, respect of support and correction after unsuccessful attempt to pass through support right on first challenge.
New information here is downward thrust. Occasionally I’ve counted the number of bars there, and guys, it has 8 black candles. Theoretically this thrust is suitable for B&B “Sell” pattern. We do not mention DRPO, since we come to conclusion that current upside action is retracement and it can’t lead to appearing of DRPO on monthly chart. I’m not sure about B&B, it looks a bit shy on overall picture, but this pattern is definitely the one that we should monitor.
In fact here we have just one major downward destination point. Monthly chart give us just single AB-CD pattern with nearest target at 0.618 extension – 1.3088. Still, here we have another one non-Fib orienteer – lower border of current consolidation. If we will treat it as sideways action then lower border will stand ~1.42-1.43 area. But first we need to get over current support level and see what market could give us here. Currently 1.30-1.31 area looks unbelievable, but if we would suggest parity on EUR/USD and starting rate hiking cycle in US – why not? Still, this is very long-term picture and right now we’re mostly interested in reaction of the market on current support level.
Weekly
Weekly chart is a centre of bullish sentiment. Last week we’ve said that action in recent two weeks we could treat as 2-period bullish grabber. DiNapoli does not have this name in his arsenal, but may experience tells that when market shifts trend and on the next period restores it back – it works as simple grabber in most cases. It means that theoretically market could exceed 1.5550 top. We will keep in mind this level.
It is interesting that if we apply here the thought about possible B&B “Sell” on monthly chart – this will the same area where it should be formed. In fact, as we can see 1.5550 is also weekly K-resistance area. I will not be surprised if there will be weekly overbought as well, if market will keep current upside pace. So, this level will be the next destination point, i.e. target in our trading plan.
Meantime we remind you on closer targets that were in focus last week. As 2-candles grabber action also is pretty bullish engulfing pattern and W&R of previous lows – our target has been completed. Market has reached first K-resistance and overbought. It means that although we still expect reaching of 1.5550 but on coming week chances on pullback increases.
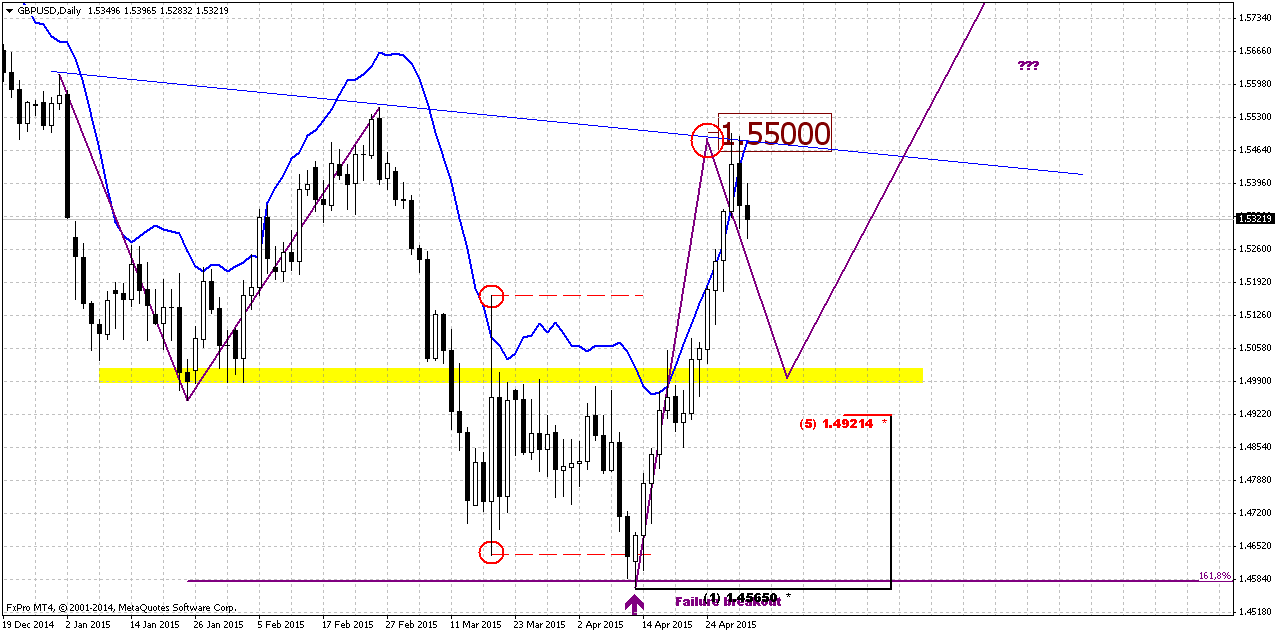
Daily
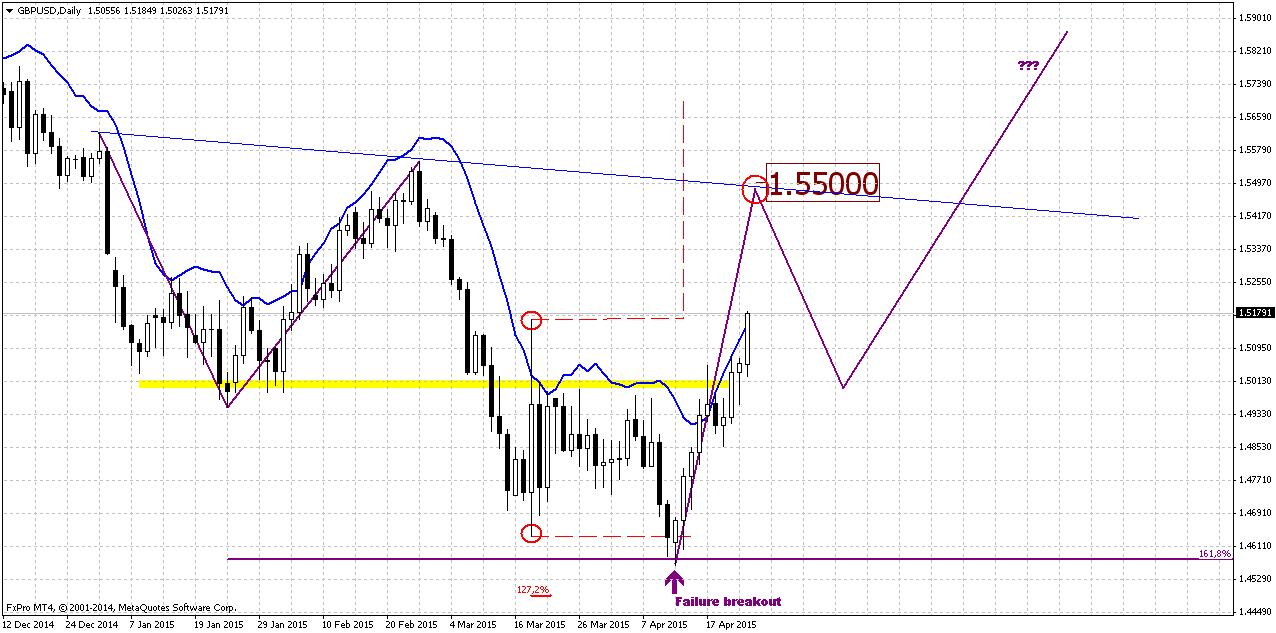
Daily chart is very important right now. Trend is bullish here. Last week we’ve discussed failure breakout of long-ranged candle and suggested that market should move to opposite side and take an attempt of upward breakout. This has happened. But the problem here is that market stands also at K-resistance on weekly and daily overbought. In such circumstances it is very difficult to immediate breakout. This lets us to create another point in our trading plan on next week – expecting retracement.
Also we’ve mentioned reverse H&S pattern here. Take a look, this is really amazing – neckline stands right around 1.55-1.5550 area – right at weekly K-resistance where B&B “Sell” could start. Second thrilling agreement is the right shoulder. Will it become B&B “Sell” result? Because we know that minimum B&B target is 5/8 Fib support from upside action. Since we have 1.618 H&S pattern, 5/8 level will be precisely at the bottom of right shoulder.
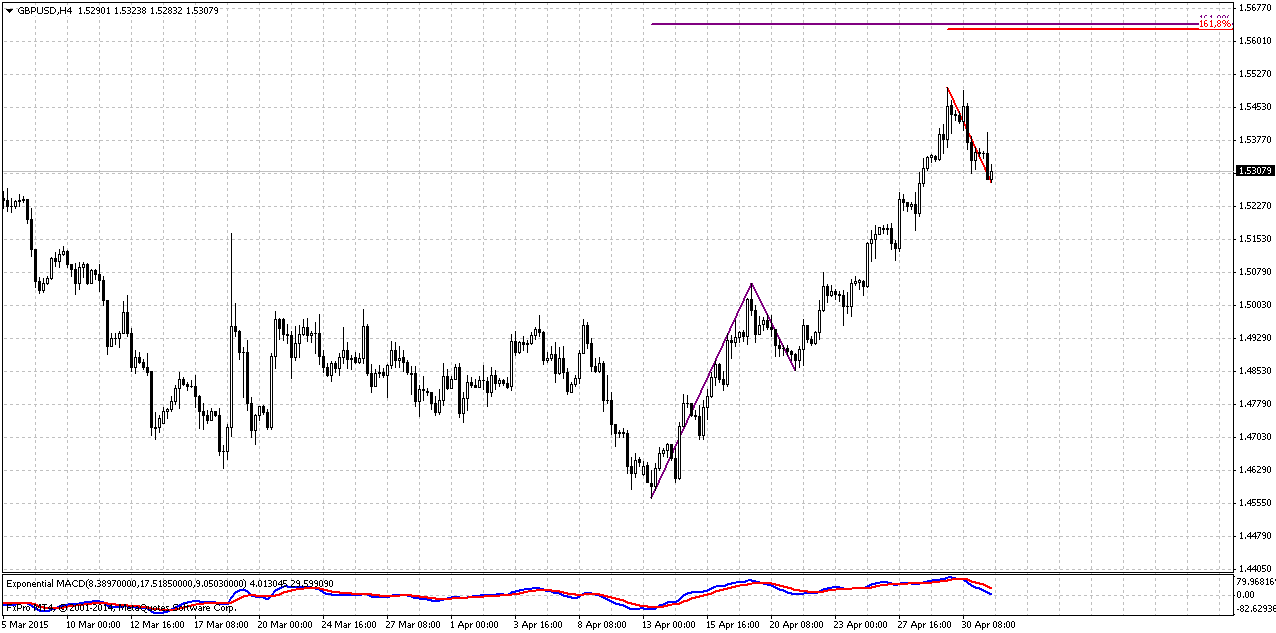
4-Hour
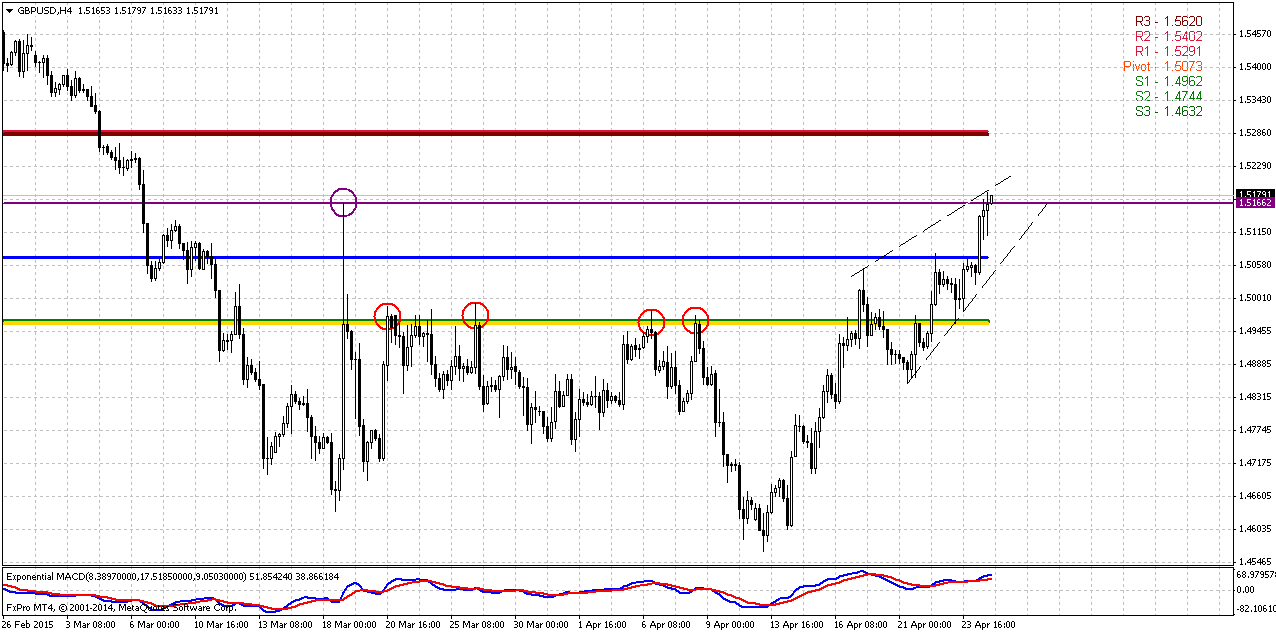
This chart lets us to estimate most probable retracement target. I do not have Fib levels here, guys, but taking into consideration that cable is overbought as on weekly as on daily chart, retracement should be meaningful. Also, it is difficult to count on immediate breakout through the top of long-ranged candle. Odds suggest pullback down. On coming week MPP and WPS1 are coincide around 1.4950 area. This is also long-term consolidation and natural support. It seems that this is most probable retracement target.
Deeper retracement theoretically is possible and it will not break our analysis, but taking into consideration explosive upside action on daily chart, when GBP just moves up along with overbought line, hardly we could count on unnecessary “additional” depth of retracement. Here we also could recognize technical signs of tiredness of the market – wedge and MACD divergence. It makes sense since GBP at strong weekly resistance.
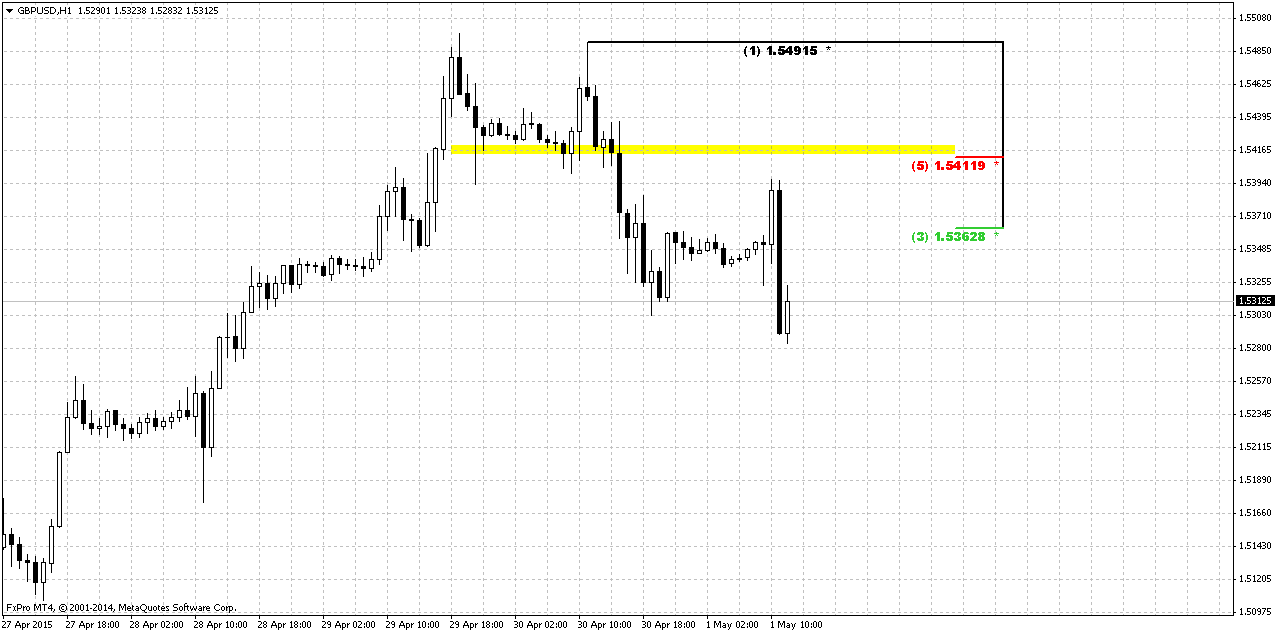
1-Hour
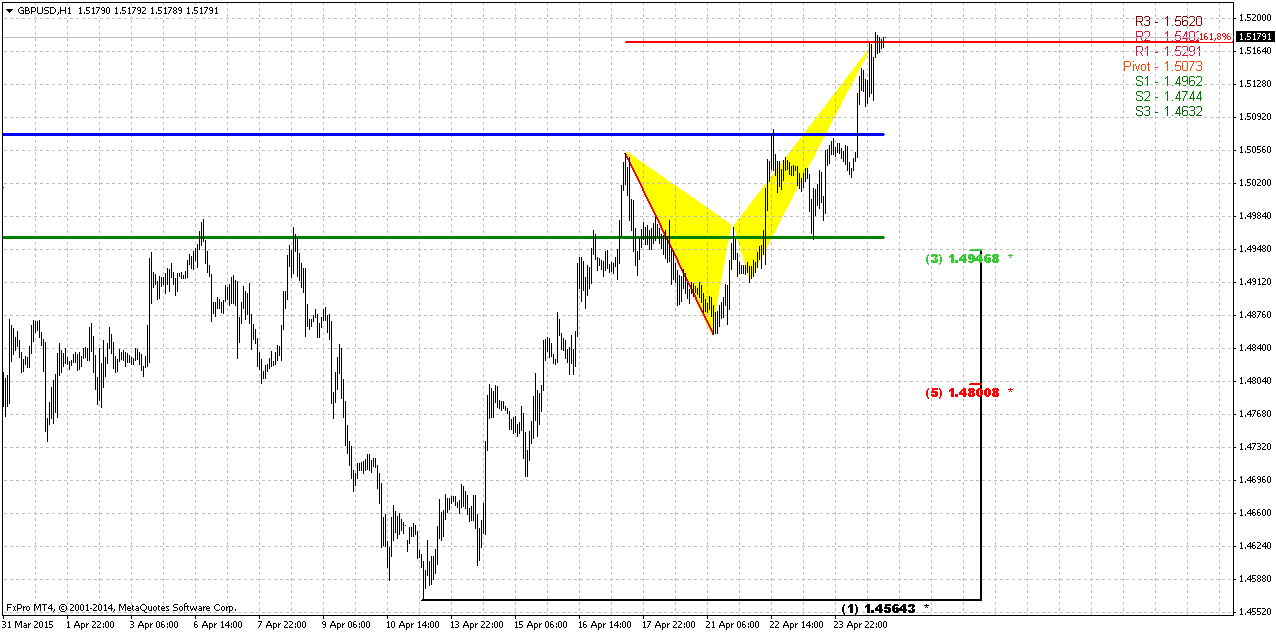
Hourly chart also shows that we have butterfly “Sell” in place and WPS1 coincides with 3/8 Fib support level. Retracement to 1.48 is possible, but seems not very probable due the pace of upside action on daily chart.
Conclusion:
Long term picture tells that also current upside action mostly is retracement, since it is driven by closing of short positions but not new inflows on GBP. Still, it seems that upside action still has chance to continue and next long-term destination point is 1.5550. Long term charts show potential for multiple patterns that could start to follow one after another – B&B “Sell”, reverse H&S, etc… From that standpoint Cable looks very interesting compares to other currencies.
Meantime, market is overbought on shorter-term scale and stands at strong weekly resistance. In beginning of the week we will monitor possible retracement to 1.4950 area first.
The technical portion of Sive's analysis owes a great deal to Joe DiNapoli's methods, and uses a number of Joe's proprietary indicators. Please note that Sive's analysis is his own view of the market and is not endorsed by Joe DiNapoli or any related companies.
Data showing a seventh straight monthly decline in U.S. business spending plans knocked the dollar lower on Friday and gave Federal Reserve policymakers even less reason to raise near-zero interest rates any time soon.
The euro backed away from a two-week high against the dollar after euro zone finance ministers told Greece it will get no more aid until it strikes a full economic reform plan.
U.S. non-defense capital goods orders excluding aircraft, a proxy for business spending activity, declined 0.5 percent last month after a revised 2.2 percent drop in February, the U.S. Commerce Department said. Economists had forecast core capital goods orders gaining 0.3 percent in March, according to a Reuters poll.
Friday's durable goods report followed lukewarm data on U.S. retail sales, employment and housing starts, which suggest soggy growth that could cause Fed policymakers to delay raising rates for the first time in nearly a decade until later this year.
"This puts more concern on the performance of the U.S. economy and adds to the pressure the dollar has experienced over the last month," said Sireen Haraji, currency strategist at Mizuho in New York. "Markets are concerned that this might postpone the Fed normalizing policy."
Yields on U.S. Treasury debt rose after the durable goods report.
Against the yen, the dollar was off 0.60 percent at 118.87 yen .
Sterling was up 0.75 percent to $1.5172 after touching a five-week high against the dollar, despite assumptions that uncertainty ahead of next month's UK general election is a mounting risk for the pound.
The euro was last up 0.40 percent against the dollar at $1.0866, after touching a two-week high of $1.09, as lingering hopes that cash-strapped Greece was making progress toward securing fresh funding were dashed.
Jeroen Dijsselbloem, chairman of the euro zone finance ministers, said Greece still needs to deliver a list of reforms to receive funding, adding Athens needs to work faster and euro zone ministers will take stock of progress at the next meeting on May 11 in Brussels.
Similarly, EU Economics Commissioner Pierre Moscovici said that despite some progress in talks with Athens, a deal was still far off.
As we’ve talked a lot about EUR last week, today we will take a look at GBP again. On previous weekly research we’ve said that in short-term perspective GBP could show opposite action and move not in normal relation with other European currencies. Now we see this. First stage of our trading plan has been completed – GBP has reached solid weekly resistance area around 1.5150. Currently is really hot period in UK, since it is just couple of weeks till voting day.
CFTC recent data right now clearer and clearer shows the tendency. Open interest is contracting with simultaneous flat speculative long position and contracting short one. It gives us very important information. First is, it confirms that current upside action is just a retracement, but not new trend yet. And this upside action is driven mostly by closing of the shorts but not new inflows from investors. Here we could meet the same situation as on gold last month. Recall that jump from the moment of superb last NFP data was driven by closing of shorts. But right now – when no more shorts rest for closing – gold is returning back to downward action. Something of this sort we could see on GBP, if sentiment balance will not change.
Open interest:
Technicals
Monthly
Since it is still valid – I would like to keep showing you monthly chart and analysis that we’ve made in December 2013 in our Forex Military School Course, where we were learning Elliot Waves technique.
https://www.forexpeacearmy.com/forex-forum/forex-military-school-complete-forex-education-pro-banker/30110-chapter-16-part-v-trading-elliot-waves-page-7-a.html
Our long term analysis suggests first appearing of new high on 4th wave at ~1.76 level and then starting of last 5th wave down. First condition was accomplished and we’ve got new high, but it was a bit lower – not 1.76 but 1.72. This was and is all time support/resistance area. Now we stand in final part of our journey. According to our 2013 analysis market should reach lows at 1.35 area. Let’s see what additional information we have right now.
Trend is bearish here, but GBP is not at oversold. Approximately month ago market has reached strong support area – Yearly Pivot support 1 and 5/8 major monthly Fib level. As we’ve mentioned on our previous research – “although market right now stands ~200 pips below this level, it seems that it has not been broken totally yet” and now market confirms this thought. Market gradually struggling through YPS1 but it seems that first attempt to pass through it has failed. It means that we could meet meaningful pullback in nearest future. Although in long term it will not mean the capitulation of the bears. This will be probably just temporal pullback, respect of support and correction after unsuccessful attempt to pass through support right on first challenge.
New information here is downward thrust. Occasionally I’ve counted the number of bars there, and guys, it has 8 black candles. Theoretically this thrust is suitable for B&B “Sell” pattern. We do not mention DRPO, since we come to conclusion that current upside action is retracement and it can’t lead to appearing of DRPO on monthly chart. I’m not sure about B&B, it looks a bit shy on overall picture, but this pattern is definitely the one that we should monitor.
In fact here we have just one major downward destination point. Monthly chart give us just single AB-CD pattern with nearest target at 0.618 extension – 1.3088. Still, here we have another one non-Fib orienteer – lower border of current consolidation. If we will treat it as sideways action then lower border will stand ~1.42-1.43 area. But first we need to get over current support level and see what market could give us here. Currently 1.30-1.31 area looks unbelievable, but if we would suggest parity on EUR/USD and starting rate hiking cycle in US – why not? Still, this is very long-term picture and right now we’re mostly interested in reaction of the market on current support level.
Weekly
Weekly chart is a centre of bullish sentiment. Last week we’ve said that action in recent two weeks we could treat as 2-period bullish grabber. DiNapoli does not have this name in his arsenal, but may experience tells that when market shifts trend and on the next period restores it back – it works as simple grabber in most cases. It means that theoretically market could exceed 1.5550 top. We will keep in mind this level.
It is interesting that if we apply here the thought about possible B&B “Sell” on monthly chart – this will the same area where it should be formed. In fact, as we can see 1.5550 is also weekly K-resistance area. I will not be surprised if there will be weekly overbought as well, if market will keep current upside pace. So, this level will be the next destination point, i.e. target in our trading plan.
Meantime we remind you on closer targets that were in focus last week. As 2-candles grabber action also is pretty bullish engulfing pattern and W&R of previous lows – our target has been completed. Market has reached first K-resistance and overbought. It means that although we still expect reaching of 1.5550 but on coming week chances on pullback increases.
Daily
Daily chart is very important right now. Trend is bullish here. Last week we’ve discussed failure breakout of long-ranged candle and suggested that market should move to opposite side and take an attempt of upward breakout. This has happened. But the problem here is that market stands also at K-resistance on weekly and daily overbought. In such circumstances it is very difficult to immediate breakout. This lets us to create another point in our trading plan on next week – expecting retracement.
Also we’ve mentioned reverse H&S pattern here. Take a look, this is really amazing – neckline stands right around 1.55-1.5550 area – right at weekly K-resistance where B&B “Sell” could start. Second thrilling agreement is the right shoulder. Will it become B&B “Sell” result? Because we know that minimum B&B target is 5/8 Fib support from upside action. Since we have 1.618 H&S pattern, 5/8 level will be precisely at the bottom of right shoulder.
4-Hour
This chart lets us to estimate most probable retracement target. I do not have Fib levels here, guys, but taking into consideration that cable is overbought as on weekly as on daily chart, retracement should be meaningful. Also, it is difficult to count on immediate breakout through the top of long-ranged candle. Odds suggest pullback down. On coming week MPP and WPS1 are coincide around 1.4950 area. This is also long-term consolidation and natural support. It seems that this is most probable retracement target.
Deeper retracement theoretically is possible and it will not break our analysis, but taking into consideration explosive upside action on daily chart, when GBP just moves up along with overbought line, hardly we could count on unnecessary “additional” depth of retracement. Here we also could recognize technical signs of tiredness of the market – wedge and MACD divergence. It makes sense since GBP at strong weekly resistance.
1-Hour
Hourly chart also shows that we have butterfly “Sell” in place and WPS1 coincides with 3/8 Fib support level. Retracement to 1.48 is possible, but seems not very probable due the pace of upside action on daily chart.
Conclusion:
Long term picture tells that also current upside action mostly is retracement, since it is driven by closing of short positions but not new inflows on GBP. Still, it seems that upside action still has chance to continue and next long-term destination point is 1.5550. Long term charts show potential for multiple patterns that could start to follow one after another – B&B “Sell”, reverse H&S, etc… From that standpoint Cable looks very interesting compares to other currencies.
Meantime, market is overbought on shorter-term scale and stands at strong weekly resistance. In beginning of the week we will monitor possible retracement to 1.4950 area first.
The technical portion of Sive's analysis owes a great deal to Joe DiNapoli's methods, and uses a number of Joe's proprietary indicators. Please note that Sive's analysis is his own view of the market and is not endorsed by Joe DiNapoli or any related companies.