Sive Morten
Special Consultant to the FPA
- Messages
- 18,673
Fundamentals
The major event that was in our focus this week has happened, we've got GDP numbers. The GDP is a combination of other data that was released through 1st quarter and combined personal consumption, sales, and others. Our suggestion on positive surprise was correct and even we couldn't expect so strong surprise - numbers of 3.2%.
Mixed reaction on data was due weak inflation component of GDP price index as it was two times below expectation. But, 0.6% on QoQ basis suggests that inflation is 2.4% on annual basis which is not actually bad.
Major Fed indicator Core PCE shows 1.3% inflation which is below expectation. Inflation data was a reason of muted effect on markets on overall strong GDP numbers.
Let's see how investors treat GDP results.
As Reuters reports, the dollar fell against a basket of other currencies on Friday, after an overall strong U.S. first-quarter growth report was overshadowed by soft inflation data.
Gross domestic product increased at a 3.2 percent annualized rate in the quarter, the Commerce Department said in its advance GDP report, released on Friday, versus the 2.0 percent estimated by economists polled by Reuters.
The dollar, however, did not enjoy a boost from the report as traders focused on the core personal expenditures consumption price index figure, the Federal Reserve’s preferred inflation gauge, which increased at only a 1.3% rate versus 1.8% in the prior quarter.
“Overall, U.S. growth last quarter was outstanding. But the soft inflation components were enough to spur some profit-taking in the buck’s winning week,” said Joe Manimbo, senior market analyst at Western Union Business Solutions in Washington.
While, the forecast-beating headline numbers defied the notion that the U.S. economy is slowing as fiscal stimulus fades, the underlying numbers offered plenty of causes for concern, Paul Ashworth, chief U.S. economist at Capital Economics, said in a note.
“Taking out the over-sized boosts from net trade, inventories and highways investment, which will all be reversed in the coming quarters, growth was only around 1.0%,” Ashworth said.
“Under those circumstances, we continue to expect that overall growth will slow this year, forcing the Fed to begin cutting interest rates before year-end,” he said.
The Fed recently suspended its three-year monetary policy tightening campaign, dropping forecasts for any interest rate hikes this year.
Recent U.S. data has been robust and has reinforced the belief that the United States is on a firmer economic footing than other leading economies.
“Once the dust settles, the focus should shift back to the bullish U.S. growth theme which has been resoundingly positive for the dollar,” said Manimbo.
“There were plenty of positive headlines for the U.S. economy this week, with GDP growth accelerating in the first quarter, durable goods orders surging in March, and the S&P 500 hitting a record high,” Michael Pearce, senior U.S. economist at Capital Economics, said in a note.
“But signs of underlying weakness abound which, together with the renewed softness of core inflation, will keep the Fed sounding extremely dovish next week,” said Pearce.
The Fed, set to meet for two days next week, recently suspended its three-year monetary policy tightening campaign, dropping forecasts for any interest rate hikes this year.
And here is what investors told at the eve of GDP release, on Thursday:
After the euro’s slide to 22-month lows against the dollar, investors are scrambling to shield themselves from more weakness as Europe’s poor data contrasts with an upbeat U.S. economy that is sending the dollar surging.
Options markets suggest investors this week bought sizeable downside protection against further euro weakness against the dollar, after the single currency broke below its 2019 low of $1.1177, a level that has opened the door to more selling.
“We have been increasingly doubtful that the euro can hold,” said Neil Mellor, currencies analyst at BNY Mellon. “Growth forecasts have been slumping and the ECB (European Central Bank) might have to revise its expectations again.”
This week’s fall — more than 1 percent so far — follows a period of calm during which euro/dollar, the world’s most traded currency pair, has been stuck in its narrowest ever trading range. The tiny price fluctuations have frustrated investors keen on volatility and clear direction.
The Federal Reserve’s dovish shift at the start of 2019 would normally have hurt the dollar. But the Fed move was followed in March by the ECB’s decision to push back further planned interest rate rises.
Since then, euro zone business surveys have pointed to further gloom, with a widely-watched German business climate index showing deteriorating morale in April.
The U.S. economy, on the other hand, appears to be blooming; latest data showed new orders for U.S.-made capital goods increased by the most in eight months, while U.S. first-quarter growth could be as much as 2.4 percent, according to some estimates.
Until now, investors have had to pay relatively little to protect their portfolios against a euro downside, because currency volatility has been so low and few were buying options.
But that has changed - forex dealers said that a swathe of options were bought on Thursday giving holders the right to sell euros at $1.1000, including one for 500 million euros.
The market is already heavily long dollars, with speculative investors holding their biggest short position in euros since December 2016, CFTC data indicates.

source: cftc.gov
charting by Investing.com
One-month implied volatility - a gauge of expected price moves - has also jumped, after threatening to hit record lows only last week.
Euro/dollar volatility is likely to be boosted by the run-up to the May 23 European parliamentary elections, where populist parties could make a strong showing by tapping into anger about public expenditure cuts and income inequality.
Of course, not everyone believes the euro will spiral lower. Societe Generale analyst Kit Juckes, for instance, said the dollar - supported by an interest rate advantage of at least 70 basis points above its main economic competitors - was expensive, while the euro looked cheap.
“The risk, then, is that, having broken through the bottom of the recent euro-dollar range, all we do is add another coat of paint to the bottom of it, and settle into a marginally lower range,” he said.
But $1.10 is not unknown territory for the euro, which spent much of 2016 and 2017 below that level.
“It’s not really hard to rationalise,” said BNY Mellon’s Mellor. “The bad news is going to continue to mount from an (European) economic perspective.”
Finally, recall our last week report and important Fathom consulting article on this subject. Here I remind you some things.
The bigger picture is that while US GDP growth looks set to slow this year, we still think it will grow above potential, causing inflation to rise and prompting another increase in the fed funds rate in H2 this year. The NFIB survey of small businesses offers a window into the slower-growth-but-rising-inflationary-pressures dynamic: the number of firms expecting an improving economy has fallen significantly, while the number of firms that are finding it hard to fill one or more positions is close to its all-time high.
Thus, what conclusion could we make from all facts that we have right now. US economy is rising and the pace stands significantly above potential, at least on preliminary data. And definitely it stands above EU where major indicators show opposite direction and point on slow down.
Just to illustrate one of other multiple problems, take a look at Italian 10 year rate - it is rising, and indicates rising of default risk with 3rd largest EU economy:

If we would have better inflation data this time, reaction could be outstanding and EUR could appear at 1.10 even yesterday. Now, keep all other things constant we could say - the problem is with inflation only. Once it will rise, dollar should follow as well.
Fathom tells that flat inflation is temporal situation and it should rise in 2H of 2019. It is naive to suggest that Fed doesn't see this. Hence, Fed needs to prepare markets to policy change, closer to the end of 2019 and in nearest month everybody will look over two things. First is Fed statement on May 1st, that should be right around the corner, second - inflation data that will be released in May-June, as it could make impact on Fed rhetoric as next meeting stands at 19th of June.
IMO despite mixed reaction of the markets on GDP, it was mostly emotional and superficial. Investors need to sleep with recent data, scrutinize it and make final judgement. As we tell every time, only time shows what view is correct. Thus, if EUR will dump Friday's rally next week - we keep our bearish trading plan. We haven't got big drop on Friday, but overall background looks positive to USD and it means that downside action has all chances to continue but may be not as fast as it could if we would get stronger inflation numbers.
This week it was also important political statement from France President, E. Macron. By the way, do you remember guys, that somewhere in last year we've said that EU will be reformed and deadwood countries should be excluded. Average Europeans from core 14 countries especially Germany, France are tired from feeding rest of EU, refugees pour and to be a fool for pains?
In two words Macron calls for Schengen reform, agency to protect EU democracies. Previously we already saw France and German statements on creating of own military force instead of US "protection" (i.e. occupation). This rhetoric tells that there are strong political reforms stand inside the EU and these reforms touch the core, they are not surface.
Finally, take a look at two moments. First is CFTC data - we put the chart above. Take a look that despite so called "poor" inflation numbers EUR bearish positions increase. Second, read again what we've marked with color above concerning EUR options. Investors have bought huge bearish options positions with rights to sell at 1.10. This indirectly confirms our suggestion.
The vast majority of investors do not understand still what is going on as Fed rate expectations have not changed on a background of GDP data. We already ride with our trades 200 pips down this week on this "imperception". It is very interesting time ahead, mates.
Technicals
Monthly
Monthly was standing quiet for long time and every week we tell about two major scenarios that we keep an eye on. They are either downside breakout and start action to 1.08 and later to 1.03 or ability of the EUR to hold above 1.12 and turning up.
Now EUR shows very slow action and to say definitely that "yes" we're going lower we would like to get stronger action as 50 pips below major level doesn't mean yet on monthly chart that it is broken. Only fundamental background lets us to suggest that probably it does. But, we are where we are - market stands below major support, moving lower and deeper in wide rectangle area. MACD trend stands bearish, no oversold here. It lets us to focus on two targets. First is YPS1 at 1.09 and second one is AB-CD COP target around 1.03, i.e. previous lows and bottom of the rectangle.
In current circumstances it makes no sense to talk about bullish scenario.
As we said this many times previously - indirect technical factors point on market's weakness, at least in long-term perspectives. Our major long-term driving factors are - Brexit, deteriorating situation in EU economy and politics, its high reliance from US, Brexit and lack of preparedness to change in Fed policy. By our view these factors will make the game in nearest 1-2 years, or even longer.
Just by using of common sense, guys, in nowadays it is difficult to expect something positive as in global economy as in politics. Hence, any bad new triggers demand for safe haven assets and US dollar. Following simple logic odds stand in favor of downside trend rather than sharp upside reversal.
So, although on technical picture we see just light and indirect signs of EUR weakness, political background stands negative. This is the major reason why I do not believe in resurrection of bull trend on EUR in this year.

Weekly
Weekly chart doesn't show something important by far. The grabber that we've mentioned last week is completed. Although price stands below major support, but it is still very close to it. Price doesn't show "major" breakout yet, overall action is gradual and slow as price still stands inside wedge consolidation.
At the same time, weekly COP on dollar index has not been hit yet, which suggests some downside continuation here, on EUR, as well.

Daily
So, here, on daily, we've got high wave pattern instead of drop to 1.10-1.1050 as we've suggested. Pattern itself doesn't look perfect, we saw better looking HW patterns, but it has HW feature due the event that has happened - mixed GDP release, and it corresponds to the nature of this data as investors shows mixed reaction and different view on perspective of the EUR.
Although we have 1.10 target as well, but it seems that it should be correct to take it off the table by far. Our 1.11 target has not been reached just for 10 pips, at least by FX Pro pricing. It means that our focus will be on HW pattern, and we will keep an eye on its top and low. Depending on breakout direction we will appoint next targets. It will either upside retracement and target probably will stand around some Fib levels, such as 1.1240 K-resistance. Downside target are already estimated...
While market is coiling inside HW range it is nothing to do on daily chart. Our 1.11 trade mostly is over.

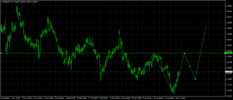
Intraday
Intraday setup will be interesting for scalp traders mostly. In fact, here we have H&S-shaped price action and 1.1130 will be the key. If you drop the time frame more, to 15-min chart (although 30 min is also OK) you'll see "222" Buy pattern is forming and downside XOP creates at Agreement with 5/8 Fib support area around 1.1130. This is potential area for long entry, if you're searching for upside trade here.
Upside target stands at 1.1210 and XOP stands around 1.1250 which agrees with daily K-resistance area.
Conversely, downside breakout of 1.1130 support area probably leads to drop below recent lows, and reaching of 1.11 target, but, its not the fact that market will continue dropping to 1.10. Fed meeting stands in 2 days, so, hardly we will get any strong action.

Conclusion:
We still think that recent GDP data gives good image of US economy. Despite that data was mixed and we haven't got big drop that we were counted on, this is temporal measure as data was good anyway. It means that we keep our long-term bearish view on EUR, although downside pace could be slow, at least until some new strong factor will appear.
On coming week we do not expect strong action and mostly will keep an eye on upside retracement.
The technical portion of Sive's analysis owes a great deal to Joe DiNapoli's methods, and uses a number of Joe's proprietary indicators. Please note that Sive's analysis is his own view of the market and is not endorsed by Joe DiNapoli or any related companies.
The major event that was in our focus this week has happened, we've got GDP numbers. The GDP is a combination of other data that was released through 1st quarter and combined personal consumption, sales, and others. Our suggestion on positive surprise was correct and even we couldn't expect so strong surprise - numbers of 3.2%.
Mixed reaction on data was due weak inflation component of GDP price index as it was two times below expectation. But, 0.6% on QoQ basis suggests that inflation is 2.4% on annual basis which is not actually bad.
Major Fed indicator Core PCE shows 1.3% inflation which is below expectation. Inflation data was a reason of muted effect on markets on overall strong GDP numbers.
Let's see how investors treat GDP results.
As Reuters reports, the dollar fell against a basket of other currencies on Friday, after an overall strong U.S. first-quarter growth report was overshadowed by soft inflation data.
Gross domestic product increased at a 3.2 percent annualized rate in the quarter, the Commerce Department said in its advance GDP report, released on Friday, versus the 2.0 percent estimated by economists polled by Reuters.
The dollar, however, did not enjoy a boost from the report as traders focused on the core personal expenditures consumption price index figure, the Federal Reserve’s preferred inflation gauge, which increased at only a 1.3% rate versus 1.8% in the prior quarter.
“Overall, U.S. growth last quarter was outstanding. But the soft inflation components were enough to spur some profit-taking in the buck’s winning week,” said Joe Manimbo, senior market analyst at Western Union Business Solutions in Washington.
While, the forecast-beating headline numbers defied the notion that the U.S. economy is slowing as fiscal stimulus fades, the underlying numbers offered plenty of causes for concern, Paul Ashworth, chief U.S. economist at Capital Economics, said in a note.
“Taking out the over-sized boosts from net trade, inventories and highways investment, which will all be reversed in the coming quarters, growth was only around 1.0%,” Ashworth said.
“Under those circumstances, we continue to expect that overall growth will slow this year, forcing the Fed to begin cutting interest rates before year-end,” he said.
The Fed recently suspended its three-year monetary policy tightening campaign, dropping forecasts for any interest rate hikes this year.
Recent U.S. data has been robust and has reinforced the belief that the United States is on a firmer economic footing than other leading economies.
“Once the dust settles, the focus should shift back to the bullish U.S. growth theme which has been resoundingly positive for the dollar,” said Manimbo.
“There were plenty of positive headlines for the U.S. economy this week, with GDP growth accelerating in the first quarter, durable goods orders surging in March, and the S&P 500 hitting a record high,” Michael Pearce, senior U.S. economist at Capital Economics, said in a note.
“But signs of underlying weakness abound which, together with the renewed softness of core inflation, will keep the Fed sounding extremely dovish next week,” said Pearce.
The Fed, set to meet for two days next week, recently suspended its three-year monetary policy tightening campaign, dropping forecasts for any interest rate hikes this year.
And here is what investors told at the eve of GDP release, on Thursday:
After the euro’s slide to 22-month lows against the dollar, investors are scrambling to shield themselves from more weakness as Europe’s poor data contrasts with an upbeat U.S. economy that is sending the dollar surging.
Options markets suggest investors this week bought sizeable downside protection against further euro weakness against the dollar, after the single currency broke below its 2019 low of $1.1177, a level that has opened the door to more selling.
“We have been increasingly doubtful that the euro can hold,” said Neil Mellor, currencies analyst at BNY Mellon. “Growth forecasts have been slumping and the ECB (European Central Bank) might have to revise its expectations again.”
This week’s fall — more than 1 percent so far — follows a period of calm during which euro/dollar, the world’s most traded currency pair, has been stuck in its narrowest ever trading range. The tiny price fluctuations have frustrated investors keen on volatility and clear direction.
The Federal Reserve’s dovish shift at the start of 2019 would normally have hurt the dollar. But the Fed move was followed in March by the ECB’s decision to push back further planned interest rate rises.
Since then, euro zone business surveys have pointed to further gloom, with a widely-watched German business climate index showing deteriorating morale in April.
The U.S. economy, on the other hand, appears to be blooming; latest data showed new orders for U.S.-made capital goods increased by the most in eight months, while U.S. first-quarter growth could be as much as 2.4 percent, according to some estimates.
Until now, investors have had to pay relatively little to protect their portfolios against a euro downside, because currency volatility has been so low and few were buying options.
But that has changed - forex dealers said that a swathe of options were bought on Thursday giving holders the right to sell euros at $1.1000, including one for 500 million euros.
The market is already heavily long dollars, with speculative investors holding their biggest short position in euros since December 2016, CFTC data indicates.
source: cftc.gov
charting by Investing.com
One-month implied volatility - a gauge of expected price moves - has also jumped, after threatening to hit record lows only last week.
Euro/dollar volatility is likely to be boosted by the run-up to the May 23 European parliamentary elections, where populist parties could make a strong showing by tapping into anger about public expenditure cuts and income inequality.
Of course, not everyone believes the euro will spiral lower. Societe Generale analyst Kit Juckes, for instance, said the dollar - supported by an interest rate advantage of at least 70 basis points above its main economic competitors - was expensive, while the euro looked cheap.
“The risk, then, is that, having broken through the bottom of the recent euro-dollar range, all we do is add another coat of paint to the bottom of it, and settle into a marginally lower range,” he said.
But $1.10 is not unknown territory for the euro, which spent much of 2016 and 2017 below that level.
“It’s not really hard to rationalise,” said BNY Mellon’s Mellor. “The bad news is going to continue to mount from an (European) economic perspective.”
Finally, recall our last week report and important Fathom consulting article on this subject. Here I remind you some things.
The bigger picture is that while US GDP growth looks set to slow this year, we still think it will grow above potential, causing inflation to rise and prompting another increase in the fed funds rate in H2 this year. The NFIB survey of small businesses offers a window into the slower-growth-but-rising-inflationary-pressures dynamic: the number of firms expecting an improving economy has fallen significantly, while the number of firms that are finding it hard to fill one or more positions is close to its all-time high.
Thus, what conclusion could we make from all facts that we have right now. US economy is rising and the pace stands significantly above potential, at least on preliminary data. And definitely it stands above EU where major indicators show opposite direction and point on slow down.
Just to illustrate one of other multiple problems, take a look at Italian 10 year rate - it is rising, and indicates rising of default risk with 3rd largest EU economy:
If we would have better inflation data this time, reaction could be outstanding and EUR could appear at 1.10 even yesterday. Now, keep all other things constant we could say - the problem is with inflation only. Once it will rise, dollar should follow as well.
Fathom tells that flat inflation is temporal situation and it should rise in 2H of 2019. It is naive to suggest that Fed doesn't see this. Hence, Fed needs to prepare markets to policy change, closer to the end of 2019 and in nearest month everybody will look over two things. First is Fed statement on May 1st, that should be right around the corner, second - inflation data that will be released in May-June, as it could make impact on Fed rhetoric as next meeting stands at 19th of June.
IMO despite mixed reaction of the markets on GDP, it was mostly emotional and superficial. Investors need to sleep with recent data, scrutinize it and make final judgement. As we tell every time, only time shows what view is correct. Thus, if EUR will dump Friday's rally next week - we keep our bearish trading plan. We haven't got big drop on Friday, but overall background looks positive to USD and it means that downside action has all chances to continue but may be not as fast as it could if we would get stronger inflation numbers.
This week it was also important political statement from France President, E. Macron. By the way, do you remember guys, that somewhere in last year we've said that EU will be reformed and deadwood countries should be excluded. Average Europeans from core 14 countries especially Germany, France are tired from feeding rest of EU, refugees pour and to be a fool for pains?
In two words Macron calls for Schengen reform, agency to protect EU democracies. Previously we already saw France and German statements on creating of own military force instead of US "protection" (i.e. occupation). This rhetoric tells that there are strong political reforms stand inside the EU and these reforms touch the core, they are not surface.
Finally, take a look at two moments. First is CFTC data - we put the chart above. Take a look that despite so called "poor" inflation numbers EUR bearish positions increase. Second, read again what we've marked with color above concerning EUR options. Investors have bought huge bearish options positions with rights to sell at 1.10. This indirectly confirms our suggestion.
The vast majority of investors do not understand still what is going on as Fed rate expectations have not changed on a background of GDP data. We already ride with our trades 200 pips down this week on this "imperception". It is very interesting time ahead, mates.
Technicals
Monthly
Monthly was standing quiet for long time and every week we tell about two major scenarios that we keep an eye on. They are either downside breakout and start action to 1.08 and later to 1.03 or ability of the EUR to hold above 1.12 and turning up.
Now EUR shows very slow action and to say definitely that "yes" we're going lower we would like to get stronger action as 50 pips below major level doesn't mean yet on monthly chart that it is broken. Only fundamental background lets us to suggest that probably it does. But, we are where we are - market stands below major support, moving lower and deeper in wide rectangle area. MACD trend stands bearish, no oversold here. It lets us to focus on two targets. First is YPS1 at 1.09 and second one is AB-CD COP target around 1.03, i.e. previous lows and bottom of the rectangle.
In current circumstances it makes no sense to talk about bullish scenario.
As we said this many times previously - indirect technical factors point on market's weakness, at least in long-term perspectives. Our major long-term driving factors are - Brexit, deteriorating situation in EU economy and politics, its high reliance from US, Brexit and lack of preparedness to change in Fed policy. By our view these factors will make the game in nearest 1-2 years, or even longer.
Just by using of common sense, guys, in nowadays it is difficult to expect something positive as in global economy as in politics. Hence, any bad new triggers demand for safe haven assets and US dollar. Following simple logic odds stand in favor of downside trend rather than sharp upside reversal.
So, although on technical picture we see just light and indirect signs of EUR weakness, political background stands negative. This is the major reason why I do not believe in resurrection of bull trend on EUR in this year.
Weekly
Weekly chart doesn't show something important by far. The grabber that we've mentioned last week is completed. Although price stands below major support, but it is still very close to it. Price doesn't show "major" breakout yet, overall action is gradual and slow as price still stands inside wedge consolidation.
At the same time, weekly COP on dollar index has not been hit yet, which suggests some downside continuation here, on EUR, as well.
Daily
So, here, on daily, we've got high wave pattern instead of drop to 1.10-1.1050 as we've suggested. Pattern itself doesn't look perfect, we saw better looking HW patterns, but it has HW feature due the event that has happened - mixed GDP release, and it corresponds to the nature of this data as investors shows mixed reaction and different view on perspective of the EUR.
Although we have 1.10 target as well, but it seems that it should be correct to take it off the table by far. Our 1.11 target has not been reached just for 10 pips, at least by FX Pro pricing. It means that our focus will be on HW pattern, and we will keep an eye on its top and low. Depending on breakout direction we will appoint next targets. It will either upside retracement and target probably will stand around some Fib levels, such as 1.1240 K-resistance. Downside target are already estimated...
While market is coiling inside HW range it is nothing to do on daily chart. Our 1.11 trade mostly is over.
Intraday
Intraday setup will be interesting for scalp traders mostly. In fact, here we have H&S-shaped price action and 1.1130 will be the key. If you drop the time frame more, to 15-min chart (although 30 min is also OK) you'll see "222" Buy pattern is forming and downside XOP creates at Agreement with 5/8 Fib support area around 1.1130. This is potential area for long entry, if you're searching for upside trade here.
Upside target stands at 1.1210 and XOP stands around 1.1250 which agrees with daily K-resistance area.
Conversely, downside breakout of 1.1130 support area probably leads to drop below recent lows, and reaching of 1.11 target, but, its not the fact that market will continue dropping to 1.10. Fed meeting stands in 2 days, so, hardly we will get any strong action.
Conclusion:
We still think that recent GDP data gives good image of US economy. Despite that data was mixed and we haven't got big drop that we were counted on, this is temporal measure as data was good anyway. It means that we keep our long-term bearish view on EUR, although downside pace could be slow, at least until some new strong factor will appear.
On coming week we do not expect strong action and mostly will keep an eye on upside retracement.
The technical portion of Sive's analysis owes a great deal to Joe DiNapoli's methods, and uses a number of Joe's proprietary indicators. Please note that Sive's analysis is his own view of the market and is not endorsed by Joe DiNapoli or any related companies.