Sive Morten
Special Consultant to the FPA
- Messages
- 18,673
Monthly
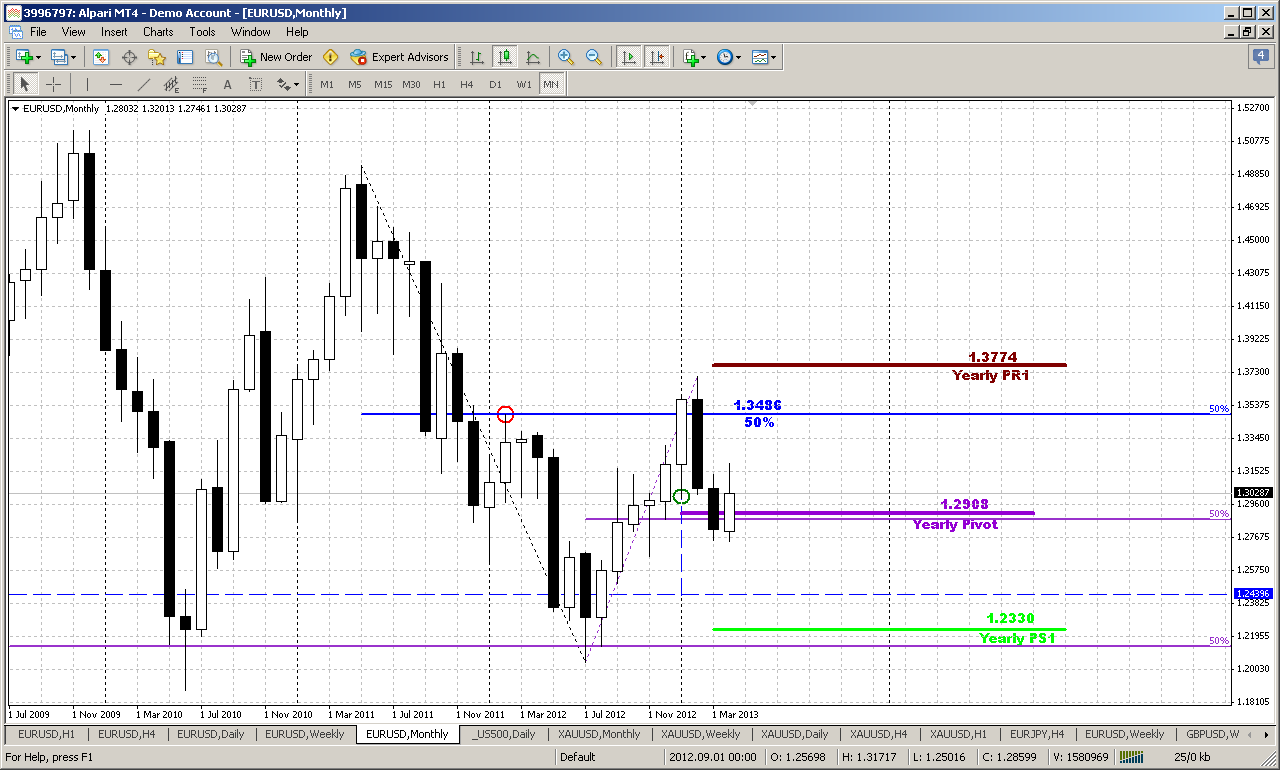
On big picture we see price bounce from support. It is difficult to say whether this reaction on yearly pivot or on 50% support level – anyway bounce has started, we’ve talked about it much in our day-by-day analysis. As we’ve discussed – currently market shows potential “bullish engulfing” pattern, although currently it looks not as impressive as on past week. Besides, Arpil bar has not closed yet. Anyway this probably will be treated just as retracement, because we need breakout of 1.3710 highs to speak again about bull trend. Until this will not happen – price action will remain just retracement.
At the same time greater bearish engulfing pattern is still valid and I see nothing curious with this minor bounce. If you will take a look at engulfing patterns, especially on long-term charts, you’ll see that in most cases some at least small retracement happens after pattern has been completed. And here we have support right below it.
As the conclusion of monthly analysis we can say that we have bearish pattern that points on long-term perspective down to 1.25 area. Hence current bounce could be used as a rally to Sell into and we could get some AB=CD down, based on bearish engulfing. Still this hardly will happen soon, since on lower time frames the retracement probably will be a bit extended in time and complex - AB=CD pattern as well.
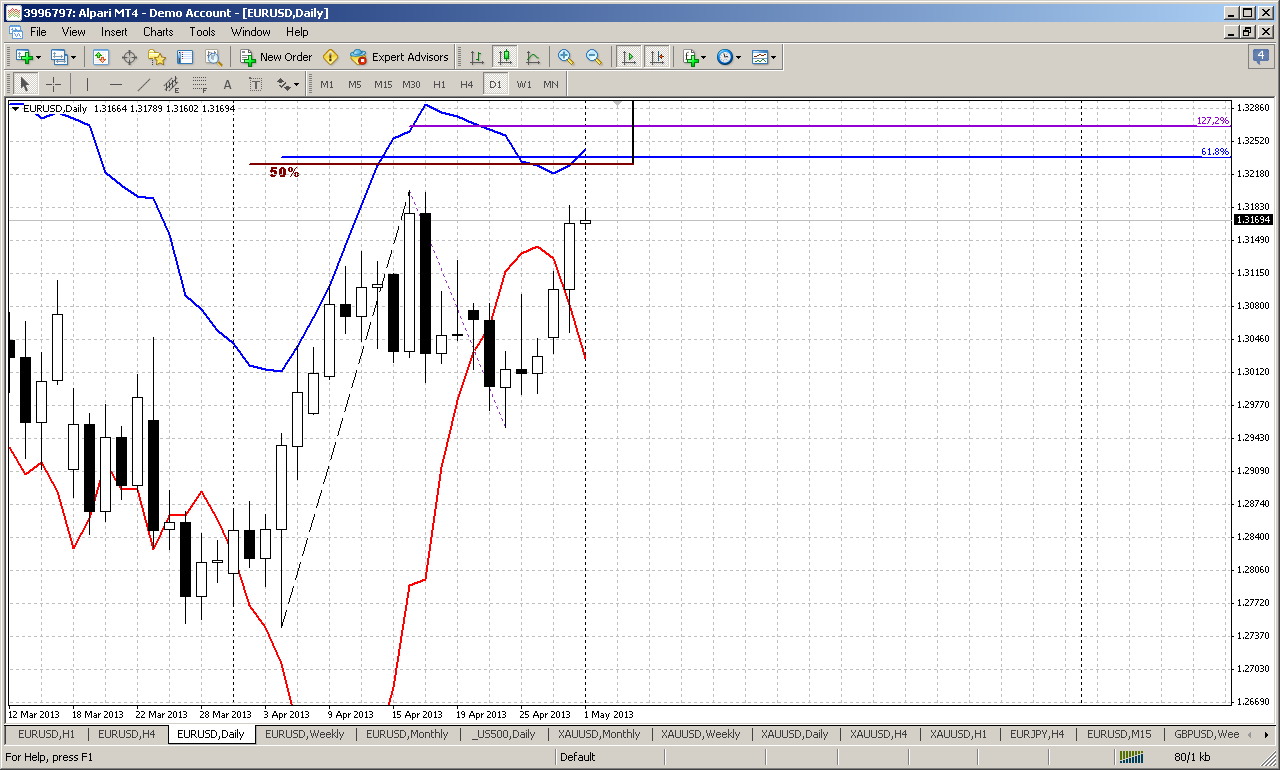
Weekly
Here is our major medium-term picture and we will talk about it again and again probably within considerable period of time, since reaching all objects by market here will take some months, I suppose. As this pattern is important for us – I keep detail explanation from previous research and at the end just add current assessment of situation.
I would like to offer you to take a look at current weekly action purely from harmonic point of view. May be it is not quite reasonable and adequate approach of analysis, but it agrees with nearest our expectation and could become interesting an useful.
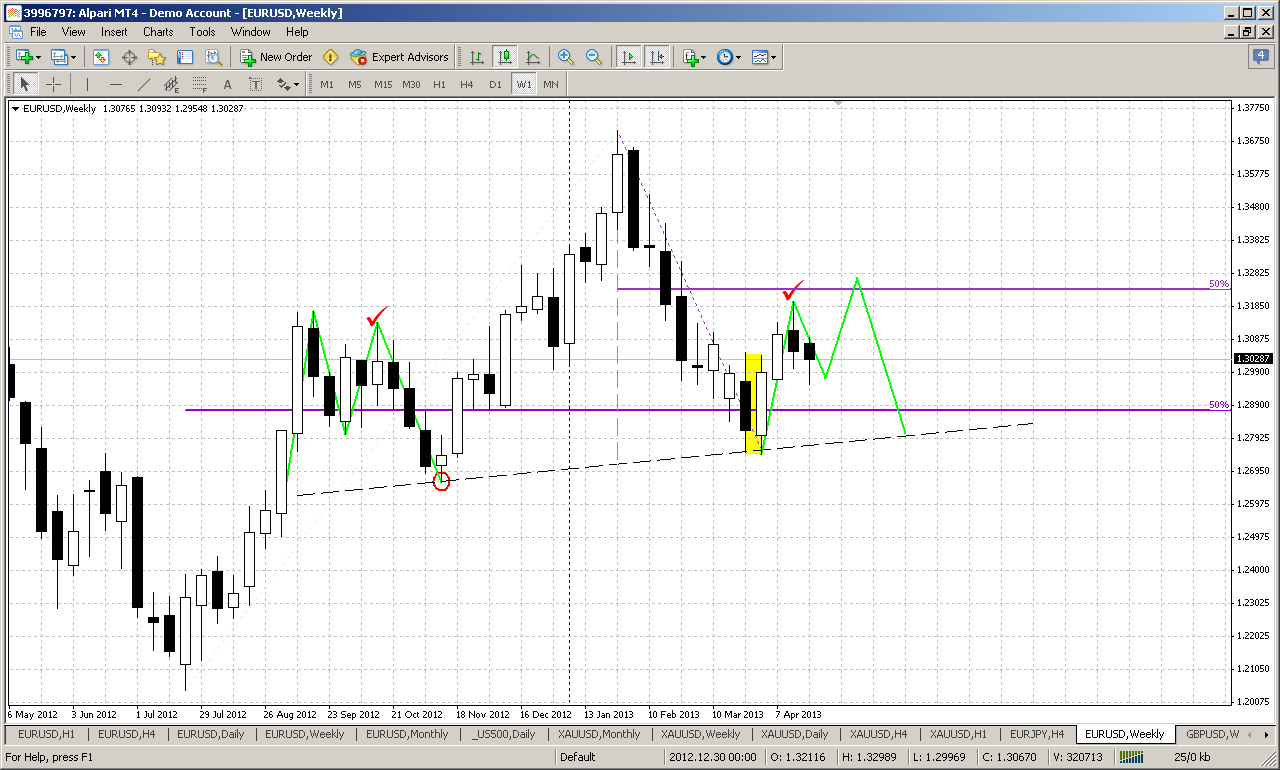
On weekly time frame the major pattern that we have is H&S (that is, in fact, bearish engulfing on monthly, right?). Take a close attentive look at the shape of left shoulder, see – it has the shape of downward AB-CD pattern. Now I ask you to imagine the mirror of it in relation to head, as I’ve drawn it. Thus, left shoulder was formed within 11 weeks, and our current upward action is a mirror to left shoulder’s downward – to the neck line. By “check sign” I’ve marked the candle where we are now in relation to left shoulder.
By this comparison we see, that within next two weeks there should be retracement to 50% support level, and then 2-3 weeks final upward leg to 50% resistance that market has not quite reached yet – and that is also triple harmonic swing target on daily time frame. Only after that the downward continuation due monthly bearish pattern should follow.
Hence, by this analsys and things that we’ve discussed on previous week, we probably should be ready for moving to 1.29-1.2950 area within nearest 2 weeks. This area could be reached even faster – on next week for example, but harmonic analysis suggests that market will coil around for some time, before will make second leg up to 50% resistance 1.3250 area.
Thus, on previous week we’ve said that should see 1.29-1.2950 within two weeks. First week from these two was the previous one and it has passed by now. Take a look at the picture again – in fact, current candle is a mirror of the candle from left shoulder. By “Check sign” I’ve marked the week when we have started to track this pattern. So, now you have to take a look and compare one week to the right on right shoulder and one week to the left on left shoulder. Following by this logic, we probably should see some kind of reversal coming week, because on left shoulder next is solid upward candle, but it has lower low. It means that by following perfect harmonic scenario, market initially should show some dive (probably to our 1.2920), but later in the week turn to upside.
Although this is obviously too perfect scenario and some deviation could happen here or there. Thus, you can see that upward action within right shoulder was 1 week faster. Still the major idea here stands with this pattern and relative harmony of the shoulders. This gives us the key of understanding overall picture. If we will take a broader view on weekly chart – you’ll see that market now stands at natural resistance level and MPR1 = 1.3050.
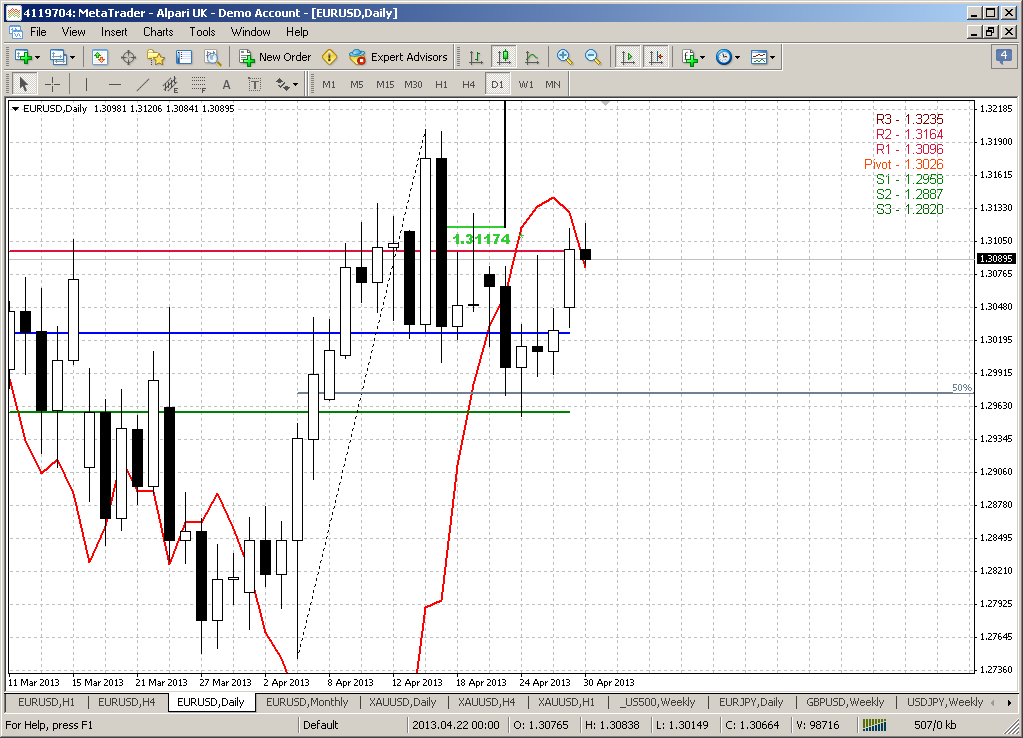
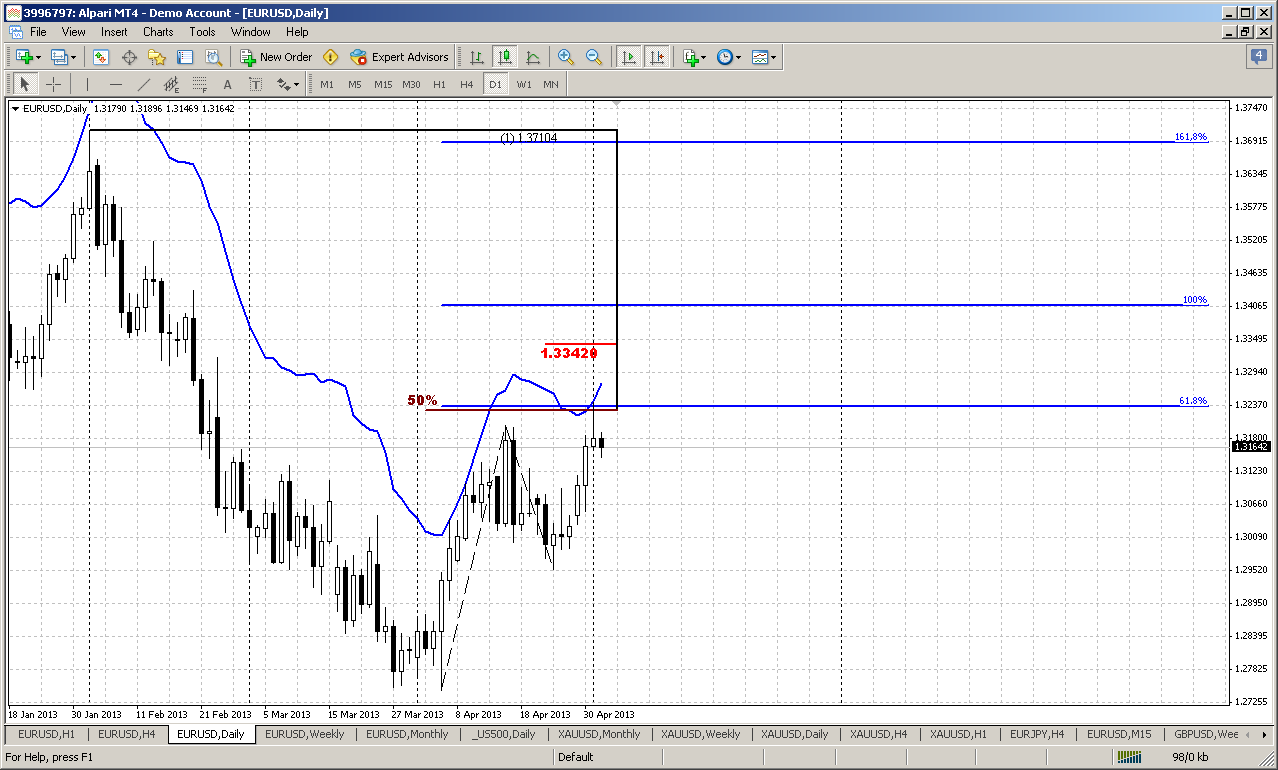
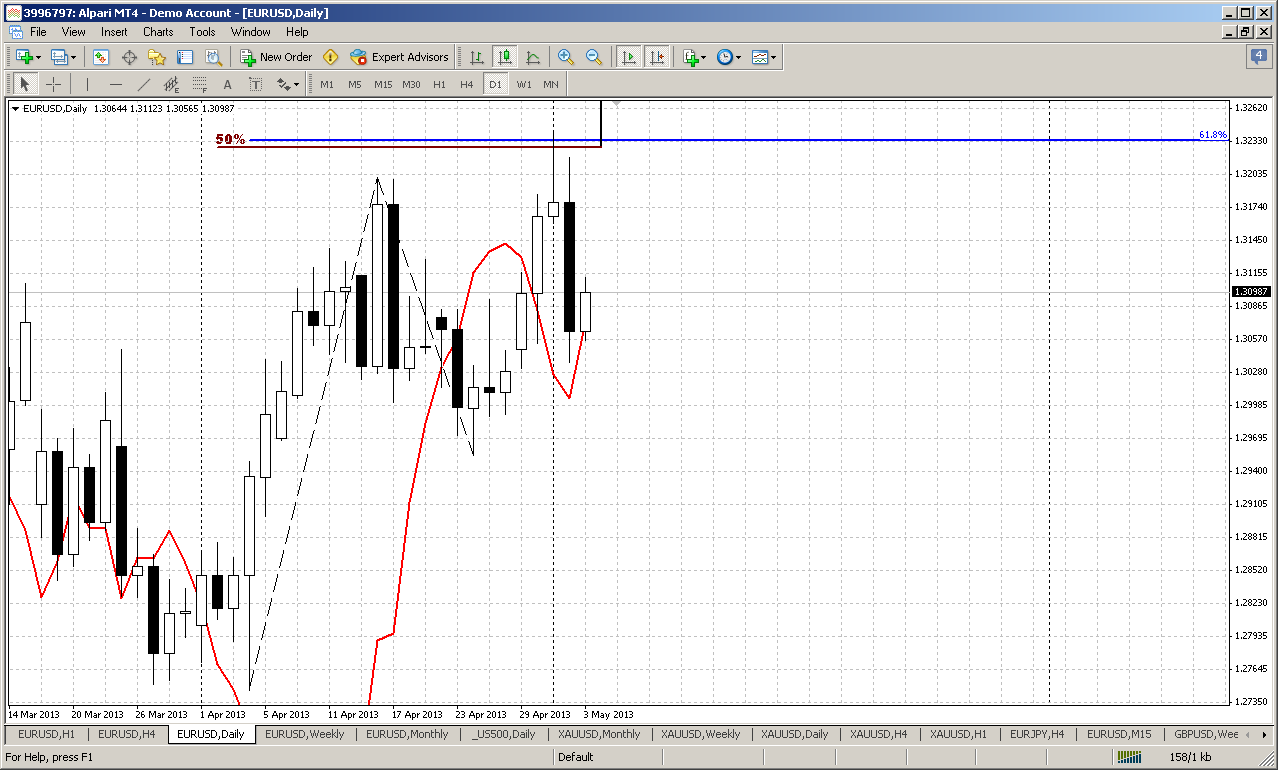
Daily
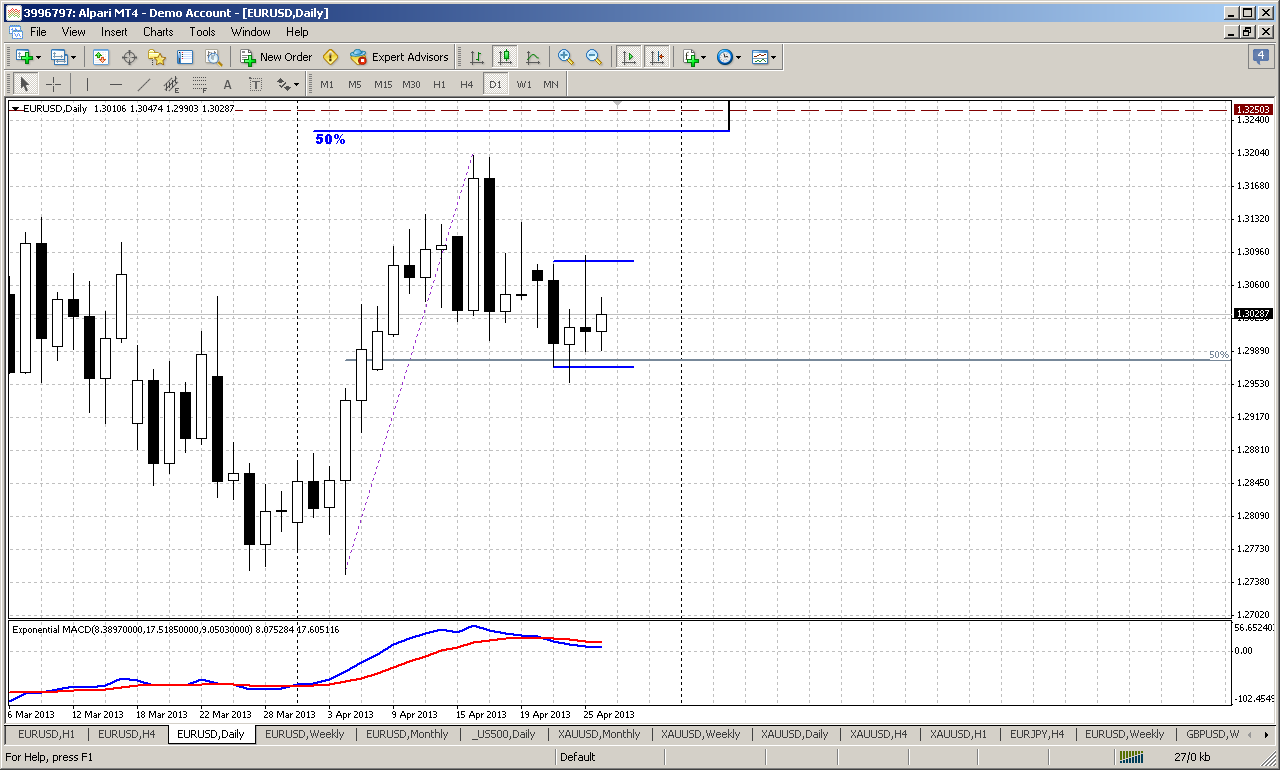
It’s a bit difficult to make comments on daily chart, since as you can see price action was rather tight and a bit bore. In fact, market stands in the range of Tuesday. Friday was also inside trading session. All these staff reminds consolidation rather than attempt of upward continuation. All of you probably know my stubborn (or may be stupid) opinion that market should show another final leg down to 1.2920. But I can explain… Recall that currently market stands at solid support area – 50% and former WPS1. Also somewhere near was intraday K-support area. If market has real bullish power and intention to continue move higher – would this level be sufficient for that purpose? Absolutely. But what we have instead – choppy and tight action, inside trading session and doji with long upper shadow. Other words – we see action that is more typical for contraction rather than for expansion of the market. Hence, as market doesn’t want to go up, it probably will go down.
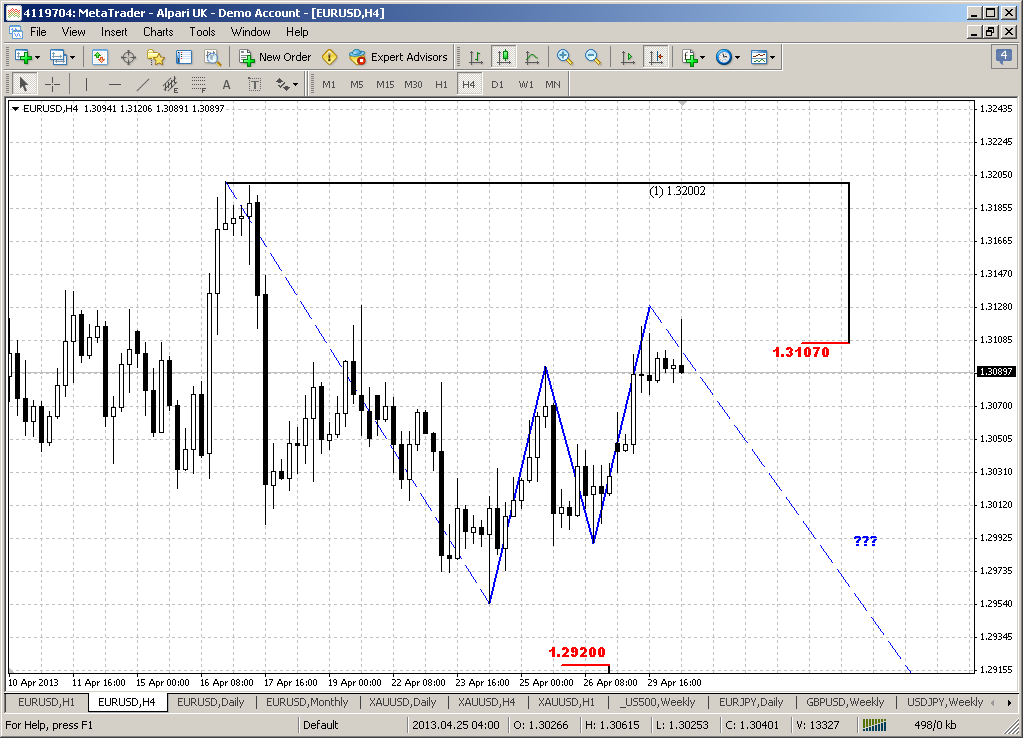
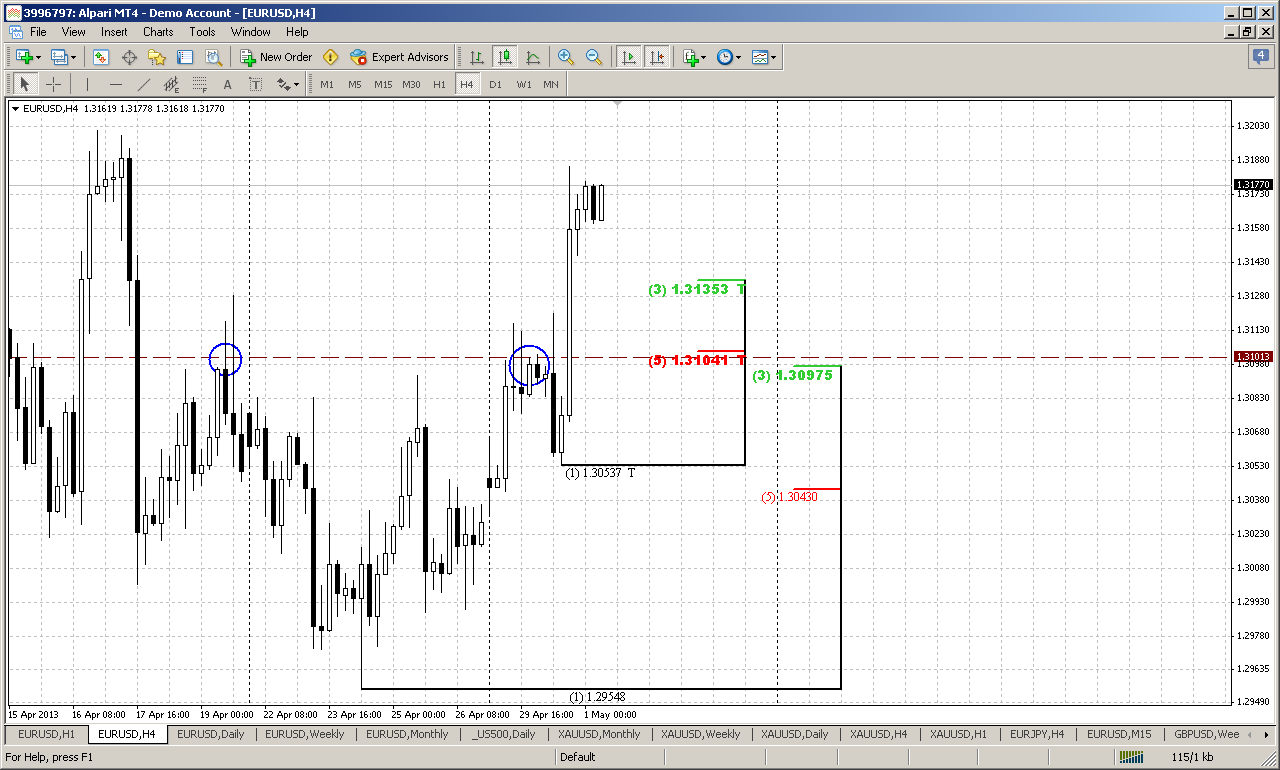
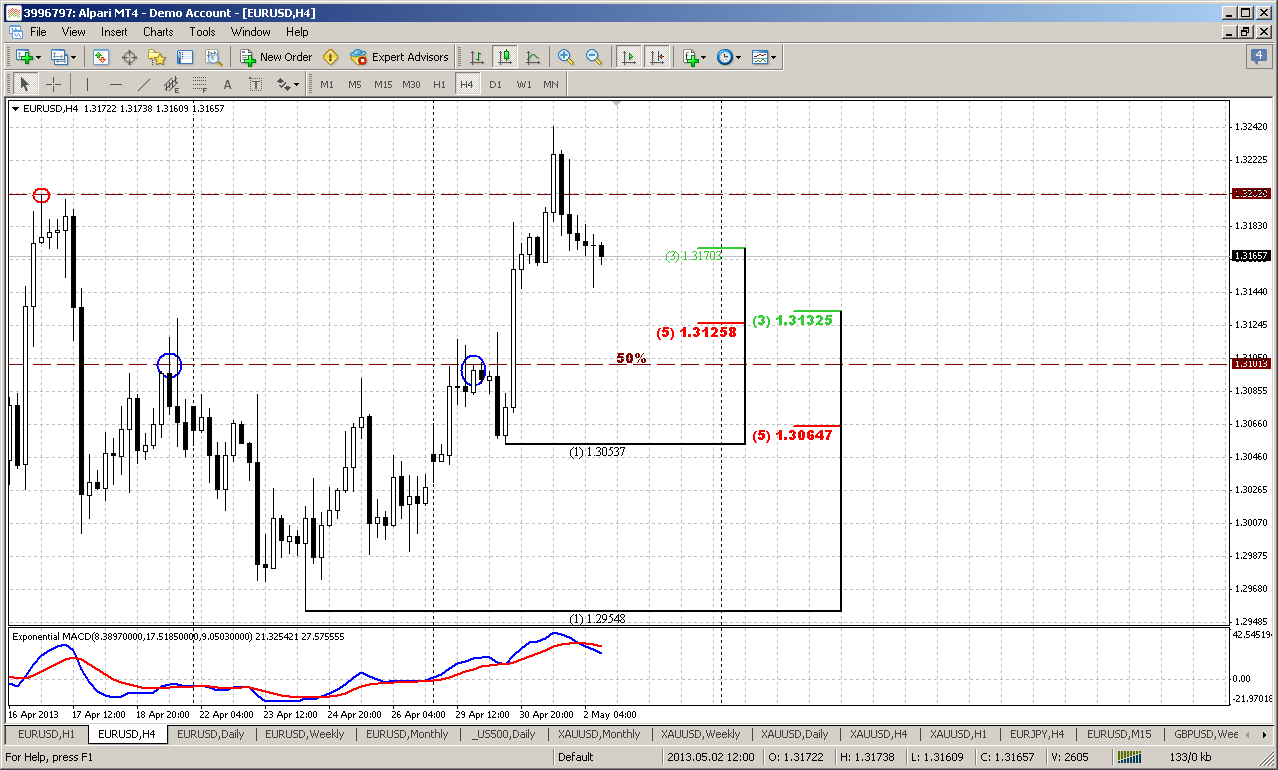
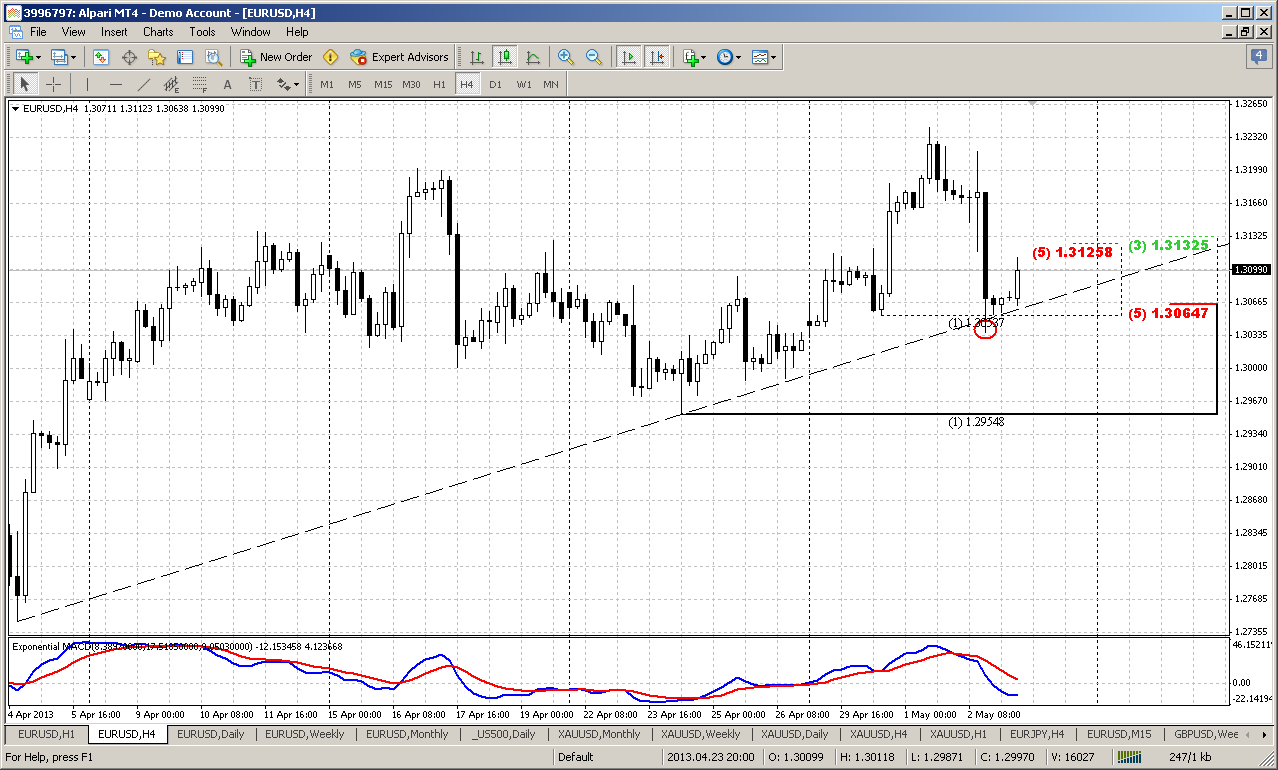
4-hour
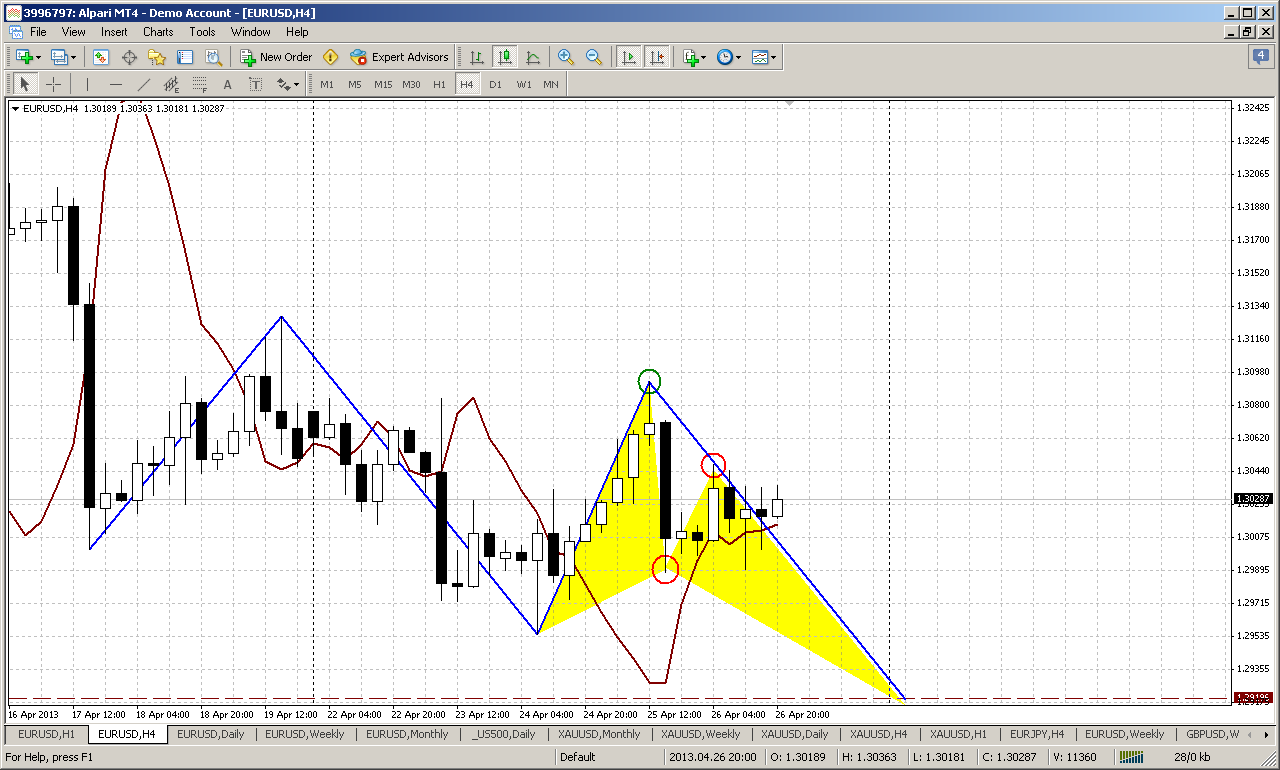
You probably may ask – what’s the difference here from our Friday analysis of 4-hour chart, why we should look at this picture again, since at first glance all look the same. Yes, in big parts all stands the same – as initial AB=CD pattern, potential 3-Drive Buy that consists of two side-by-side butterflies, inner butterfly AB-CD - all patterns have the same 1.2920 area and we know that. But on Friday market has changed small, but extremely important thing – it has erased Friday’s stop grabber and has formed two new ones. But since minimum target of stop grabber is a previous swing high – our target has decreased from Butterfly Invalidation point (green circle) as it was on Friday to Friday’s stop grabber’s top (red circle) – and that is quite different picture with absolutely different risks. If, of cause stop grabber will be satisfied by minimum target...
Probably this means that our major pattern here is a butterfly, but stop grabber hints on potential retracement up that could be used for better entry point to the downside. Thus, thanks to stop grabber we could be able to place stops tighter to butterfly invalidation point.
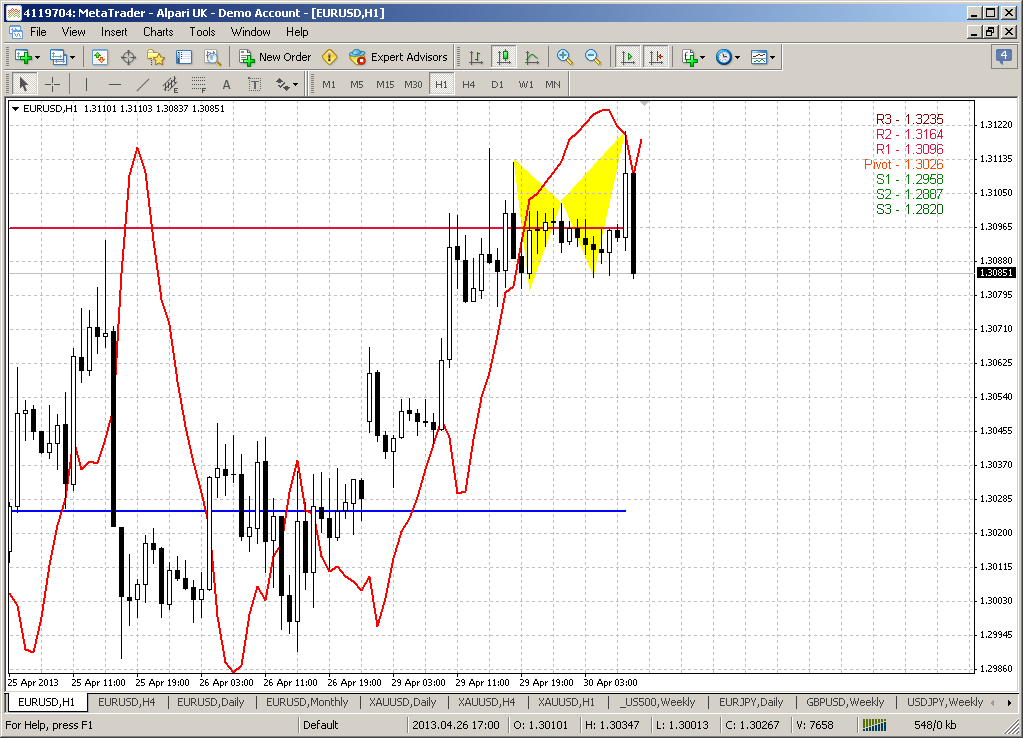
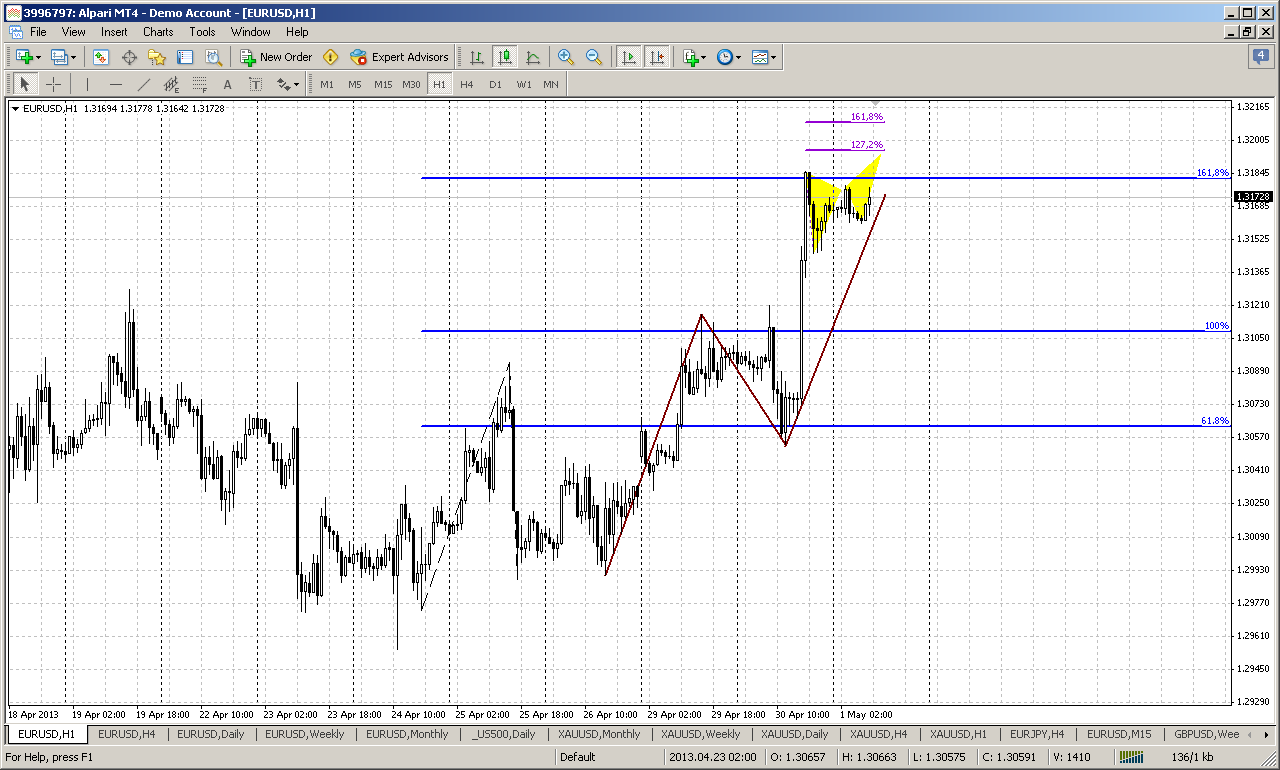
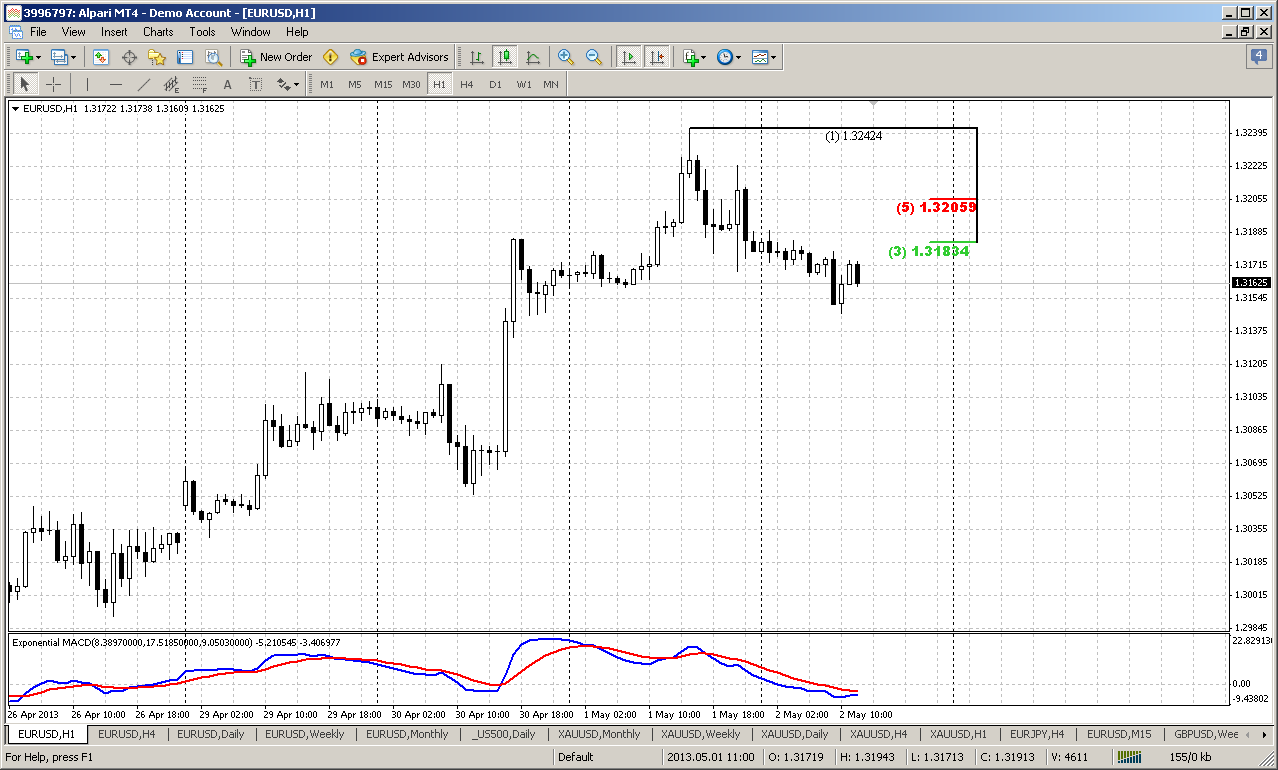
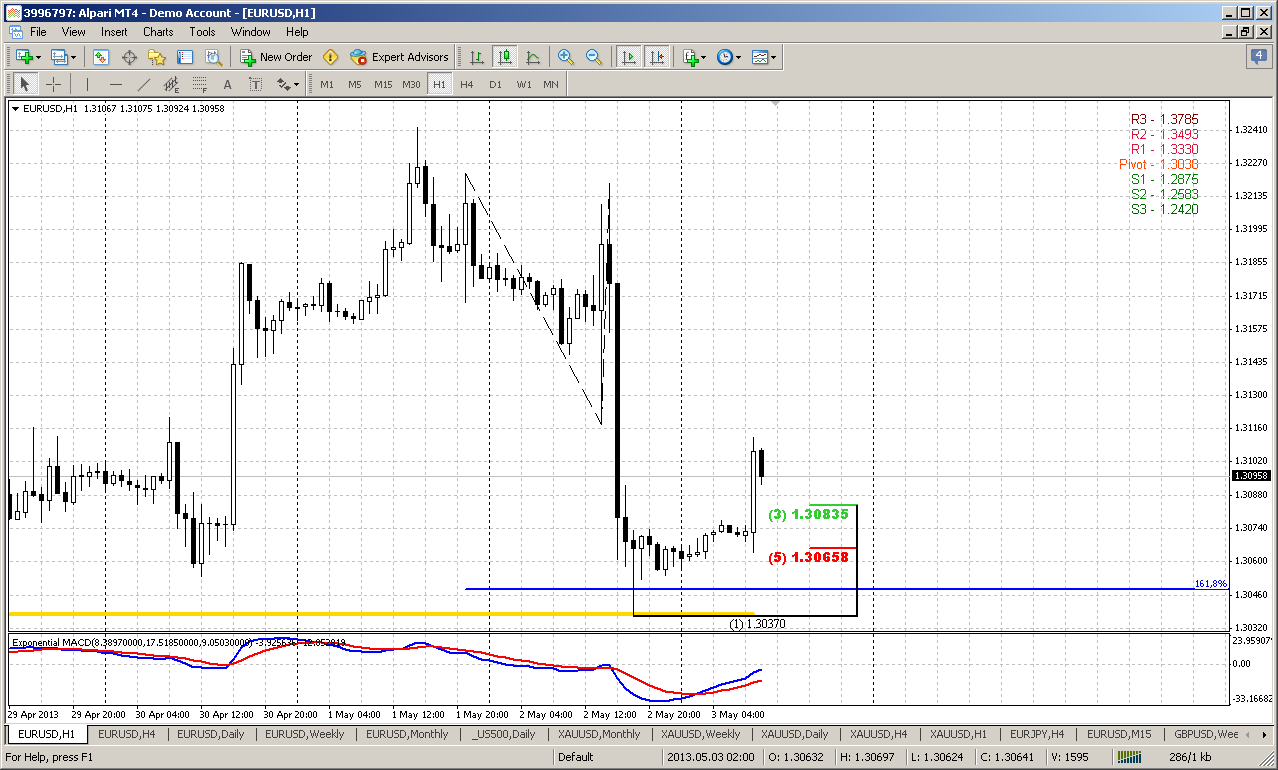
60-min
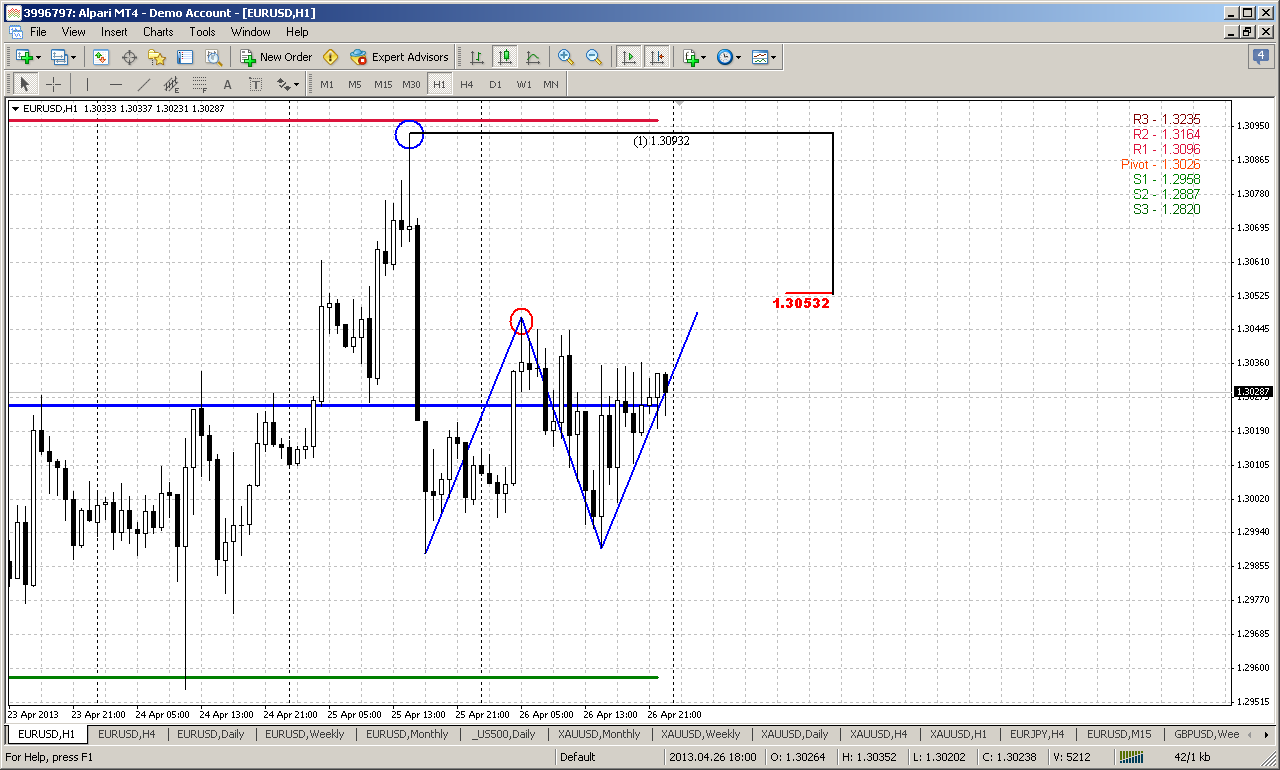
If 4-hour stop grabbers will work, then market at minimum should reached 1.3050 area – and that is the level that we will look first in the beginning of the week. Here we have AB=CD pattern but with deep BC leg, so that D point almost equals to B, but slightly higher and that agrees with stop grabber setup.
If market indeed will reach 1.3050 – this will give us nice oportunity for short entry, since just 40 pips higher stands invalidation point of Butterfly and WPR1. Both of them give reasonable area that will protect our potential stop order.
Conclusion:
Short-term price behavior suggests some lack of bullish power and low possibility to show upward expansion by impulse move up. Thus, this increases probability of final leg down to 1.2920.
At the same time we have scalp bullish patterns on intraday charts. If they will work we could get better entry point on the short side of the market.
Preliminary analysis suggests looking for Short entry around 1.3050 with stop above 1.31 and target around 1.2920. But data will strongly depend on how market will get there (if it will at all). Any fast upward explosion, impulse move will put this scenario under question. In fact, our short-term setup – is butterfly trading.
The technical portion of Sive's analysis owes a great deal to Joe DiNapoli's methods, and uses a number of Joe's proprietary indicators. Please note that Sive's analysis is his own view of the market and is not endorsed by Joe DiNapoli or any related companies.
On big picture we see price bounce from support. It is difficult to say whether this reaction on yearly pivot or on 50% support level – anyway bounce has started, we’ve talked about it much in our day-by-day analysis. As we’ve discussed – currently market shows potential “bullish engulfing” pattern, although currently it looks not as impressive as on past week. Besides, Arpil bar has not closed yet. Anyway this probably will be treated just as retracement, because we need breakout of 1.3710 highs to speak again about bull trend. Until this will not happen – price action will remain just retracement.
At the same time greater bearish engulfing pattern is still valid and I see nothing curious with this minor bounce. If you will take a look at engulfing patterns, especially on long-term charts, you’ll see that in most cases some at least small retracement happens after pattern has been completed. And here we have support right below it.
As the conclusion of monthly analysis we can say that we have bearish pattern that points on long-term perspective down to 1.25 area. Hence current bounce could be used as a rally to Sell into and we could get some AB=CD down, based on bearish engulfing. Still this hardly will happen soon, since on lower time frames the retracement probably will be a bit extended in time and complex - AB=CD pattern as well.
Weekly
Here is our major medium-term picture and we will talk about it again and again probably within considerable period of time, since reaching all objects by market here will take some months, I suppose. As this pattern is important for us – I keep detail explanation from previous research and at the end just add current assessment of situation.
I would like to offer you to take a look at current weekly action purely from harmonic point of view. May be it is not quite reasonable and adequate approach of analysis, but it agrees with nearest our expectation and could become interesting an useful.
On weekly time frame the major pattern that we have is H&S (that is, in fact, bearish engulfing on monthly, right?). Take a close attentive look at the shape of left shoulder, see – it has the shape of downward AB-CD pattern. Now I ask you to imagine the mirror of it in relation to head, as I’ve drawn it. Thus, left shoulder was formed within 11 weeks, and our current upward action is a mirror to left shoulder’s downward – to the neck line. By “check sign” I’ve marked the candle where we are now in relation to left shoulder.
By this comparison we see, that within next two weeks there should be retracement to 50% support level, and then 2-3 weeks final upward leg to 50% resistance that market has not quite reached yet – and that is also triple harmonic swing target on daily time frame. Only after that the downward continuation due monthly bearish pattern should follow.
Hence, by this analsys and things that we’ve discussed on previous week, we probably should be ready for moving to 1.29-1.2950 area within nearest 2 weeks. This area could be reached even faster – on next week for example, but harmonic analysis suggests that market will coil around for some time, before will make second leg up to 50% resistance 1.3250 area.
Thus, on previous week we’ve said that should see 1.29-1.2950 within two weeks. First week from these two was the previous one and it has passed by now. Take a look at the picture again – in fact, current candle is a mirror of the candle from left shoulder. By “Check sign” I’ve marked the week when we have started to track this pattern. So, now you have to take a look and compare one week to the right on right shoulder and one week to the left on left shoulder. Following by this logic, we probably should see some kind of reversal coming week, because on left shoulder next is solid upward candle, but it has lower low. It means that by following perfect harmonic scenario, market initially should show some dive (probably to our 1.2920), but later in the week turn to upside.
Although this is obviously too perfect scenario and some deviation could happen here or there. Thus, you can see that upward action within right shoulder was 1 week faster. Still the major idea here stands with this pattern and relative harmony of the shoulders. This gives us the key of understanding overall picture. If we will take a broader view on weekly chart – you’ll see that market now stands at natural resistance level and MPR1 = 1.3050.
Daily
It’s a bit difficult to make comments on daily chart, since as you can see price action was rather tight and a bit bore. In fact, market stands in the range of Tuesday. Friday was also inside trading session. All these staff reminds consolidation rather than attempt of upward continuation. All of you probably know my stubborn (or may be stupid) opinion that market should show another final leg down to 1.2920. But I can explain… Recall that currently market stands at solid support area – 50% and former WPS1. Also somewhere near was intraday K-support area. If market has real bullish power and intention to continue move higher – would this level be sufficient for that purpose? Absolutely. But what we have instead – choppy and tight action, inside trading session and doji with long upper shadow. Other words – we see action that is more typical for contraction rather than for expansion of the market. Hence, as market doesn’t want to go up, it probably will go down.
4-hour
You probably may ask – what’s the difference here from our Friday analysis of 4-hour chart, why we should look at this picture again, since at first glance all look the same. Yes, in big parts all stands the same – as initial AB=CD pattern, potential 3-Drive Buy that consists of two side-by-side butterflies, inner butterfly AB-CD - all patterns have the same 1.2920 area and we know that. But on Friday market has changed small, but extremely important thing – it has erased Friday’s stop grabber and has formed two new ones. But since minimum target of stop grabber is a previous swing high – our target has decreased from Butterfly Invalidation point (green circle) as it was on Friday to Friday’s stop grabber’s top (red circle) – and that is quite different picture with absolutely different risks. If, of cause stop grabber will be satisfied by minimum target...
Probably this means that our major pattern here is a butterfly, but stop grabber hints on potential retracement up that could be used for better entry point to the downside. Thus, thanks to stop grabber we could be able to place stops tighter to butterfly invalidation point.
60-min
If 4-hour stop grabbers will work, then market at minimum should reached 1.3050 area – and that is the level that we will look first in the beginning of the week. Here we have AB=CD pattern but with deep BC leg, so that D point almost equals to B, but slightly higher and that agrees with stop grabber setup.
If market indeed will reach 1.3050 – this will give us nice oportunity for short entry, since just 40 pips higher stands invalidation point of Butterfly and WPR1. Both of them give reasonable area that will protect our potential stop order.
Conclusion:
Short-term price behavior suggests some lack of bullish power and low possibility to show upward expansion by impulse move up. Thus, this increases probability of final leg down to 1.2920.
At the same time we have scalp bullish patterns on intraday charts. If they will work we could get better entry point on the short side of the market.
Preliminary analysis suggests looking for Short entry around 1.3050 with stop above 1.31 and target around 1.2920. But data will strongly depend on how market will get there (if it will at all). Any fast upward explosion, impulse move will put this scenario under question. In fact, our short-term setup – is butterfly trading.
The technical portion of Sive's analysis owes a great deal to Joe DiNapoli's methods, and uses a number of Joe's proprietary indicators. Please note that Sive's analysis is his own view of the market and is not endorsed by Joe DiNapoli or any related companies.