Sive Morten
Special Consultant to the FPA
- Messages
- 18,669
Monthly
On previous week we have discussed in details possible scenarios and why current price location is very important. I’ve checked other currency pairs and come to conlusion that no major pair shows much better setup than EUR. Yes, may be JPY and AUD are also interesting, but not too much compares to EUR. Thus, our monthly analysis stands intact. We have just one new thing here – August pivot points.
We so many times have discussed this time frame that it is really the challenge to find something new and interesting here. At first glance it could be seen that here is nothing special and no big deal around, but in reality the oposite is true – it is a big deal around current level. Direction of real breakout of the flag pattern could set the direction of the market in long-term perspective. It is probably rather milestone sign that market is forming indecision pattern right around breakeven point of long-term sentiment, I mean yearly pivot point. It is very simbolical at current moment. Speaking about flag pattern itself, we already can find a lot of covert signs. For example, usually when price shows bullish trap action, i.e. fake upward breakout, in 90% of cases oposite real breakout follows. But what we see here? We see double failure. First it was bullish trap and then it was cancelled by bearish trap, since breakout down was also false and now is the question will real breakout up follow or not. We could think that as market has vanished bearish pattern – it must be strong bullish moment and may be this is true, especially because market still hold above yearly pivot. But we can ask – why this can’t happen again? Well may be it could, now we do not tell that we can estimate further direction from current messy action and do not even try to do this. we just want to indicate the current condition - action is really indecisive in big meaning of this word, since we see two fake breakouts around yearly pivot, that itself is a breakeven of yearly sentiment.
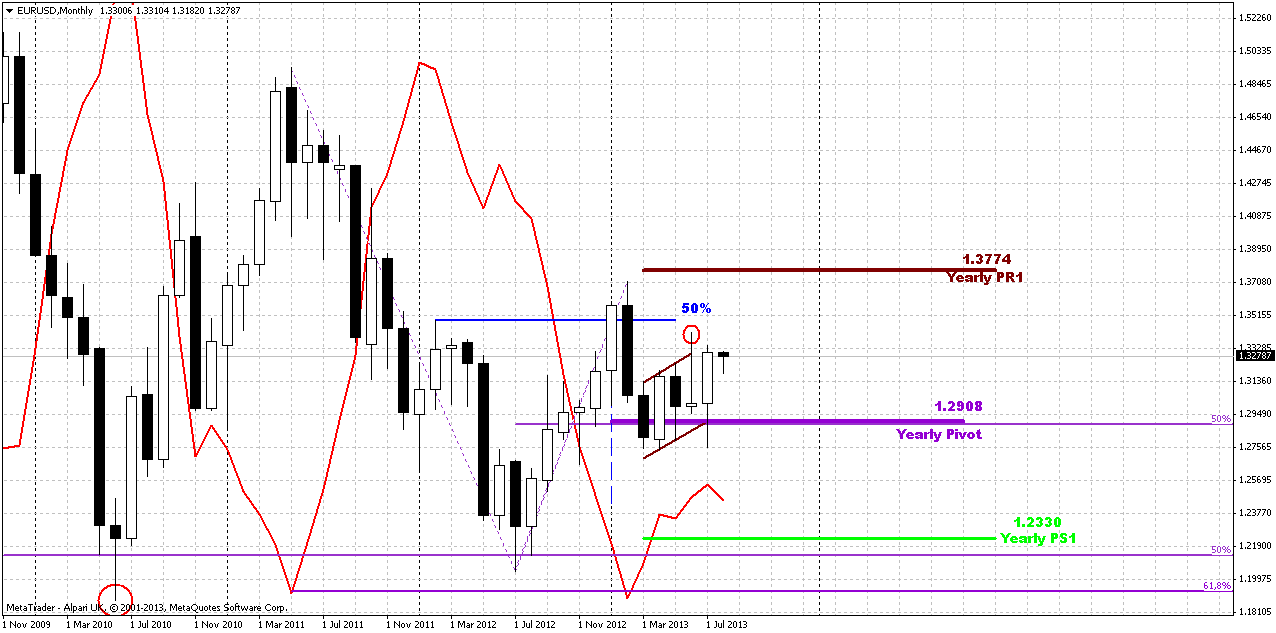
On previous week we have shown charts – what could follow if real breakout will happen, depending on its direction. Here we just call you to be careful and always keep an eye on big picture, despite what we are trading on lower time frames.
Weekly
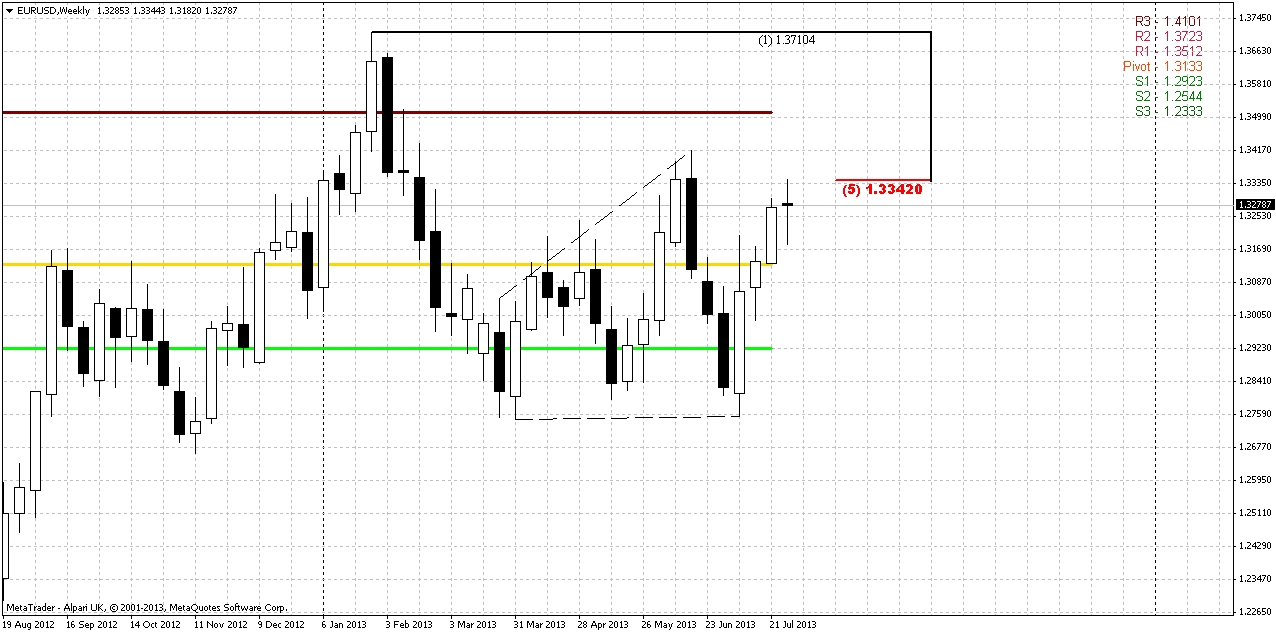
As you probably understand already, we do not have many changes on higher time frames. Thus, on weekly chart price has formed doji or high wave pattern that indicates indecision situation on market. Deep retracement has happened within previous week, but market has closed as it opened. Trend holds bullish here, market not at overbought and 5/8 Fib resistance has been tested once already. As we’ve said earlier - previous action mostly has more bullish signs than bearish.
This conclusion mostly comes from the way of market’s respect on 1.2750 support area. You probably remember that this level was a neckline of H&S pattern, 0.618 extension of AB-CD pattern, some fib level – in short it was solid support. Normal bearish development didn’t forbid a bounce from that area, but later market should return right back and pass through this support area. Bounce should not be too extended. But here market almost has reached the top of former right shoulder, price has erased bearish stop grabber pattern, that could not have come at a better time. Now trend has turned bullish. Other words, market has vanished all bearish signs that were formed previously. That’s why something put me to think that bullish development is more probable here in nearest future, although technically we do have nothing except bullish engulfing pattern and bull trend. From the other side, I do not see any bearish issues right now at all, except may be the moment that new MPP has not been tested yet by market.
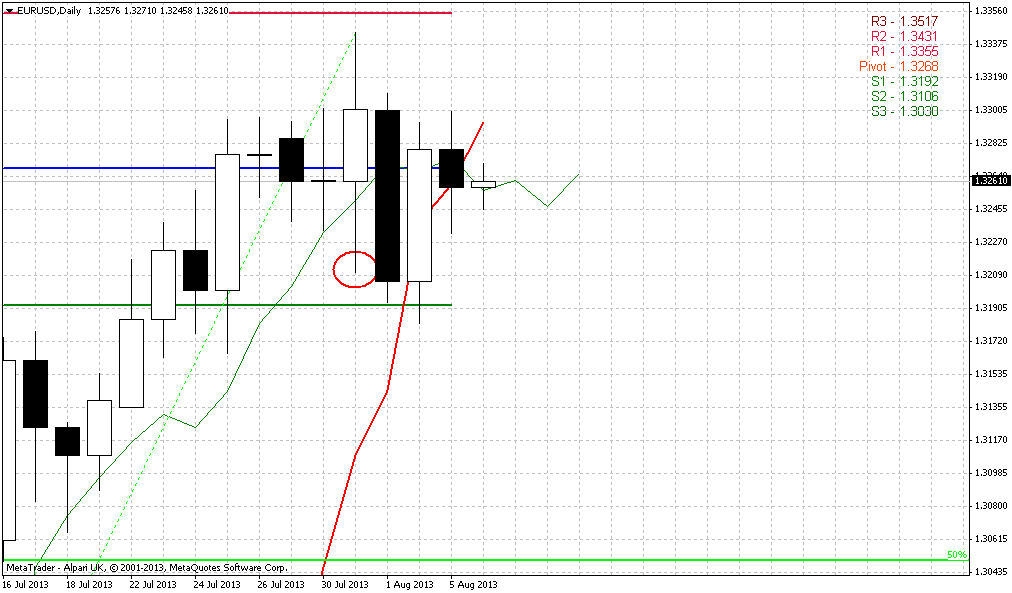
Daily
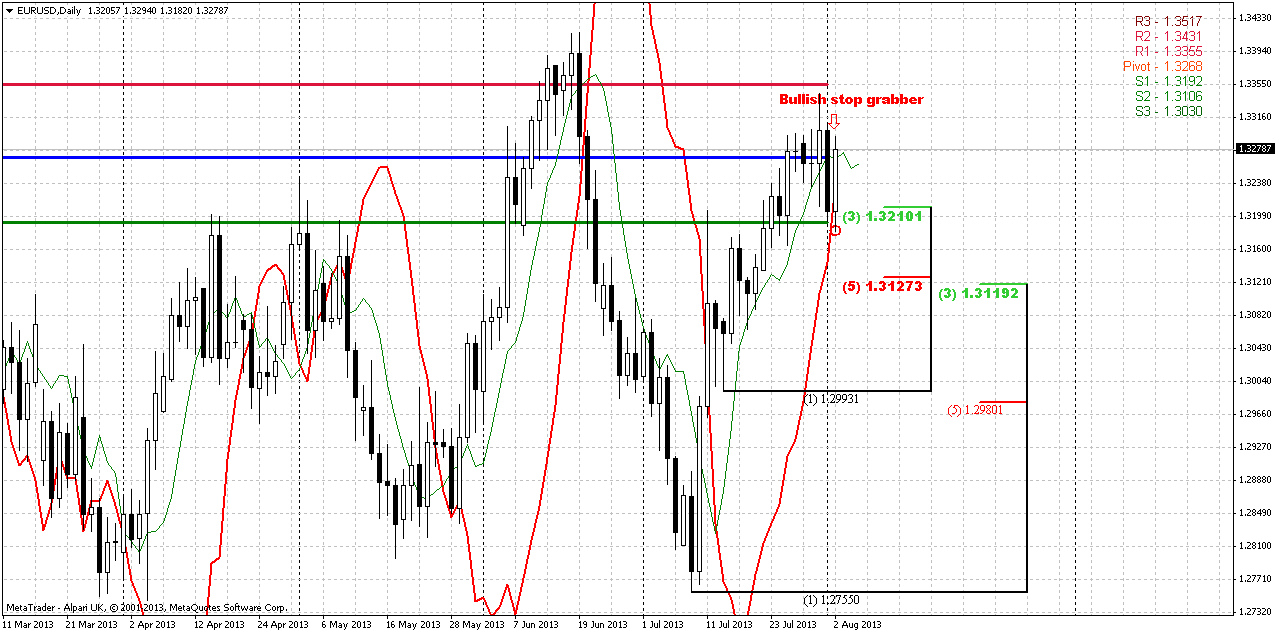
On daily chart we have two possible setups at once and one of them has been confirmed already. This is the pattern that we’ve discussed on Friday – yes, this is bullish stop grabber. We not just occasionally have said earlier, that it is unclear situation on daily chart and plunge down on Thursday of previous week does not resolve anything. It is obviously insufficient action for any drastical changes and we’ve said that it’s not over yet. Worse than expected NFP data on Friday has led to upward bounce from nearest Fib support level. That particularly has given us bullish stop grabber. The minimum target of this pattern is previous highs and invalidation point is its low. The level around lows of grabber are significant even without relation to the pattern, because that is WPS1 and Fib support as well, and moving below WPS1 will not just erase stop grabber, but will mean that this is more just retracement inside of bullish trend. That could be the sign of short-term bearish reversal.
Second pattern is DRPO “Sell” LAL, that I still have decided to include in our discussion. As we have discussed, the thrust up here may be is not perfect, but at the same time it is not as bad as to be absolutely hopeless. May be it works, who knows… Anyway, currently we do not have confirmed DRPO pattern yet. For that purpose we need to get second close below 3x3 DMA, that is a thin green line on the chart. By now we already have first close below it and close above.
And now we’re shifting to the most interesting moment. You may ask – how it could be, bullish and bearish pattern simultaneously. Do they contradict to each other? Not quite. Since the minimum target of stop grabber is just previous highs – market could reach them and stop there. This action could become particularly the second top of DRPO “Sell” pattern and then market could turn down. See – this is simple, and price at once will complete grabber and will not erase DRPO “Sell”.
But it is not as simple with DRPO as it seems. DRPO is a pattern that goes side by side with its failure – and as we know DPRO Failure is also a directional pattern. Thus, watch up closely here. Here could be second variant. If market will show small retracement on Monday (because WPP stands very close) – slightly inside of grabber’s body – this could become a confirmation bar of DRPO, but prior completion of grabber’s target. That will be worst scenario, or better to say most sophisticated one. Because when you have confirmed DRPO and bullish grabber – this could be the possibility for DRPO “Failure” and stronger upward continuation later during the week. So, keep an eye on this possibility. If this will happen, we will definitely track it in our daily videos.
But know all seems cloudless. We have bullish confirmed pattern, all trends are bullish, and market is not on overbought. Let’s stick with it and later will see what will happen.
60-min
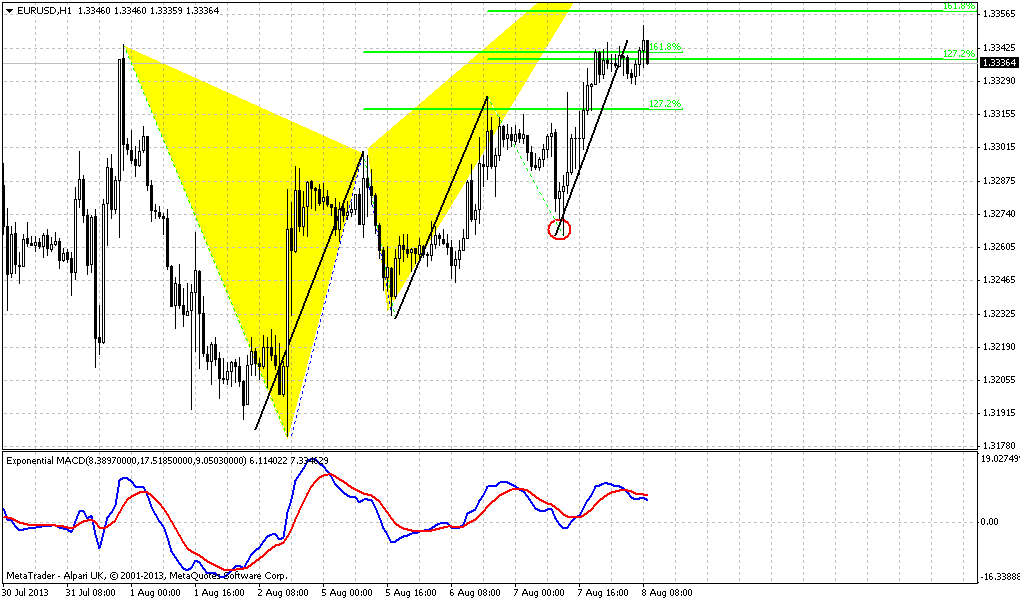
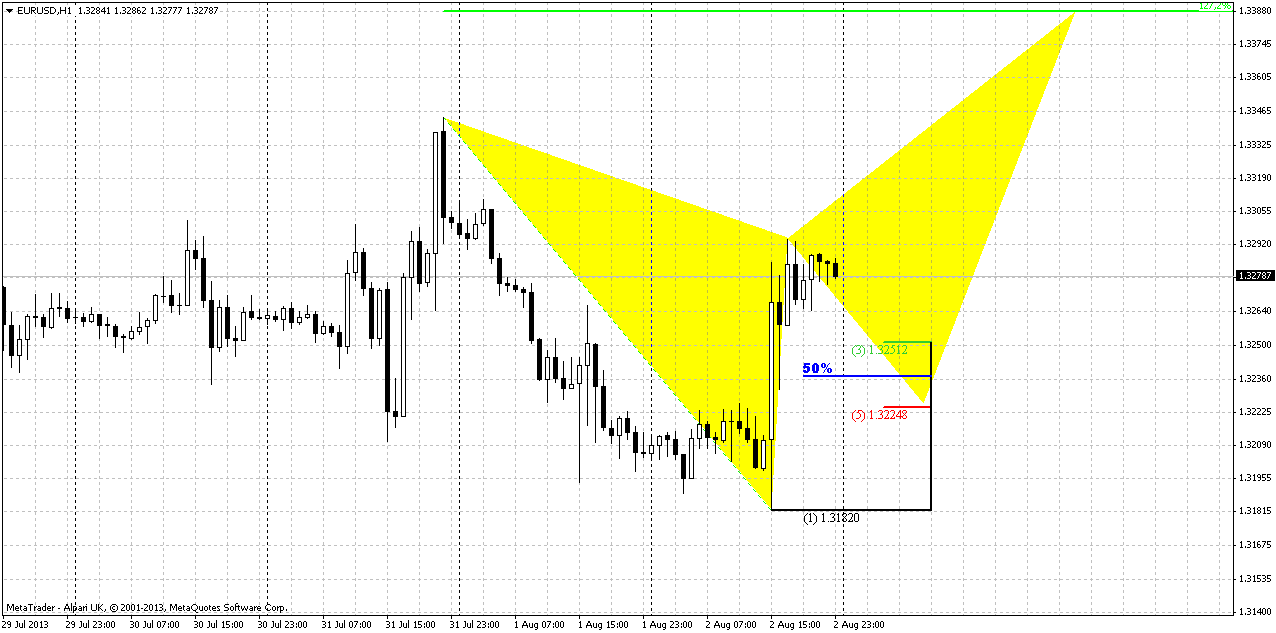
On hourly and 4-hour charts thrend is bullish. As we have the pattern on daily that assumes taking out of previous highs, we probably should try to find something of that sort on lower time frames. Thus, it is possible that we could get butterfly “Sell” here. Although it’s target a bit too extended to upside, but appearing of butterfly is welcome as from DRPO standpoint as stop grabber pattern.
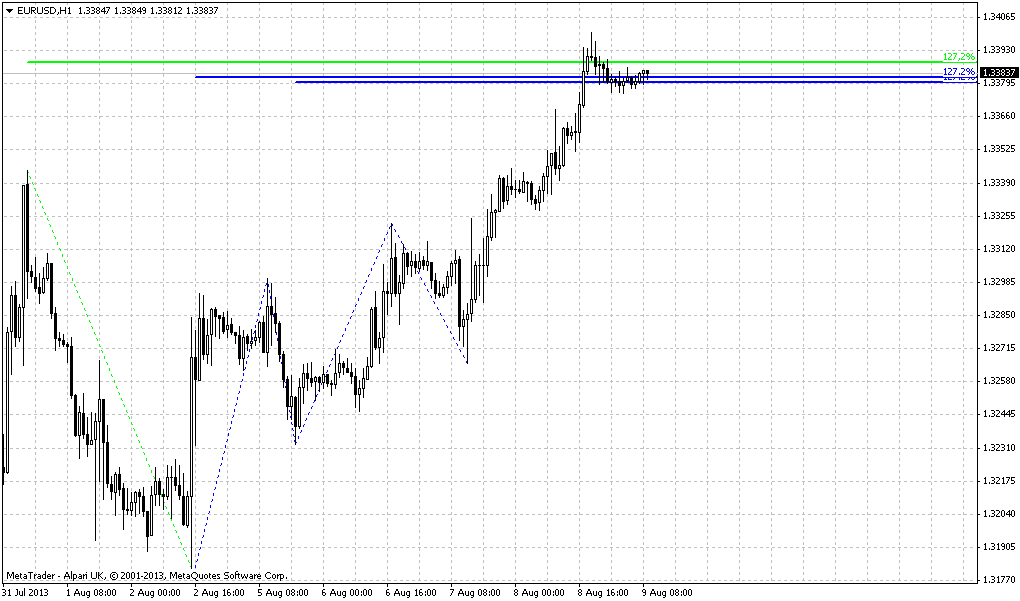
Before upward continuation market could show retracement down and simultaneously hit WPP. As we know that EUR likes 50% retracements, may be this will be it, but 5/8 is also fine. We do not want to see here just two things – fast move down by some solid black candle and taking out of 1.3180 lows. Until that will happen – upward scenario will be valid.
Conclusion:
In long term perspective, market mostly still stands indecision, because is coiling around long-term sentiment breakeven point – yearly pivot. To point on direction price has to show break – out from current range. Until this will happen we can’t take sequence of trades in any direction. All that we can do in such environment is to search short-term clear setups and trade them fast.
One of them we have on daily chart. This is bullish stop grabber that potentially could become the part of DRPO “Sell” LAL pattern. That is scenario that we will track most part of coming week I suppose.
The technical portion of Sive's analysis owes a great deal to Joe DiNapoli's methods, and uses a number of Joe's proprietary indicators. Please note that Sive's analysis is his own view of the market and is not endorsed by Joe DiNapoli or any related companies.
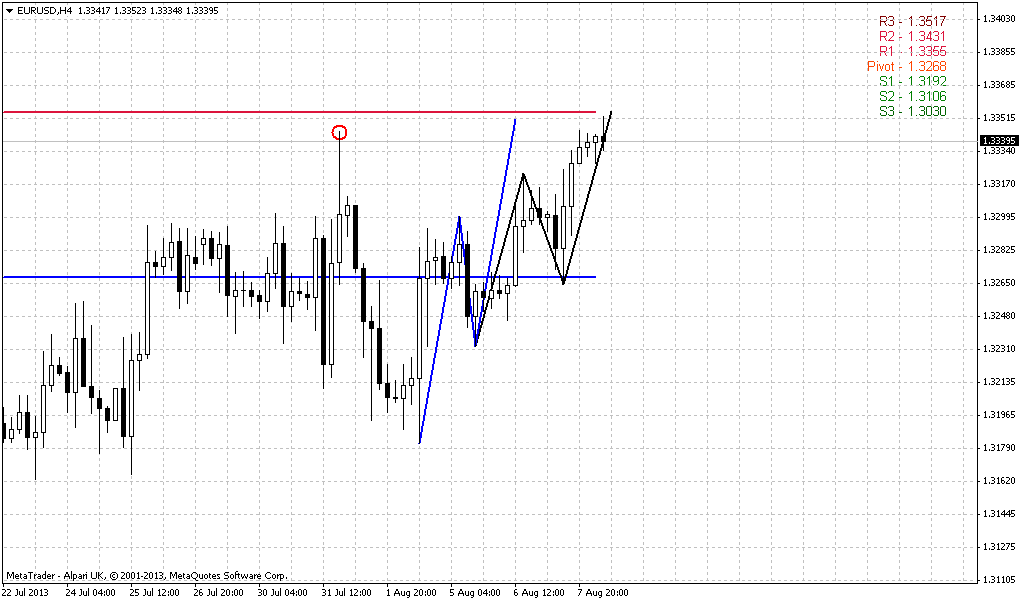
On previous week we have discussed in details possible scenarios and why current price location is very important. I’ve checked other currency pairs and come to conlusion that no major pair shows much better setup than EUR. Yes, may be JPY and AUD are also interesting, but not too much compares to EUR. Thus, our monthly analysis stands intact. We have just one new thing here – August pivot points.
We so many times have discussed this time frame that it is really the challenge to find something new and interesting here. At first glance it could be seen that here is nothing special and no big deal around, but in reality the oposite is true – it is a big deal around current level. Direction of real breakout of the flag pattern could set the direction of the market in long-term perspective. It is probably rather milestone sign that market is forming indecision pattern right around breakeven point of long-term sentiment, I mean yearly pivot point. It is very simbolical at current moment. Speaking about flag pattern itself, we already can find a lot of covert signs. For example, usually when price shows bullish trap action, i.e. fake upward breakout, in 90% of cases oposite real breakout follows. But what we see here? We see double failure. First it was bullish trap and then it was cancelled by bearish trap, since breakout down was also false and now is the question will real breakout up follow or not. We could think that as market has vanished bearish pattern – it must be strong bullish moment and may be this is true, especially because market still hold above yearly pivot. But we can ask – why this can’t happen again? Well may be it could, now we do not tell that we can estimate further direction from current messy action and do not even try to do this. we just want to indicate the current condition - action is really indecisive in big meaning of this word, since we see two fake breakouts around yearly pivot, that itself is a breakeven of yearly sentiment.
On previous week we have shown charts – what could follow if real breakout will happen, depending on its direction. Here we just call you to be careful and always keep an eye on big picture, despite what we are trading on lower time frames.
Weekly
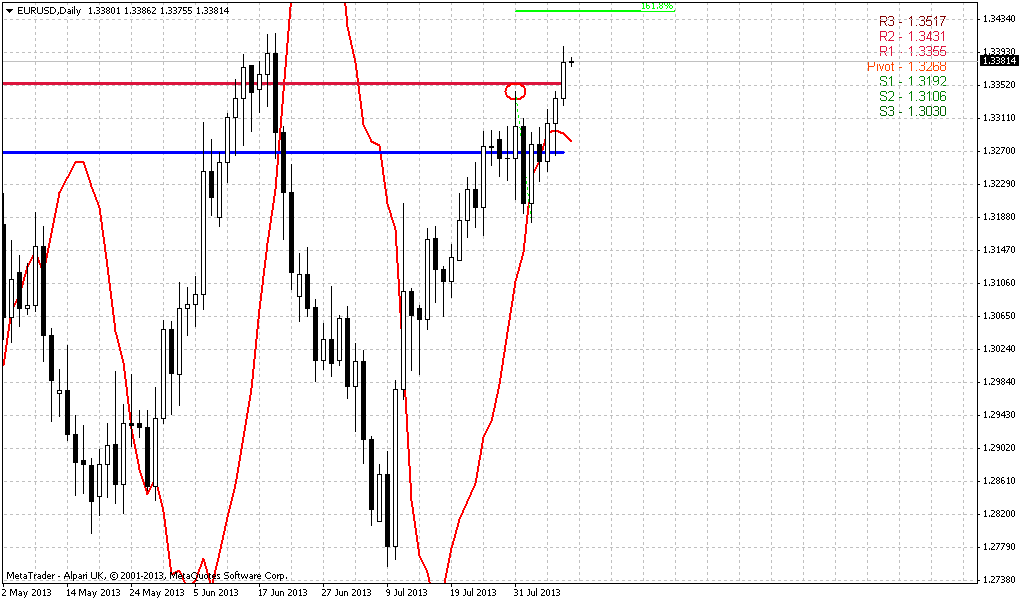
As you probably understand already, we do not have many changes on higher time frames. Thus, on weekly chart price has formed doji or high wave pattern that indicates indecision situation on market. Deep retracement has happened within previous week, but market has closed as it opened. Trend holds bullish here, market not at overbought and 5/8 Fib resistance has been tested once already. As we’ve said earlier - previous action mostly has more bullish signs than bearish.
This conclusion mostly comes from the way of market’s respect on 1.2750 support area. You probably remember that this level was a neckline of H&S pattern, 0.618 extension of AB-CD pattern, some fib level – in short it was solid support. Normal bearish development didn’t forbid a bounce from that area, but later market should return right back and pass through this support area. Bounce should not be too extended. But here market almost has reached the top of former right shoulder, price has erased bearish stop grabber pattern, that could not have come at a better time. Now trend has turned bullish. Other words, market has vanished all bearish signs that were formed previously. That’s why something put me to think that bullish development is more probable here in nearest future, although technically we do have nothing except bullish engulfing pattern and bull trend. From the other side, I do not see any bearish issues right now at all, except may be the moment that new MPP has not been tested yet by market.
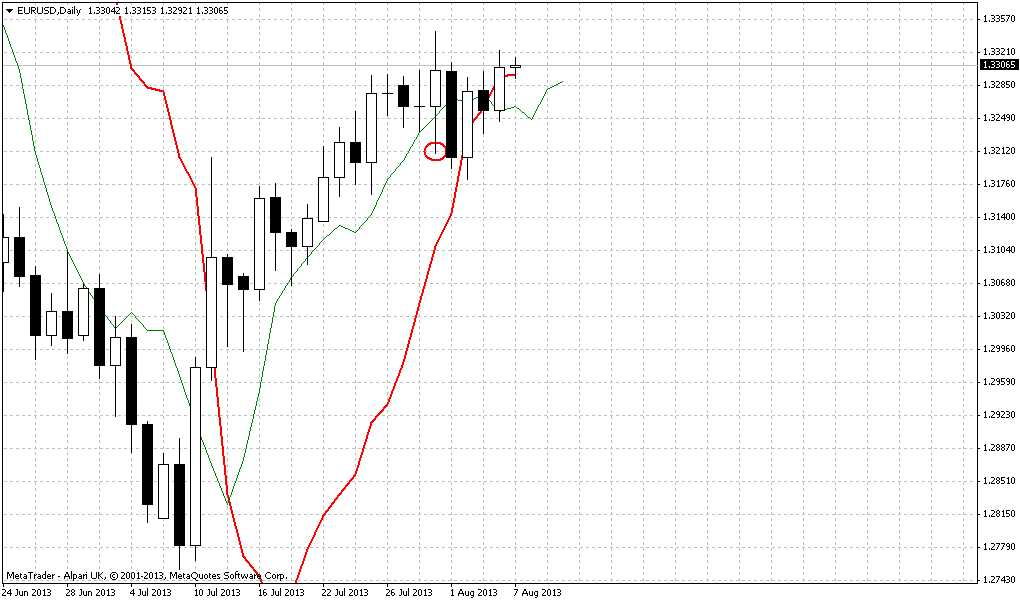
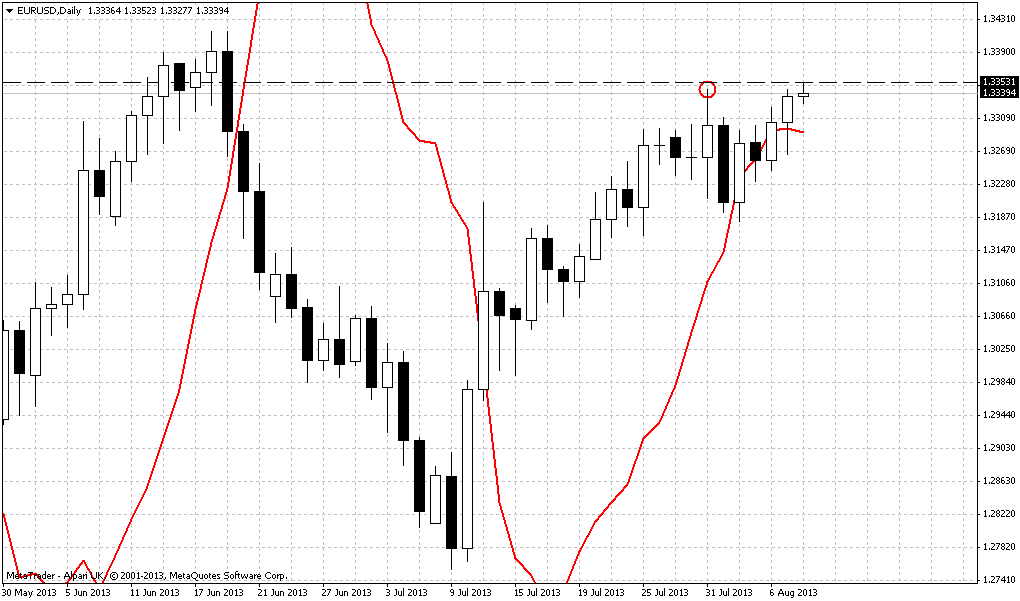
Daily
On daily chart we have two possible setups at once and one of them has been confirmed already. This is the pattern that we’ve discussed on Friday – yes, this is bullish stop grabber. We not just occasionally have said earlier, that it is unclear situation on daily chart and plunge down on Thursday of previous week does not resolve anything. It is obviously insufficient action for any drastical changes and we’ve said that it’s not over yet. Worse than expected NFP data on Friday has led to upward bounce from nearest Fib support level. That particularly has given us bullish stop grabber. The minimum target of this pattern is previous highs and invalidation point is its low. The level around lows of grabber are significant even without relation to the pattern, because that is WPS1 and Fib support as well, and moving below WPS1 will not just erase stop grabber, but will mean that this is more just retracement inside of bullish trend. That could be the sign of short-term bearish reversal.
Second pattern is DRPO “Sell” LAL, that I still have decided to include in our discussion. As we have discussed, the thrust up here may be is not perfect, but at the same time it is not as bad as to be absolutely hopeless. May be it works, who knows… Anyway, currently we do not have confirmed DRPO pattern yet. For that purpose we need to get second close below 3x3 DMA, that is a thin green line on the chart. By now we already have first close below it and close above.
And now we’re shifting to the most interesting moment. You may ask – how it could be, bullish and bearish pattern simultaneously. Do they contradict to each other? Not quite. Since the minimum target of stop grabber is just previous highs – market could reach them and stop there. This action could become particularly the second top of DRPO “Sell” pattern and then market could turn down. See – this is simple, and price at once will complete grabber and will not erase DRPO “Sell”.
But it is not as simple with DRPO as it seems. DRPO is a pattern that goes side by side with its failure – and as we know DPRO Failure is also a directional pattern. Thus, watch up closely here. Here could be second variant. If market will show small retracement on Monday (because WPP stands very close) – slightly inside of grabber’s body – this could become a confirmation bar of DRPO, but prior completion of grabber’s target. That will be worst scenario, or better to say most sophisticated one. Because when you have confirmed DRPO and bullish grabber – this could be the possibility for DRPO “Failure” and stronger upward continuation later during the week. So, keep an eye on this possibility. If this will happen, we will definitely track it in our daily videos.
But know all seems cloudless. We have bullish confirmed pattern, all trends are bullish, and market is not on overbought. Let’s stick with it and later will see what will happen.
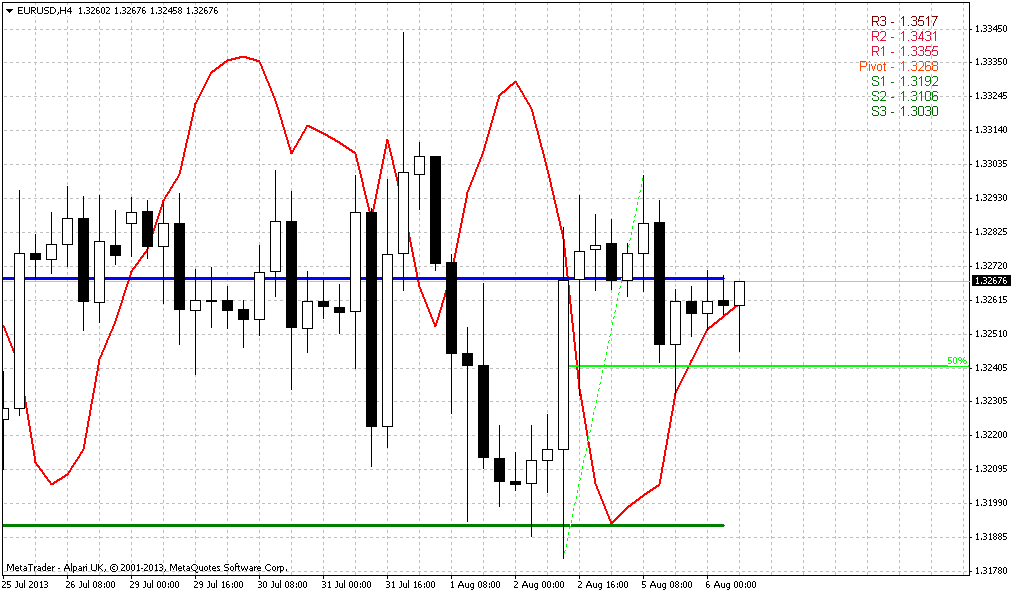
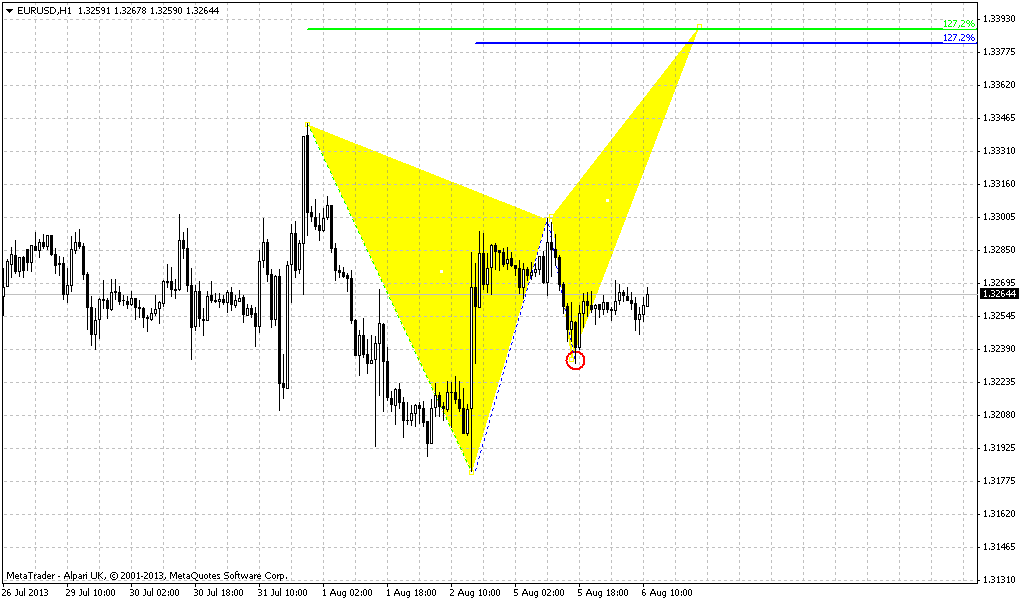
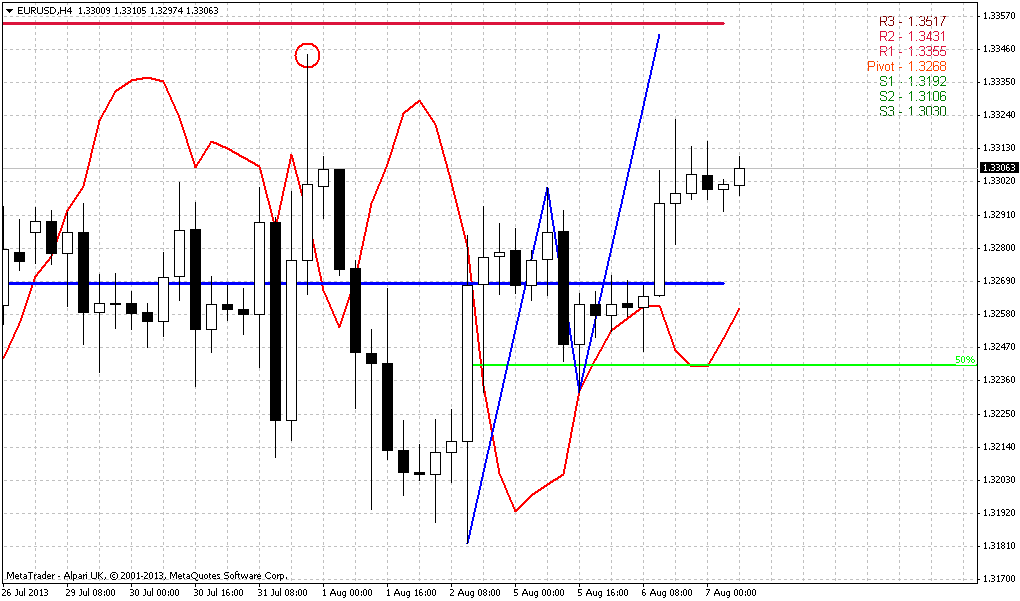
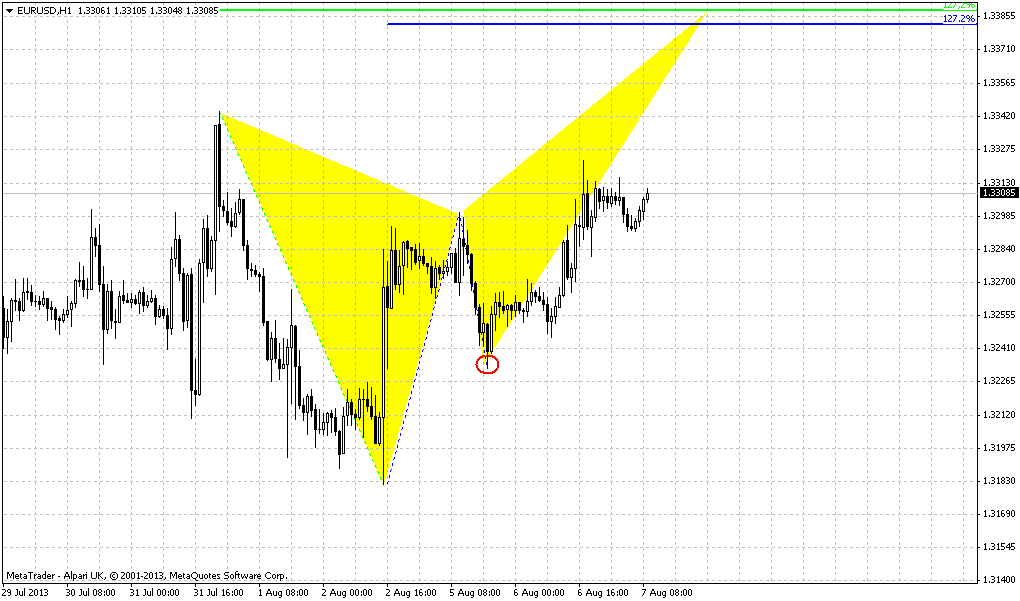
60-min
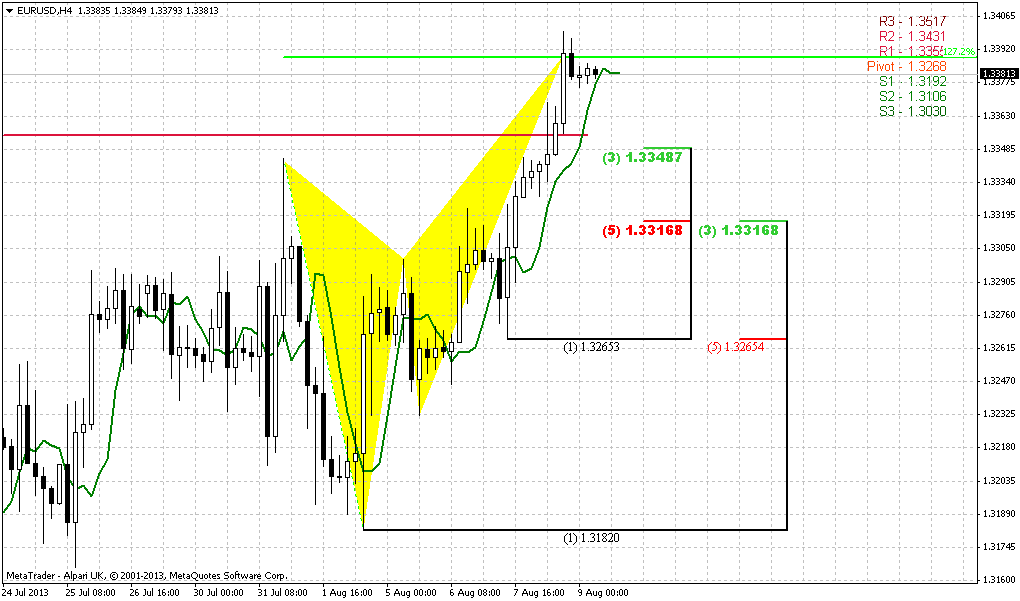
On hourly and 4-hour charts thrend is bullish. As we have the pattern on daily that assumes taking out of previous highs, we probably should try to find something of that sort on lower time frames. Thus, it is possible that we could get butterfly “Sell” here. Although it’s target a bit too extended to upside, but appearing of butterfly is welcome as from DRPO standpoint as stop grabber pattern.
Before upward continuation market could show retracement down and simultaneously hit WPP. As we know that EUR likes 50% retracements, may be this will be it, but 5/8 is also fine. We do not want to see here just two things – fast move down by some solid black candle and taking out of 1.3180 lows. Until that will happen – upward scenario will be valid.
Conclusion:
In long term perspective, market mostly still stands indecision, because is coiling around long-term sentiment breakeven point – yearly pivot. To point on direction price has to show break – out from current range. Until this will happen we can’t take sequence of trades in any direction. All that we can do in such environment is to search short-term clear setups and trade them fast.
One of them we have on daily chart. This is bullish stop grabber that potentially could become the part of DRPO “Sell” LAL pattern. That is scenario that we will track most part of coming week I suppose.
The technical portion of Sive's analysis owes a great deal to Joe DiNapoli's methods, and uses a number of Joe's proprietary indicators. Please note that Sive's analysis is his own view of the market and is not endorsed by Joe DiNapoli or any related companies.