Sive Morten
Special Consultant to the FPA
- Messages
- 18,727
Fundamentals
(Reuters) - The dollar rallied across the board on Friday after data showed U.S. employment increased more than expected in July and wages picked up, raising the probability of an interest rate hike from the Federal Reserve this year.
The dollar hit one-week peaks against the euro and the Swiss franc, and turned positive versus the yen after the jobs data.
U.S. non-farm payrolls increased by 255,000 jobs last month, after an upwardly revised 292,000 surge in June. Economists polled by Reuters forecast an increase of 180,000 in July.
"Another constructive U.S. labor market report is a welcome development for Fed officials, with tentative signs of growing wage pressures particularly appealing to the hawks," said Viraj Patel, FX strategist at ING Wholesale Banking in London.
"Moreover, today's release couldn't have come at a better time for a flailing dollar, which has been under pressure since last week's soft Q2 GDP (data)," he added.
After the U.S. employment report, Fed fund futures priced in an 18 percent chance the Fed will hike rates at its policy meeting next month, from 9 percent late Thursday, according to the CME's FedWatch tool. For the December meeting, futures showed a roughly 47 percent probability of a hike, compared with about 32 percent late Wednesday.
But Brian Dolan, chief of financial education and head market strategist at DriveWealth LLC in Chatham, New Jersey, believes the "odds remain stacked" against a Fed rate hike this year, given the struggling global economic picture.
But he noted that risk sentiment will improve with the jobs data and the dollar should stabilize after recent declines.
In late trading, the dollar index .DXY rose 0.5 percent to 96.212, recovering from last week's poor showing when it fell 2 percent for its worst weekly performance since April.
Against the yen, the dollar rose 0.6 percent to 101.77 yen. The dollar posted it largest one-day gain in more than a week.
The greenback also hit a one-week high against the Swiss franc. The dollar was last at 0.9796 franc, up 0.6 percent.
The euro, meanwhile, slid to a one-week low against the dollar and last traded at $1.1088, down 0.3 percent.
MPC opens the door to one more futile gesture
by Fathom Consulting
At noon Thursday, the MPC unveiled a package of measures, including a 25 basis point cut in Bank Rate to 0.25%, and more QE. Governor Carney made clear that further cuts were possible, almost to zero. The package was similar in scale to what we had expected, but larger than had been priced in by investors. Gilt yields, and sterling fell further. Given the hype, Thursday’s move was perhaps inevitable. But the impact on the macro-economy will be vanishingly small. We are now at the point where monetary policy, by itself, can do no more.

On Thursday, the UK Monetary Policy Committee voted unanimously to cut Bank Rate by 25 basis points, in line with both Fathom and market expectations. This marked the first such move since March 2009, when interest rates were cut to 0.5%. Additionally, the Committee voted to increase quantitative easing of government bonds by £60 billion, and to purchase up to £10 billion of corporate bonds. This is similar in scale to what we had expected, but larger than had been priced in by investors.
A new ‘Term Funding Scheme’ (TFS) was also announced. It is similar in design to the euro area’s Targeted Long Term Refinancing Operation, and should lower the rate of interest that banks and building societies pay to fund their liabilities. Although this will help counteract the squeeze on banks’ profit margins caused by low rates of interest, the scheme is unlikely to increase lending. It may, however, reduce the cost of credit provided by banks, and at the very least help reduce any disincentive for banks to lend.
Financial market reaction
The financial market implications were broadly in line with those that we set out earlier this week. On Thursday, the pound fell 1.7% against the US dollar, to around USD1.31, after recovering a little as Carney implied that he would not pursue a negative interest rate policy. He said that the Bank sees the lower bound for interest rates “a little above zero”. The pound has also fallen around 1.4% against the euro, with EURGBP rising to 0.8490.

Gilt yields have fallen, with the ten-year benchmark falling from 0.81% to hit a record low below 0.65%. A similar impact has been seen across the rest of the gilt curve, with the Bank announcing that its gilt purchases would be across all maturities, using the same buckets and rules as in previous episodes of QE.

We had hoped for, but not expected, the Bank to announce a more nuanced approach to gilt purchases that we have dubbed ‘Operation Anti-Twist’. By concentrating purchases at the short-end, it would limit the negative impact on life insurers and pension funds. Interestingly, the Pension Protection Fund estimates that the deficits of defined benefit schemes widened from £294.6 billion to £383.6 billion in the month of June. They are likely to widen further as a result of Thursday’s announcement. The requirement for scheme sponsors to make good on these deficits may well divert funds from more productive activities, such as investment. For this reason, the Bank’s expansion of conventional QE may even prove counter-productive.
But, as we highlighted in a note to clients on Tuesday, given the hype around Thursday’s monetary policy meeting, a decision to do nothing would have damaged the Bank’s credibility, and ruffled investors. As Charles Goodhart, former MPC member, highlighted at our Monetary Policy Forum earlier this week, the Bank had “rather boxed itself in.” With that in mind, it is perhaps for the best that the MPC loosened policy, even though we believe that it will be of little economic benefit. In the long-run, interest rates will probably need to be higher in order to help solve the productivity crisis.
Recession ahead?
As part of Thursday’s Inflation Report, the MPC set out its central projections for the likely path of the UK economy to 2018. Its modal forecast for GDP growth was revised down by 1.5 percentage points next year, from 2.3% to 0.8%, with growth bouncing back to 1.8% in 2018. Although the MPC is a little more optimistic than us, we agree that the UK economy will dodge technical recession. Indeed, under our central scenario, a serious downturn is avoided as further falls in sterling help cushion the blow from reduced investment and consumption — a likely consequence of heightened uncertainty following the Brexit vote.

If further loosening is needed, it should be fiscal rather than monetary
We believe that the emphasis on monetary policy to stimulate the economy and defend against the fallout from the EU referendum result is wrong-headed, with the macroeconomic benefits of the stimulus announced Thursday likely to be minimal. In particular, we would question the efficacy of cutting interest rates further when the source of the downturn is uncertainty. But having ‘boxed themselves in’, failure to loosen would have damaged credibility. In such an environment, fiscal policy is likely to be better suited to the task in hand. Promisingly, the new Chancellor, Philip Hammond, is calling for a ‘fiscal reset’. Some fiscal expansion, or at least a slowing in the rate of fiscal contraction, is highly likely in our view.
COT Report
This information currently seems interesting and important. As we can see on chart, net speculative shorts have reached extreme levels since 2008. While speculative position was becoming shorter - open interest was decreasing, that leads us to conclusion about closing longs on a way down, while opening of new shorts pace was moderate.
Most important for us is that we have net speculative short position near extreme levels. As we've discsussed this subject on gold market, when this happens, usually market turns to opposite action with moderate retracement or even reversal. Something of that sort we could expect on GBP. Although in our case we mostly should speak about moderate retracement probably. Thus, we should be careful to possible upside reversal patterns on charts.

Technicals
Monthly
So guys, our long-term forecast, that we've created in 2011 in our Military Forex Course, based on Elliot Waves has been completed:
Long Term Forecast on GBP rate
Right now monthly trend is bearish, but market is not at oversold on monthly chart. We've said that lows will not survive because market has all-time 0.618 AB=CD target below them, so that has happened. Market has dropped and right now stands there, no W&R.
Overall picture looks bearish by some signs. First is - acceleration down to AB-CD target. Usually fast drop on this point tells that market has chances to continue to AB=CD target, which stands at 1.06 area, and we think that it will be reached within some years. The point is if you will take a look at all-time GBP chart, you'll see that market already has broken major 5/8 Fib support and on a way down, drop is really fast since first leg was on 2008 crisis. Overall fundamental situation is mostly supportive to this scenario, besides, 20 points is not really big distance to GBP that is more volatile than many other major currencies:
That's why technically there is nothing impossible with 1.06 area. - that will be AB=CD on a way down.
Second stands for shorter-term perspective. GBP has dropped below YPS1 and this indicates starting of new bearish trend, not just a retracement down, but trend.
Swings right now are so large, that monthly chart let's us talk on very long-term perspective and does not bring any clarity on shorter-term perspective.
As it is suggested by COT, we still should be ready for upside bounce. In general, we have being waiting for it quite some time already, because this upside bounce should become final step in our daily trading plan.
So, as no bounce has happened yet, in short-term perspective market could try to reach another AB-CD 0.618 traget. Initially we were focused on AB-CD pattern with 1.3080 target since it was more probable. As GBP has hit it already but shows no reaction, it could mean that A'B-CD target around 1.2450 area also could be hit, if we adjust our initial "A" point and shift it to "A' " as it is shown on the chart.

Weekly
Weekly chart shows very interesting information, and explains why our monthly AB-CD works. Actually guys, here we have rare pattern that calls Volatility Breakout (VOB). Those of you who follows our gold analysis knows that we've traded VOB on gold within 2 years and it has reached it's target around 1000$. Now GBP stands near its target as well:

Weekly chart was strongly oversold and major question is - do we have another VOB on Brexit? Usually VOB is absolute breakout as it was in 2008. Current breakout is smaller. But I think that we could treat it as VOB because more than 250 bars (weeks) has passed since first breakout. Although current VOB could be a bit weaker, but still it could have a downward continuation. It means that market could drop even lower than our monthly 1.3080 target, that is in general agrees with fundamental trend in UK economy. To understand how much lower - we need to get upside retracement first after VOB, to get AB-CD and calculate 0.618 extension target. In fact, upside action from 2008 till 2016 precisely was this "retracement" after VOB... As soon as we've got it - we've estimated 1.3080 target that currently is completed... Overall bearish Brexit impulse is also strong and sooner or later but it will get continuation, supported by BoE and MPC fiscal policy. Thus, technical VOB pattern is not isolated but supported by fundamental issues as well. Target of new VOB pattern could coincide, say, with monthly AB=CD around 1.06 area, we can't exclude this possibility.
Right now we just need to watch for upside bounce and estimate next target on VOB AB-CD that we should get.
Daily
On daily picture we have some interesting moments, that we could treat as confirmation of bearish sentiment. As BoE cut the rates, GBP has dropped. Recent action mostly reminds bearish dynamic pressure, because after Brexit collapse trend has turned bullish but price action mostly stands flat.
Last week market has dropped below MPP. It seems that market should create some reversal pattern before upside retracement will happen. It is high probability that it could be butterfly "Buy" pattern. 161.8% target coincides with huge AB-CD destination on monthly chart. May be appearing of butterfly will lead to H&S pattern.

4-hour
Here is another sign of weakness probably. Initially we thought that GBP forms reverse H&S pattern and until Head has been formed, everything was fine. Problems has started when right shoulder has started to form. It has become too extended in time. Finally, when market has touched neckline - it was not able to break through and dropped. This is very important step to possible H&S failure and further drop.

That's being said, currently it would be better to avoid long entry, at least until situation with bearish patterns will be resolved. Still, we mostly would like to get good entry point for short entry, rather then trade GBP long right now.
Conclusion:
That's being said, we confirm our bearish view on GBP that even has become worse as procedure of EU leaving has started. Based on patterns that we have right now we could make a conclusion that this is really possible that cable will reach 1-1.05 area within 3-5 years. Our first 1.3080 target that we've estimated in 2011 has been completed.
In short-term perspective, as market has failed to from immediate upside retracement, GBP could try to touch another 0.618 monthly AB-CD target around 1.2450 and then turn to upside retracement. At least some patterns have started to form that point on this scenario. Currently we think that it will be better to avoid long positions on cable.
The technical portion of Sive's analysis owes a great deal to Joe DiNapoli's methods, and uses a number of Joe's proprietary indicators. Please note that Sive's analysis is his own view of the market and is not endorsed by Joe DiNapoli or any related companies.
(Reuters) - The dollar rallied across the board on Friday after data showed U.S. employment increased more than expected in July and wages picked up, raising the probability of an interest rate hike from the Federal Reserve this year.
The dollar hit one-week peaks against the euro and the Swiss franc, and turned positive versus the yen after the jobs data.
U.S. non-farm payrolls increased by 255,000 jobs last month, after an upwardly revised 292,000 surge in June. Economists polled by Reuters forecast an increase of 180,000 in July.
"Another constructive U.S. labor market report is a welcome development for Fed officials, with tentative signs of growing wage pressures particularly appealing to the hawks," said Viraj Patel, FX strategist at ING Wholesale Banking in London.
"Moreover, today's release couldn't have come at a better time for a flailing dollar, which has been under pressure since last week's soft Q2 GDP (data)," he added.
After the U.S. employment report, Fed fund futures priced in an 18 percent chance the Fed will hike rates at its policy meeting next month, from 9 percent late Thursday, according to the CME's FedWatch tool. For the December meeting, futures showed a roughly 47 percent probability of a hike, compared with about 32 percent late Wednesday.
But Brian Dolan, chief of financial education and head market strategist at DriveWealth LLC in Chatham, New Jersey, believes the "odds remain stacked" against a Fed rate hike this year, given the struggling global economic picture.
But he noted that risk sentiment will improve with the jobs data and the dollar should stabilize after recent declines.
In late trading, the dollar index .DXY rose 0.5 percent to 96.212, recovering from last week's poor showing when it fell 2 percent for its worst weekly performance since April.
Against the yen, the dollar rose 0.6 percent to 101.77 yen. The dollar posted it largest one-day gain in more than a week.
The greenback also hit a one-week high against the Swiss franc. The dollar was last at 0.9796 franc, up 0.6 percent.
The euro, meanwhile, slid to a one-week low against the dollar and last traded at $1.1088, down 0.3 percent.
MPC opens the door to one more futile gesture
by Fathom Consulting
At noon Thursday, the MPC unveiled a package of measures, including a 25 basis point cut in Bank Rate to 0.25%, and more QE. Governor Carney made clear that further cuts were possible, almost to zero. The package was similar in scale to what we had expected, but larger than had been priced in by investors. Gilt yields, and sterling fell further. Given the hype, Thursday’s move was perhaps inevitable. But the impact on the macro-economy will be vanishingly small. We are now at the point where monetary policy, by itself, can do no more.
On Thursday, the UK Monetary Policy Committee voted unanimously to cut Bank Rate by 25 basis points, in line with both Fathom and market expectations. This marked the first such move since March 2009, when interest rates were cut to 0.5%. Additionally, the Committee voted to increase quantitative easing of government bonds by £60 billion, and to purchase up to £10 billion of corporate bonds. This is similar in scale to what we had expected, but larger than had been priced in by investors.
A new ‘Term Funding Scheme’ (TFS) was also announced. It is similar in design to the euro area’s Targeted Long Term Refinancing Operation, and should lower the rate of interest that banks and building societies pay to fund their liabilities. Although this will help counteract the squeeze on banks’ profit margins caused by low rates of interest, the scheme is unlikely to increase lending. It may, however, reduce the cost of credit provided by banks, and at the very least help reduce any disincentive for banks to lend.
Financial market reaction
The financial market implications were broadly in line with those that we set out earlier this week. On Thursday, the pound fell 1.7% against the US dollar, to around USD1.31, after recovering a little as Carney implied that he would not pursue a negative interest rate policy. He said that the Bank sees the lower bound for interest rates “a little above zero”. The pound has also fallen around 1.4% against the euro, with EURGBP rising to 0.8490.
Gilt yields have fallen, with the ten-year benchmark falling from 0.81% to hit a record low below 0.65%. A similar impact has been seen across the rest of the gilt curve, with the Bank announcing that its gilt purchases would be across all maturities, using the same buckets and rules as in previous episodes of QE.
We had hoped for, but not expected, the Bank to announce a more nuanced approach to gilt purchases that we have dubbed ‘Operation Anti-Twist’. By concentrating purchases at the short-end, it would limit the negative impact on life insurers and pension funds. Interestingly, the Pension Protection Fund estimates that the deficits of defined benefit schemes widened from £294.6 billion to £383.6 billion in the month of June. They are likely to widen further as a result of Thursday’s announcement. The requirement for scheme sponsors to make good on these deficits may well divert funds from more productive activities, such as investment. For this reason, the Bank’s expansion of conventional QE may even prove counter-productive.
But, as we highlighted in a note to clients on Tuesday, given the hype around Thursday’s monetary policy meeting, a decision to do nothing would have damaged the Bank’s credibility, and ruffled investors. As Charles Goodhart, former MPC member, highlighted at our Monetary Policy Forum earlier this week, the Bank had “rather boxed itself in.” With that in mind, it is perhaps for the best that the MPC loosened policy, even though we believe that it will be of little economic benefit. In the long-run, interest rates will probably need to be higher in order to help solve the productivity crisis.
Recession ahead?
As part of Thursday’s Inflation Report, the MPC set out its central projections for the likely path of the UK economy to 2018. Its modal forecast for GDP growth was revised down by 1.5 percentage points next year, from 2.3% to 0.8%, with growth bouncing back to 1.8% in 2018. Although the MPC is a little more optimistic than us, we agree that the UK economy will dodge technical recession. Indeed, under our central scenario, a serious downturn is avoided as further falls in sterling help cushion the blow from reduced investment and consumption — a likely consequence of heightened uncertainty following the Brexit vote.
If further loosening is needed, it should be fiscal rather than monetary
We believe that the emphasis on monetary policy to stimulate the economy and defend against the fallout from the EU referendum result is wrong-headed, with the macroeconomic benefits of the stimulus announced Thursday likely to be minimal. In particular, we would question the efficacy of cutting interest rates further when the source of the downturn is uncertainty. But having ‘boxed themselves in’, failure to loosen would have damaged credibility. In such an environment, fiscal policy is likely to be better suited to the task in hand. Promisingly, the new Chancellor, Philip Hammond, is calling for a ‘fiscal reset’. Some fiscal expansion, or at least a slowing in the rate of fiscal contraction, is highly likely in our view.
COT Report
This information currently seems interesting and important. As we can see on chart, net speculative shorts have reached extreme levels since 2008. While speculative position was becoming shorter - open interest was decreasing, that leads us to conclusion about closing longs on a way down, while opening of new shorts pace was moderate.
Most important for us is that we have net speculative short position near extreme levels. As we've discsussed this subject on gold market, when this happens, usually market turns to opposite action with moderate retracement or even reversal. Something of that sort we could expect on GBP. Although in our case we mostly should speak about moderate retracement probably. Thus, we should be careful to possible upside reversal patterns on charts.
Technicals
Monthly
So guys, our long-term forecast, that we've created in 2011 in our Military Forex Course, based on Elliot Waves has been completed:
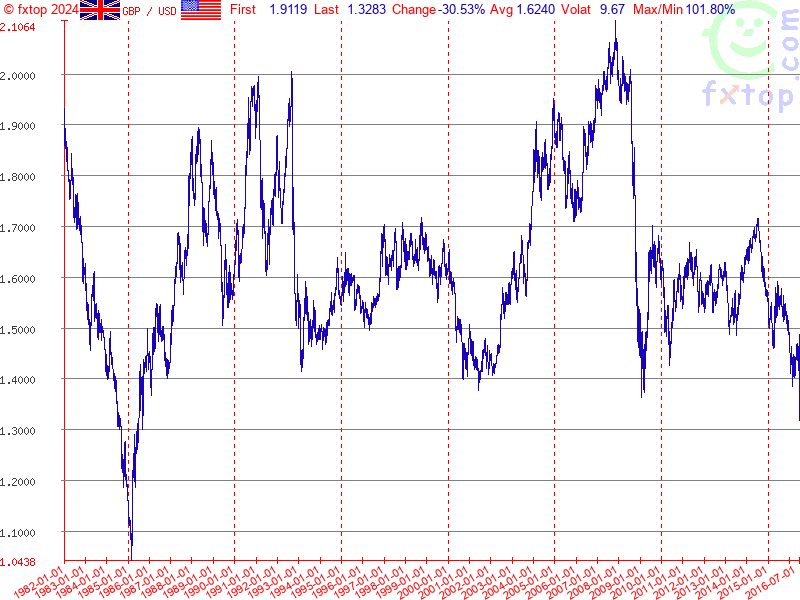
Long Term Forecast on GBP rate
Right now monthly trend is bearish, but market is not at oversold on monthly chart. We've said that lows will not survive because market has all-time 0.618 AB=CD target below them, so that has happened. Market has dropped and right now stands there, no W&R.
Overall picture looks bearish by some signs. First is - acceleration down to AB-CD target. Usually fast drop on this point tells that market has chances to continue to AB=CD target, which stands at 1.06 area, and we think that it will be reached within some years. The point is if you will take a look at all-time GBP chart, you'll see that market already has broken major 5/8 Fib support and on a way down, drop is really fast since first leg was on 2008 crisis. Overall fundamental situation is mostly supportive to this scenario, besides, 20 points is not really big distance to GBP that is more volatile than many other major currencies:
That's why technically there is nothing impossible with 1.06 area. - that will be AB=CD on a way down.
Second stands for shorter-term perspective. GBP has dropped below YPS1 and this indicates starting of new bearish trend, not just a retracement down, but trend.
Swings right now are so large, that monthly chart let's us talk on very long-term perspective and does not bring any clarity on shorter-term perspective.
As it is suggested by COT, we still should be ready for upside bounce. In general, we have being waiting for it quite some time already, because this upside bounce should become final step in our daily trading plan.
So, as no bounce has happened yet, in short-term perspective market could try to reach another AB-CD 0.618 traget. Initially we were focused on AB-CD pattern with 1.3080 target since it was more probable. As GBP has hit it already but shows no reaction, it could mean that A'B-CD target around 1.2450 area also could be hit, if we adjust our initial "A" point and shift it to "A' " as it is shown on the chart.
Weekly
Weekly chart shows very interesting information, and explains why our monthly AB-CD works. Actually guys, here we have rare pattern that calls Volatility Breakout (VOB). Those of you who follows our gold analysis knows that we've traded VOB on gold within 2 years and it has reached it's target around 1000$. Now GBP stands near its target as well:
Weekly chart was strongly oversold and major question is - do we have another VOB on Brexit? Usually VOB is absolute breakout as it was in 2008. Current breakout is smaller. But I think that we could treat it as VOB because more than 250 bars (weeks) has passed since first breakout. Although current VOB could be a bit weaker, but still it could have a downward continuation. It means that market could drop even lower than our monthly 1.3080 target, that is in general agrees with fundamental trend in UK economy. To understand how much lower - we need to get upside retracement first after VOB, to get AB-CD and calculate 0.618 extension target. In fact, upside action from 2008 till 2016 precisely was this "retracement" after VOB... As soon as we've got it - we've estimated 1.3080 target that currently is completed... Overall bearish Brexit impulse is also strong and sooner or later but it will get continuation, supported by BoE and MPC fiscal policy. Thus, technical VOB pattern is not isolated but supported by fundamental issues as well. Target of new VOB pattern could coincide, say, with monthly AB=CD around 1.06 area, we can't exclude this possibility.
Right now we just need to watch for upside bounce and estimate next target on VOB AB-CD that we should get.
Daily
On daily picture we have some interesting moments, that we could treat as confirmation of bearish sentiment. As BoE cut the rates, GBP has dropped. Recent action mostly reminds bearish dynamic pressure, because after Brexit collapse trend has turned bullish but price action mostly stands flat.
Last week market has dropped below MPP. It seems that market should create some reversal pattern before upside retracement will happen. It is high probability that it could be butterfly "Buy" pattern. 161.8% target coincides with huge AB-CD destination on monthly chart. May be appearing of butterfly will lead to H&S pattern.
4-hour
Here is another sign of weakness probably. Initially we thought that GBP forms reverse H&S pattern and until Head has been formed, everything was fine. Problems has started when right shoulder has started to form. It has become too extended in time. Finally, when market has touched neckline - it was not able to break through and dropped. This is very important step to possible H&S failure and further drop.
That's being said, currently it would be better to avoid long entry, at least until situation with bearish patterns will be resolved. Still, we mostly would like to get good entry point for short entry, rather then trade GBP long right now.
Conclusion:
That's being said, we confirm our bearish view on GBP that even has become worse as procedure of EU leaving has started. Based on patterns that we have right now we could make a conclusion that this is really possible that cable will reach 1-1.05 area within 3-5 years. Our first 1.3080 target that we've estimated in 2011 has been completed.
In short-term perspective, as market has failed to from immediate upside retracement, GBP could try to touch another 0.618 monthly AB-CD target around 1.2450 and then turn to upside retracement. At least some patterns have started to form that point on this scenario. Currently we think that it will be better to avoid long positions on cable.
The technical portion of Sive's analysis owes a great deal to Joe DiNapoli's methods, and uses a number of Joe's proprietary indicators. Please note that Sive's analysis is his own view of the market and is not endorsed by Joe DiNapoli or any related companies.