Sive Morten
Special Consultant to the FPA
- Messages
- 18,669
Fundamentals
This was interesting and dramatic week, guys. Jerome Powell has shaken markets by surprising statement that US rate is near neutral level. We discuss impact of this statement below. Starting of G 20 could bring big surprises. I think that A. Merkel plane issue, turmoil in France, M. Cohen statement that forced D. Trump cancel V. Putin meeting and Israel poor strike in Syria yesterday are the events of the same chain.
Yesterday was a monitoring session for us, as we would like to see how strong and durable J. Powell impact will be. According to our trading plan - EUR has failed to continue upside action and stronger drop has happened.
Reuters reports that dollar has risen as investors prepared for the outcome of trade talks between the United States and China at the G20 meeting on Saturday, which investors expect will increase volatility across markets.
U.S. President Donald Trump said on Friday there were some good signs ahead of the meeting with Chinese President Xi Jinping.
“We’re working very hard. If we could make a deal, that would be good. I think they want to. I think we’d like to. We’ll see,” he said.
Trade Representative Robert Lighthizer said on Friday he would be surprised if Saturday’s dinner between Trump and Jinping “wasn’t a success.”
“For now, really, the trade issue seems to be a dominant theme swaying sentiment,” said Mazen Issa, senior FX strategist at TD Securities in New York. “If you have any sort of news or headlines that is indicative of a positive or negative outcome, I think markets are going to react accordingly.”
Credit Suisse strategists expect the Chinese currency to weaken to a decade low of 7.20 per dollar by end-2019.
Data on Friday showed growth in China’s vast manufacturing sector stalled for the first time in over two years in November as new orders slowed, piling pressure on Beijing ahead of the trade talk.
Investors are also continuing to evaluate comments by Federal Reserve Chairman Jerome Powell on Wednesday that the U.S. central bank’s policy rate is now “just below” neutral, a level that neither brakes nor boosts a healthy U.S. economy.
The immediate reaction sent the dollar tumbling as investors saw the Fed as likely to end its rate-hiking cycle sooner than previously expected.
Interest rate futures traders are now pricing for only one rate hike in 2019, according to the CME Group’s FedWatch Tool, below Fed projections of three increases during the year.
Indeed, guys - while Dec 2018 rate increase chances stands at the same 82% - Probability of another 25 b.p. increase by the end of 2019 stands around 40% and it stands flat through whole 2019 year, which means that market now expects only one rate change in 2019:

Some analysts see the move as exaggerated, however, with the Fed more likely to let economic data guide it on when to pause tightening.
“There’s no denying that the Fed rhetoric has changed in recent weeks, but we don’t think it’s changed quite as much as the repricing in rates suggests it has,” said Adam Cole, chief currency strategist at RBC Capital Markets in London.
The followers of Fed hawkish policy hope that so-called neutral level is rather wide - 2.5-3.5% and there is pretty much room for 2-3 rate change in 2019.
COT Report
Recent data shows increasing of net short position on EUR, although the change value is not very significant:

Source: cftc.gov
Charting by Investing.com
Table data give the following information:

As you can see the vast part of change comes from long closing by speculators. Hedgers open shorts and longs in equal amount. Speculative shorts were increased insignificantly.
Overall sentiment is moderately bearish and tells that investors expects neither upside continuation on EUR on coming week, nor too strong drop.
Finally, we enter in December guys, and 13th we will get ECB meeting where the future of ECB QE programme should be clarified. Fathom consulting provides interesting review on national debt of EU countries. If QE programme will be closed - default spreads could widen, especially for countries like Italy, Spain and Ireland:
Fathom’s Sovereign Fragility Index (SFI) aims to provide an objective measure of the underlying risk attached to government debt. Therefore, a comparison of the SFI-implied and observed spreads is one way to observe the effects of unconventional monetary policy and swings in market sentiment.
At present, government bond yields remain significantly below the levels implied by the SFI across most of the euro area periphery with financing conditions relatively benign. Italy, however, remains an exception to this with ten-year yields remaining above the 2.5% predicted by the SFI, amid the political uncertainty generated by the government’s confrontation with the EU.

Nevertheless, the SFI suggests that Italian spreads have overshot and that the government’s debt is not the riskiest prospect in the euro area. Indeed, the SFI actually predicts higher yields for Spain (3.3%), despite that country having lower public debt. This is because it is the composition, as well as the quantity, of debt that matters for the SFI, with Spain having a higher proportion of debt held externally than Italy does.
The SFI also suggests that Irish debt is relatively fragile, with an SFI-implied yield of 2.5%. Arguably, even this is too low. As previous Fathom research has shown, official GDP data have a tendency to overstate the size of the Irish economy, arguably flattering the state of the country’s public finances. Indeed, if the SFI is recalculated using Fathom’s Measure of Irish National Income, as opposed to official estimates, then the SFI-implied yield would be above 5%.

Arguably, markets have been underestimating the fragility of periphery sovereigns for some time, with a combination of Draghi’s “whatever it takes” commitment and the ECB’s quantitative easing programme having succeeded in keeping spreads low. It seems unlikely that this can be maintained indefinitely, especially if the ECB ceases net asset purchases (as expected) in December.
Technical analysis
Monthly
Trend on monthly chart stands bearish. Here we have long-term COP target around 1.03 area, but within recent 4-5 months EUR is coiling around strong support area of 0.5-0.618% Fib support, YPP and natural support/resistance zone of 1.03-1.15 consolidation. Couple weeks ago market has shown nice upside bounce which makes us think that support area has not been broken totally yet.
But right no we have to acknowledge that we do not see active upside continuation, but price is coiling around recent lows which means that W&R setup is loosing momentum. When some potentially bullish pattern doesn't work properly it usually becomes bearish. This situation tells that chances on fast jump out from wide monthly consolidation and above 1.15 are melting.
Once market breaks 1.13 lows - downside road to 1.03 area will open, because EUR will return back in wide consolidation without significant barriers, except maybe YPS1 around 1.08. Currently it seems that there are more chances that this will happen rather than not.

Weekly
Weekly setup mostly stands the same and our bearish grabber is still valid. As we said last week - it contradicts to daily reverse H&S pattern. But this week daily pattern has got obvious flaw, which means that upside action on a back of Powell's comments was not upside continuation but retracement of previous drop and chance to go short with weekly pattern. This week grabber's perspectives look better.
Its target suggests drop below recent lows and probable reaching of 1.1185 major 5/8 Fib support.

Daily
Here is the same picture that we've discussed through the week. Although upside jump around 1.13 was surprising but it is matched to H&S idea. Now we have the opposite situation - sell-off on Friday. It was not a surprise and we've mentioned it in daily video, but - it is too strong. In fact on a way down market has broken all internal Fib levels, which doesn't agree with normal behavior of H&S pattern. It is irrational from market mechanics point of view. Bulls has to control market and develop upside progress. Any sell-off at this point tells that something is wrong here.
If we add weak sentiment and bearish weekly pattern - this creates mostly bearish context, at least it is difficult to find any reasons to go long in such circumstance. Any bullish view now demands big EUR efforts to prove its ambitions, while bearish context almost stands on the table.
Breaking of recent lows will become important confirmation of this scenario.

Intraday
This time intraday setup will be interesting to active traders. On daily picture everything is relatively clear - breaking through 1.13 lows creates bearish context. While here, on intraday charts we discuss bullish context. It is accompanied significant value of risk as we've mentioned above, but game is not over until market keeps valid recent lows.
Currently we can't talk definitely about reasons, why upside reversal could happen and what driving factors will trigger it, but, if somehow it will happen - we could get the following picture:

Now, after solid thrust down market stands at 5/8 support and here we could watch for DRPO "Buy" pattern. Once it will be formed, it could serve us twofold. First is - as separate trading setup for long entry. Second - if DRPO will fail, this also will be an indicator that bullish setup is not realized.

That's being said, guys, choose what you like more, depending on your personality - either active trading based on intraday patterns, or, just wait for clarity on the daily and take corresponding position.
Conclusion:
Overall background is more supportive to bearish setup. But, as bullish picture has not been erased totally, we should be careful and keep an eye on crucial levels and breakeven points, such as 1.13 lows in particular.
The technical portion of Sive's analysis owes a great deal to Joe DiNapoli's methods, and uses a number of Joe's proprietary indicators. Please note that Sive's analysis is his own view of the market and is not endorsed by Joe DiNapoli or any related companies.
This was interesting and dramatic week, guys. Jerome Powell has shaken markets by surprising statement that US rate is near neutral level. We discuss impact of this statement below. Starting of G 20 could bring big surprises. I think that A. Merkel plane issue, turmoil in France, M. Cohen statement that forced D. Trump cancel V. Putin meeting and Israel poor strike in Syria yesterday are the events of the same chain.
Yesterday was a monitoring session for us, as we would like to see how strong and durable J. Powell impact will be. According to our trading plan - EUR has failed to continue upside action and stronger drop has happened.
Reuters reports that dollar has risen as investors prepared for the outcome of trade talks between the United States and China at the G20 meeting on Saturday, which investors expect will increase volatility across markets.
U.S. President Donald Trump said on Friday there were some good signs ahead of the meeting with Chinese President Xi Jinping.
“We’re working very hard. If we could make a deal, that would be good. I think they want to. I think we’d like to. We’ll see,” he said.
Trade Representative Robert Lighthizer said on Friday he would be surprised if Saturday’s dinner between Trump and Jinping “wasn’t a success.”
“For now, really, the trade issue seems to be a dominant theme swaying sentiment,” said Mazen Issa, senior FX strategist at TD Securities in New York. “If you have any sort of news or headlines that is indicative of a positive or negative outcome, I think markets are going to react accordingly.”
Credit Suisse strategists expect the Chinese currency to weaken to a decade low of 7.20 per dollar by end-2019.
Data on Friday showed growth in China’s vast manufacturing sector stalled for the first time in over two years in November as new orders slowed, piling pressure on Beijing ahead of the trade talk.
Investors are also continuing to evaluate comments by Federal Reserve Chairman Jerome Powell on Wednesday that the U.S. central bank’s policy rate is now “just below” neutral, a level that neither brakes nor boosts a healthy U.S. economy.
The immediate reaction sent the dollar tumbling as investors saw the Fed as likely to end its rate-hiking cycle sooner than previously expected.
Interest rate futures traders are now pricing for only one rate hike in 2019, according to the CME Group’s FedWatch Tool, below Fed projections of three increases during the year.
Indeed, guys - while Dec 2018 rate increase chances stands at the same 82% - Probability of another 25 b.p. increase by the end of 2019 stands around 40% and it stands flat through whole 2019 year, which means that market now expects only one rate change in 2019:
Some analysts see the move as exaggerated, however, with the Fed more likely to let economic data guide it on when to pause tightening.
“There’s no denying that the Fed rhetoric has changed in recent weeks, but we don’t think it’s changed quite as much as the repricing in rates suggests it has,” said Adam Cole, chief currency strategist at RBC Capital Markets in London.
The followers of Fed hawkish policy hope that so-called neutral level is rather wide - 2.5-3.5% and there is pretty much room for 2-3 rate change in 2019.
COT Report
Recent data shows increasing of net short position on EUR, although the change value is not very significant:
Source: cftc.gov
Charting by Investing.com
Table data give the following information:
As you can see the vast part of change comes from long closing by speculators. Hedgers open shorts and longs in equal amount. Speculative shorts were increased insignificantly.
Overall sentiment is moderately bearish and tells that investors expects neither upside continuation on EUR on coming week, nor too strong drop.
Finally, we enter in December guys, and 13th we will get ECB meeting where the future of ECB QE programme should be clarified. Fathom consulting provides interesting review on national debt of EU countries. If QE programme will be closed - default spreads could widen, especially for countries like Italy, Spain and Ireland:
Fathom’s Sovereign Fragility Index (SFI) aims to provide an objective measure of the underlying risk attached to government debt. Therefore, a comparison of the SFI-implied and observed spreads is one way to observe the effects of unconventional monetary policy and swings in market sentiment.
At present, government bond yields remain significantly below the levels implied by the SFI across most of the euro area periphery with financing conditions relatively benign. Italy, however, remains an exception to this with ten-year yields remaining above the 2.5% predicted by the SFI, amid the political uncertainty generated by the government’s confrontation with the EU.
Nevertheless, the SFI suggests that Italian spreads have overshot and that the government’s debt is not the riskiest prospect in the euro area. Indeed, the SFI actually predicts higher yields for Spain (3.3%), despite that country having lower public debt. This is because it is the composition, as well as the quantity, of debt that matters for the SFI, with Spain having a higher proportion of debt held externally than Italy does.
The SFI also suggests that Irish debt is relatively fragile, with an SFI-implied yield of 2.5%. Arguably, even this is too low. As previous Fathom research has shown, official GDP data have a tendency to overstate the size of the Irish economy, arguably flattering the state of the country’s public finances. Indeed, if the SFI is recalculated using Fathom’s Measure of Irish National Income, as opposed to official estimates, then the SFI-implied yield would be above 5%.
Arguably, markets have been underestimating the fragility of periphery sovereigns for some time, with a combination of Draghi’s “whatever it takes” commitment and the ECB’s quantitative easing programme having succeeded in keeping spreads low. It seems unlikely that this can be maintained indefinitely, especially if the ECB ceases net asset purchases (as expected) in December.
Technical analysis
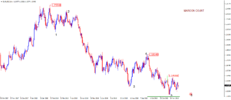
Monthly
Trend on monthly chart stands bearish. Here we have long-term COP target around 1.03 area, but within recent 4-5 months EUR is coiling around strong support area of 0.5-0.618% Fib support, YPP and natural support/resistance zone of 1.03-1.15 consolidation. Couple weeks ago market has shown nice upside bounce which makes us think that support area has not been broken totally yet.
But right no we have to acknowledge that we do not see active upside continuation, but price is coiling around recent lows which means that W&R setup is loosing momentum. When some potentially bullish pattern doesn't work properly it usually becomes bearish. This situation tells that chances on fast jump out from wide monthly consolidation and above 1.15 are melting.
Once market breaks 1.13 lows - downside road to 1.03 area will open, because EUR will return back in wide consolidation without significant barriers, except maybe YPS1 around 1.08. Currently it seems that there are more chances that this will happen rather than not.
Weekly
Weekly setup mostly stands the same and our bearish grabber is still valid. As we said last week - it contradicts to daily reverse H&S pattern. But this week daily pattern has got obvious flaw, which means that upside action on a back of Powell's comments was not upside continuation but retracement of previous drop and chance to go short with weekly pattern. This week grabber's perspectives look better.
Its target suggests drop below recent lows and probable reaching of 1.1185 major 5/8 Fib support.
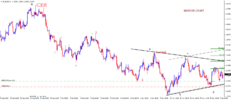
Daily
Here is the same picture that we've discussed through the week. Although upside jump around 1.13 was surprising but it is matched to H&S idea. Now we have the opposite situation - sell-off on Friday. It was not a surprise and we've mentioned it in daily video, but - it is too strong. In fact on a way down market has broken all internal Fib levels, which doesn't agree with normal behavior of H&S pattern. It is irrational from market mechanics point of view. Bulls has to control market and develop upside progress. Any sell-off at this point tells that something is wrong here.
If we add weak sentiment and bearish weekly pattern - this creates mostly bearish context, at least it is difficult to find any reasons to go long in such circumstance. Any bullish view now demands big EUR efforts to prove its ambitions, while bearish context almost stands on the table.
Breaking of recent lows will become important confirmation of this scenario.
Intraday
This time intraday setup will be interesting to active traders. On daily picture everything is relatively clear - breaking through 1.13 lows creates bearish context. While here, on intraday charts we discuss bullish context. It is accompanied significant value of risk as we've mentioned above, but game is not over until market keeps valid recent lows.
Currently we can't talk definitely about reasons, why upside reversal could happen and what driving factors will trigger it, but, if somehow it will happen - we could get the following picture:
Now, after solid thrust down market stands at 5/8 support and here we could watch for DRPO "Buy" pattern. Once it will be formed, it could serve us twofold. First is - as separate trading setup for long entry. Second - if DRPO will fail, this also will be an indicator that bullish setup is not realized.
That's being said, guys, choose what you like more, depending on your personality - either active trading based on intraday patterns, or, just wait for clarity on the daily and take corresponding position.
Conclusion:
Overall background is more supportive to bearish setup. But, as bullish picture has not been erased totally, we should be careful and keep an eye on crucial levels and breakeven points, such as 1.13 lows in particular.
The technical portion of Sive's analysis owes a great deal to Joe DiNapoli's methods, and uses a number of Joe's proprietary indicators. Please note that Sive's analysis is his own view of the market and is not endorsed by Joe DiNapoli or any related companies.