Deltoid88
Master Sergeant
- Messages
- 278
Update on EUR.
My main wave count proved incorrect, something little different may be going on with EUR right now in this correction. EUR remains tricky, but I see Stag's count as most probable one. However, maybe correction is already over and we are headed up, there is decent probability for that too.
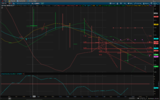
4H CHART:
View attachment 40839
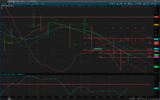
15 MIN CHART:
View attachment 40840
How to trade this?
First position: short entry in zone = 1.1370-1.1390, TP=1.130-1.1320, SL=1.1444
Second position: buy entry zone = 1.1290-1.1320, TP zone = 1.1580-1.1750, SL1=1.1265, SL2=1.1212
To sum up: I am bullish on EUR as long as 1.1212 support holds, this correction which I think is in wave 2 is very complex, and it is very difficult to guess with high probability proper wave count. Whatever is complicated is not good in trading, having that on mind task of trader should be to make things as simplest as possible. Maybe best approach is just to open long position against 1.1212 bottom and just wait as long as necessary until price action gives some clearer signs. Otherwise, if you think correction is not over, or that we are in downtrend with expectations of breaking down 1.1212 support, then just open short position on upside moves with wider SL.
Update on EUR.
I want to make small correction. I looked closer on 15 minute chart, and it looks like wave D is not in place yet, just first part of it - wave A. That is much more probable scenario. Sa, my main wave count is same like Stag's this time.
4H CHART:
15 MIN chart:
How to trade this?
SL for short position SL = 1.1444, SL for long position SL1=1.1265, SL2=1.1212. Entries and TP levels should be placed accordingly depending on the moment where we entered the position.