Sive Morten
Special Consultant to the FPA
- Messages
- 18,690
Monthly
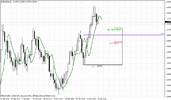
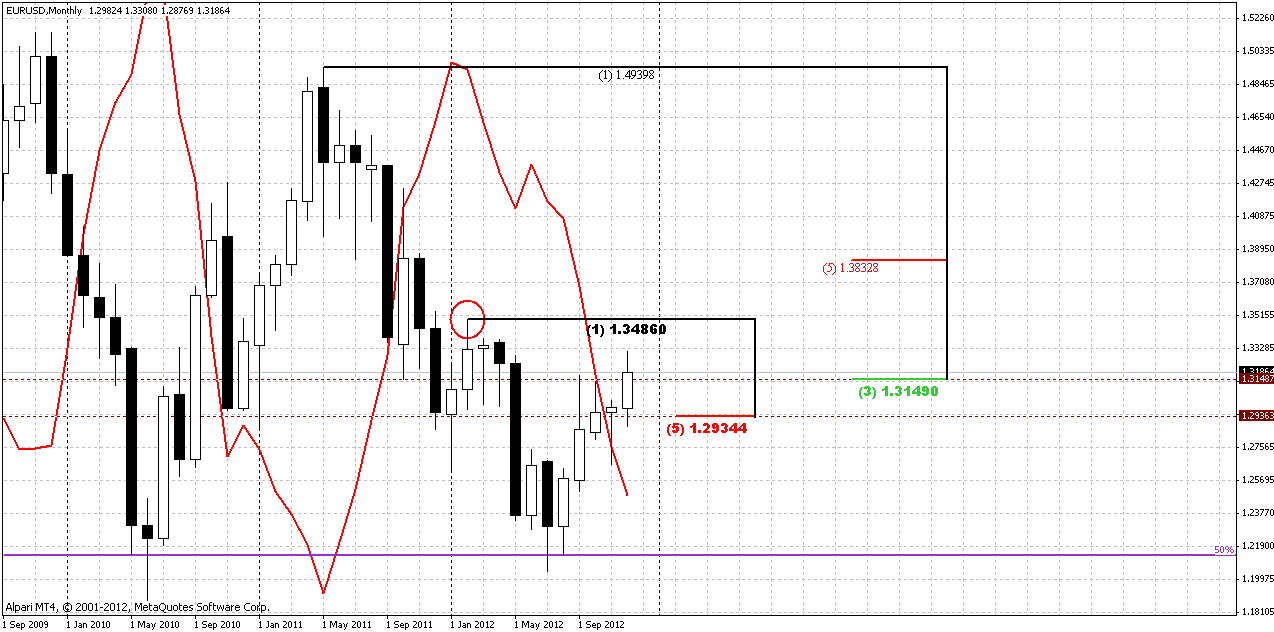
On monthly chart trend holds bullish, and within two bars we see bullish price action as well. On the past week price has done attempt to overrun upper border of K-resistance area. If market will break through it – next important level to watch is 1.3486 high. If market will show greater swing up and take out this level – that will be an appeal on reversal on monthly chart. Looks like our suggestions about potential solid bullish context more and more get confirmation from price action.
Weekly
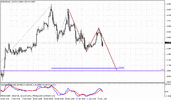
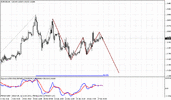
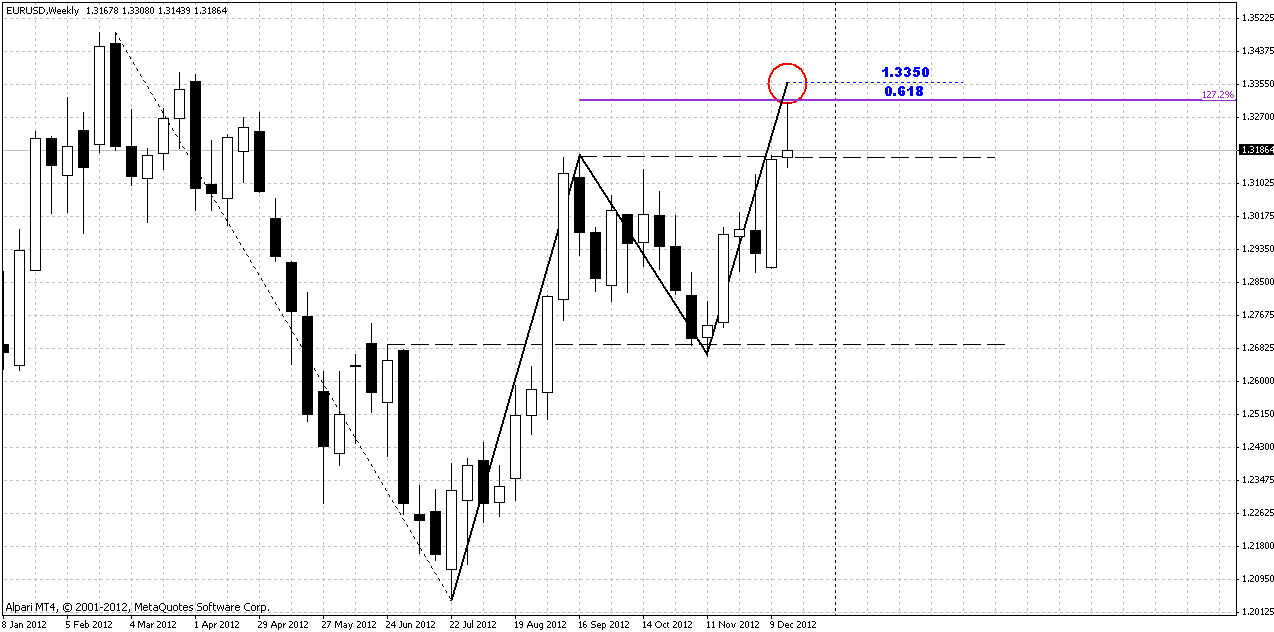
First of all, let’s take a look at this contracted chart. Here we have a lot of bullish significant moments. Trend holds bullish. Initially market has passed through 25x5 DMA and already re-tested it form the other side to confirm the real breakout. Two weeks later market has passed through upper border of 1.5 year bear channel. Breakout has happened by excellent strong candle. All recent consolidation, in fact, is a struggle with monthly Confluence resistance and on recent week market has closed above 1.3150 area, that is upper border on this K-resistance area. What other barriers does market have above? It’s not at overbought, no Monthly Pivot Resistance levels. I see only 1.3480-1.35 previous highs, next is 5/8 major resistance at 1.3830 area, that is the target of weekly AB=CD and 1.27 extension of large butterfly “Buy”.
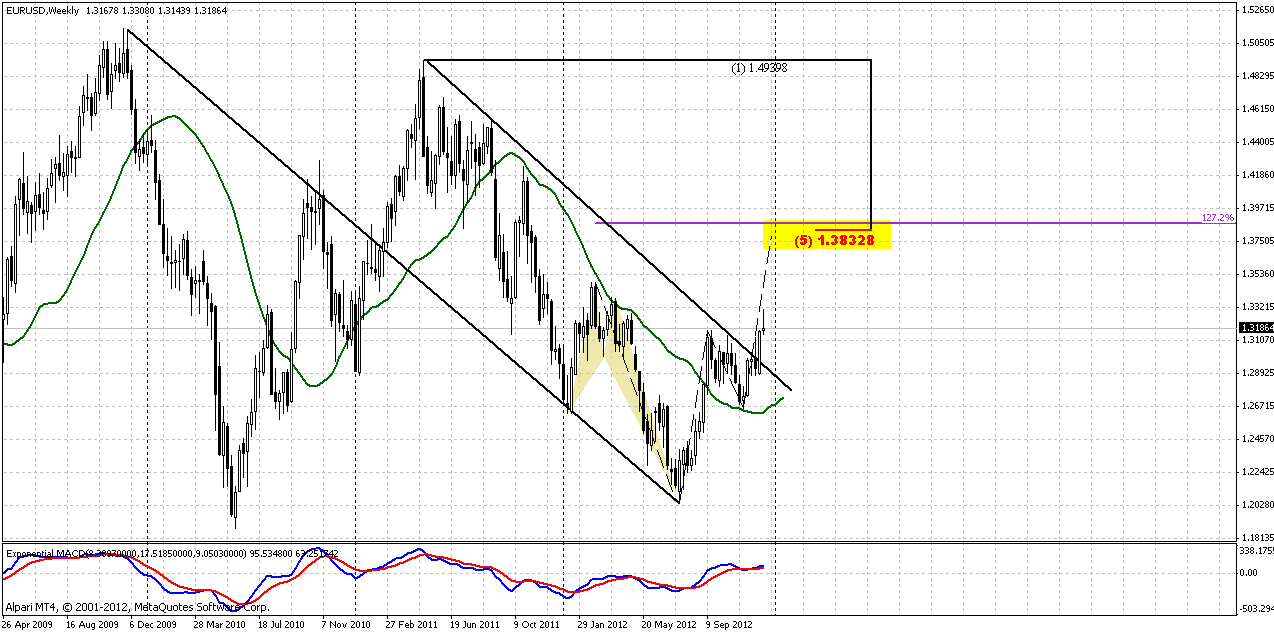
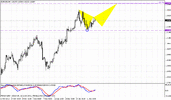
Now let’s take a look at most recent price action. Price stands in a progress with AB-CD pattern, that is also could be treated as Gartley’s “222” Buy. Price has hit resistance area of 1.3310-1.3350. This is 1.27 extension of previous swing down – particularly this level has help upward continuation. 1.3350 is 0.618 extension target, but market has not quite reached it. What do we see now? Not very fascinating sign for bulls – shooting star pattern on weekly time frame, that theoretically could easily shift to evening star pattern. If we will see this price action, it will lead market back inside of previously broken consolidation area. When shooting star is apeared, it is a burden for bulls, since commonly, you can tell that trend up will be reestablished, only if price exceeds pattern’s top. Another unpleasant moment, is that market has not even reached 0.618 extension target, that is a minor one. But does it really mean that bears are taking control? Well, one thing that could happen and will not lead to bears’ domination is retesting of broken trendline on the first chart. Downward price action could take place just for retesting it around 1.29, for instance. But now any attempt to gues it is more a gambling rather than analysis. Currently shooting star is important, that let us tell – until market will not take it high, upward trend will not be reestablish. For those, who has a bearish view and wants to open short position – this is nice invalidation point.
Daily
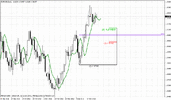
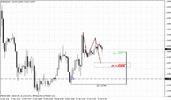
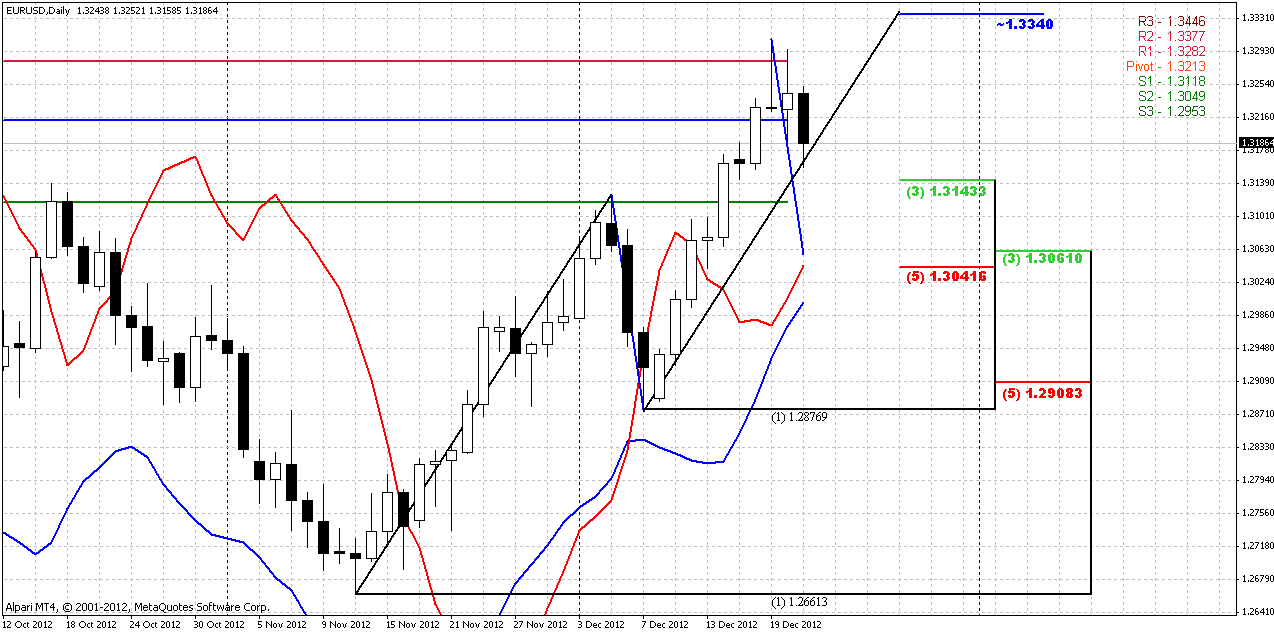
So, we have rather tricky situation. From the one point of view – all trends are bullish, I mean weekly and daily, while price action shows some bearish patterns, and looks like they take leading position, since particularly by weekly pattern price was not able even to reach minor 0.618 AB-CD extension target. Daily chart is a bit overloaded with details. We have bearish pattern on weekly, so invalidation point of this downward scenario is high at 1.3208. Here we have two major support levels. First one is at 1.3120-1.3140 – it includes WPS1 and nearest 3/8 Fib support. Second one is daily K-support area at 1.3140-1.3160. This area is very significant by some other reasons as well. Take a look at the chart – this is daily oversold and daily breakeven point. Another moment – take a look at blue lines. I’ve cloned previous retracement down and drag it to current top. Harmonic swings suggest that if market will hold the harmony retracement should not exceed the same K-support area. At the same time, weekly time frame does not exclude possible move even to 1.29 area as a possible re-testing of broken border of the channel. Based on daily time frame we can’t say more – only that retracement will probably continue and most powerful support area is 1.3140-1.3160 that has most chances to hold it.
4-hour
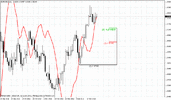
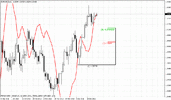
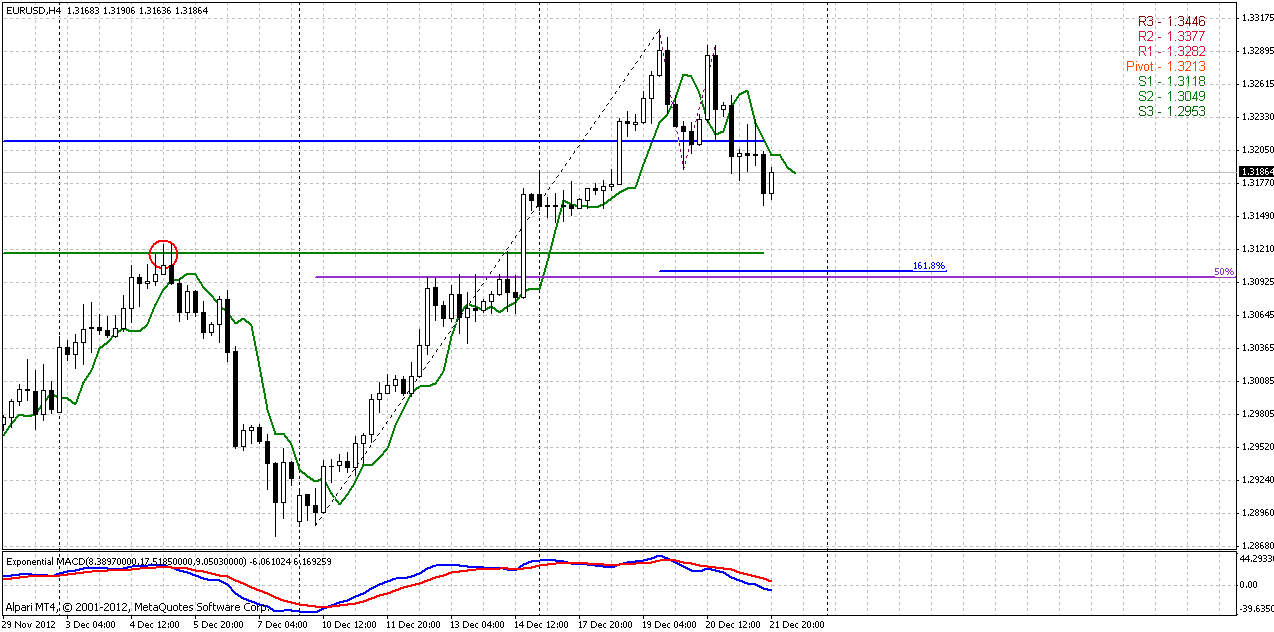
Since talks about retracement’s depth are a bit for longer-term perspective, price action on intraday chart let’s us to prepare some more or less definite strategy for beginning of the week. Recall, that on Friday we’ve disccused possibility of B&B “Buy” on daily time frame, that usually starts from significant daily support level. Lead market to this level, in turn, could DRPO look-alike pattern on 4-hour chart, and now we see that step by step price is moving to this significant support that is also minimum DRPO target – 50% support level. This area will be WPS1 as well and Agreement with 1.618 extension of 4-hour AB-CD. So, in the beginning of the week we have to be careful to any bullish reversal patterns around 1.31.
Only when (and if) B&B pattern will be finished we could start think about whether it shift to some greater downward AB-CD or market will continue move up, i.e. about retracement’s depth.
Conclusion:
Currently we have to major tasks on EUR/USD pair. In short-term perspective we use more or less definite trading plan, based on DiNapoli directional patterns, that are daily B&B and 4-hour DRPO. If all will work as it has to – we should get a 100+ pips bounce from 1.31 area.
But it is difficult to talk with same clarity about medium-term perspective that gives us two riddles. First one is – is current move down retracement or reversal, possible W&R? Second – if this is retracement, how deep it will be? On second question, we can say, based on our analysis, that until 1.29 it could be treated as retracement, since ultimately, it could be retesting of broken parallel channel.
The technical portion of Sive's analysis owes a great deal to Joe DiNapoli's methods, and uses a number of Joe's proprietary indicators. Please note that Sive's analysis is his own view of the market and is not endorsed by Joe DiNapoli or any related companies.
On monthly chart trend holds bullish, and within two bars we see bullish price action as well. On the past week price has done attempt to overrun upper border of K-resistance area. If market will break through it – next important level to watch is 1.3486 high. If market will show greater swing up and take out this level – that will be an appeal on reversal on monthly chart. Looks like our suggestions about potential solid bullish context more and more get confirmation from price action.

Weekly
First of all, let’s take a look at this contracted chart. Here we have a lot of bullish significant moments. Trend holds bullish. Initially market has passed through 25x5 DMA and already re-tested it form the other side to confirm the real breakout. Two weeks later market has passed through upper border of 1.5 year bear channel. Breakout has happened by excellent strong candle. All recent consolidation, in fact, is a struggle with monthly Confluence resistance and on recent week market has closed above 1.3150 area, that is upper border on this K-resistance area. What other barriers does market have above? It’s not at overbought, no Monthly Pivot Resistance levels. I see only 1.3480-1.35 previous highs, next is 5/8 major resistance at 1.3830 area, that is the target of weekly AB=CD and 1.27 extension of large butterfly “Buy”.

Now let’s take a look at most recent price action. Price stands in a progress with AB-CD pattern, that is also could be treated as Gartley’s “222” Buy. Price has hit resistance area of 1.3310-1.3350. This is 1.27 extension of previous swing down – particularly this level has help upward continuation. 1.3350 is 0.618 extension target, but market has not quite reached it. What do we see now? Not very fascinating sign for bulls – shooting star pattern on weekly time frame, that theoretically could easily shift to evening star pattern. If we will see this price action, it will lead market back inside of previously broken consolidation area. When shooting star is apeared, it is a burden for bulls, since commonly, you can tell that trend up will be reestablished, only if price exceeds pattern’s top. Another unpleasant moment, is that market has not even reached 0.618 extension target, that is a minor one. But does it really mean that bears are taking control? Well, one thing that could happen and will not lead to bears’ domination is retesting of broken trendline on the first chart. Downward price action could take place just for retesting it around 1.29, for instance. But now any attempt to gues it is more a gambling rather than analysis. Currently shooting star is important, that let us tell – until market will not take it high, upward trend will not be reestablish. For those, who has a bearish view and wants to open short position – this is nice invalidation point.

Daily
So, we have rather tricky situation. From the one point of view – all trends are bullish, I mean weekly and daily, while price action shows some bearish patterns, and looks like they take leading position, since particularly by weekly pattern price was not able even to reach minor 0.618 AB-CD extension target. Daily chart is a bit overloaded with details. We have bearish pattern on weekly, so invalidation point of this downward scenario is high at 1.3208. Here we have two major support levels. First one is at 1.3120-1.3140 – it includes WPS1 and nearest 3/8 Fib support. Second one is daily K-support area at 1.3140-1.3160. This area is very significant by some other reasons as well. Take a look at the chart – this is daily oversold and daily breakeven point. Another moment – take a look at blue lines. I’ve cloned previous retracement down and drag it to current top. Harmonic swings suggest that if market will hold the harmony retracement should not exceed the same K-support area. At the same time, weekly time frame does not exclude possible move even to 1.29 area as a possible re-testing of broken border of the channel. Based on daily time frame we can’t say more – only that retracement will probably continue and most powerful support area is 1.3140-1.3160 that has most chances to hold it.

4-hour
Since talks about retracement’s depth are a bit for longer-term perspective, price action on intraday chart let’s us to prepare some more or less definite strategy for beginning of the week. Recall, that on Friday we’ve disccused possibility of B&B “Buy” on daily time frame, that usually starts from significant daily support level. Lead market to this level, in turn, could DRPO look-alike pattern on 4-hour chart, and now we see that step by step price is moving to this significant support that is also minimum DRPO target – 50% support level. This area will be WPS1 as well and Agreement with 1.618 extension of 4-hour AB-CD. So, in the beginning of the week we have to be careful to any bullish reversal patterns around 1.31.
Only when (and if) B&B pattern will be finished we could start think about whether it shift to some greater downward AB-CD or market will continue move up, i.e. about retracement’s depth.

Conclusion:
Currently we have to major tasks on EUR/USD pair. In short-term perspective we use more or less definite trading plan, based on DiNapoli directional patterns, that are daily B&B and 4-hour DRPO. If all will work as it has to – we should get a 100+ pips bounce from 1.31 area.
But it is difficult to talk with same clarity about medium-term perspective that gives us two riddles. First one is – is current move down retracement or reversal, possible W&R? Second – if this is retracement, how deep it will be? On second question, we can say, based on our analysis, that until 1.29 it could be treated as retracement, since ultimately, it could be retesting of broken parallel channel.
The technical portion of Sive's analysis owes a great deal to Joe DiNapoli's methods, and uses a number of Joe's proprietary indicators. Please note that Sive's analysis is his own view of the market and is not endorsed by Joe DiNapoli or any related companies.
