Sive Morten
Special Consultant to the FPA
- Messages
- 18,685
AUD/USD Daily Update, Thu 30, December 2010
Good morning,
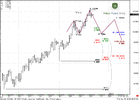
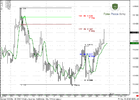
Yesterday market has reached 100% Fib target and possible retracement supposed to be reasonable.
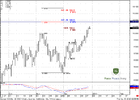
Our long-term analysis suggests, that bulls still control the market and extended target is 1.030 area roughly.
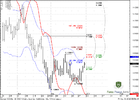
Meantime, just above the market 1.017 is a 1.27 area of resistance from two different swings and daily overbought. So, possibly market will show some retracement from this area also.
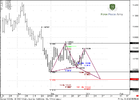
On 4-hour chart we see that the recent swing up is 1.618 greater from the previous swing down. This ratio is very typical for H&S pattern and one of the scenarios - possibly retracement down will be as H&S. I do not want to say it has to be as H&S, but in fact it could.
If it will be really so, then we have couple of levels to watch for.
1. 0.9955-0.9962 Confluence support and possible Agreement (if it will be really H&S)
2. 0.9871 - Agreement.
If market still intends to move higer, it should not break below 0.9871, because if it will happen - it totally erases the previous swing up, and this is not typical for behavior after reverse H&S that we've discussed yesterday.
Also it contradicts with our expectations from weekly time-frame.
Good morning,
Yesterday market has reached 100% Fib target and possible retracement supposed to be reasonable.
Our long-term analysis suggests, that bulls still control the market and extended target is 1.030 area roughly.
Meantime, just above the market 1.017 is a 1.27 area of resistance from two different swings and daily overbought. So, possibly market will show some retracement from this area also.
On 4-hour chart we see that the recent swing up is 1.618 greater from the previous swing down. This ratio is very typical for H&S pattern and one of the scenarios - possibly retracement down will be as H&S. I do not want to say it has to be as H&S, but in fact it could.
If it will be really so, then we have couple of levels to watch for.
1. 0.9955-0.9962 Confluence support and possible Agreement (if it will be really H&S)
2. 0.9871 - Agreement.
If market still intends to move higer, it should not break below 0.9871, because if it will happen - it totally erases the previous swing up, and this is not typical for behavior after reverse H&S that we've discussed yesterday.
Also it contradicts with our expectations from weekly time-frame.
")