Sive Morten
Special Consultant to the FPA
- Messages
- 18,776
Monthly
As Reuters reports, the euro jumped to its strongest level against the dollar in more than two years on Friday as banks adjusted positions for the year end, while the yen hit five-year lows for a second straight session. The dollar was broadly weaker against European currencies, including sterling and the Swiss franc. Thin liquidity likely helped exaggerate market moves. The European Central Bank will take a snapshot of the capital positions of the region's banks at the end of 2013 for an asset-quality review (AQR) next year to work out which of them will need fresh funds. The upcoming review has created some demand for euros to help shore up banks' balance sheets, traders said. "There's a lot of attention on the AQR, and there's some positioning ahead of the end of the calendar year," said John Hardy, FX strategist at Danske Bank in Copenhagen.
Comments from Jens Weidmann, the Bundesbank chief and a member of the European Central Bank Governing Council, also helped the euro. He warned that although the euro zone's current low interest rate is justified, weak inflation does not give a license for "arbitrary monetary easing." "With little else to trade off of for most of the week, the market took the comment as an excuse to push the euro higher and to trigger automatic buy orders in the single currency," said Omer Esiner, chief market analyst at Commonwealth Foreign Exchange in Washington. The euro rose as high as $1.3892, according to Reuters data, the highest since October 2011. It was last up 0.3 percent at $1.3738.
The currency has risen more than 10 cents from a low hit in July below $1.28, as the euro zone economy came out of a recession triggered by its debt crisis. Unlike the U.S. and Japanese central banks, the European Central Bank has not been actively expanding its balance sheet, giving an additional boost to the euro.
The yen touched a five-year trough against the dollar and euro, dented by a renewed appetite for risk that lifted U.S. and German equities to record highs and weighed on the low-yielding Japanese currency. The yen is on course to post its ninth consecutive week of falls against the dollar, the longest such period since 1974, when Japan was suffering from the aftermath of the oil crisis that started the previous year. Many economists expect inflation in Japan to peak soon, forcing the Bank of Japan to take additional easing steps early next year to counter the impact of a sales tax hike in April. "It looks as if there may be more ahead in terms of easing," said Geoffrey Yu, currency strategist at UBS. The yen's decline came in thin year-end trade and was a continuation of a well-entrenched trend after Japanese authorities this year launched a shock-and-awe stimulus strategy to snap the economy out of years of deflation.
Technical
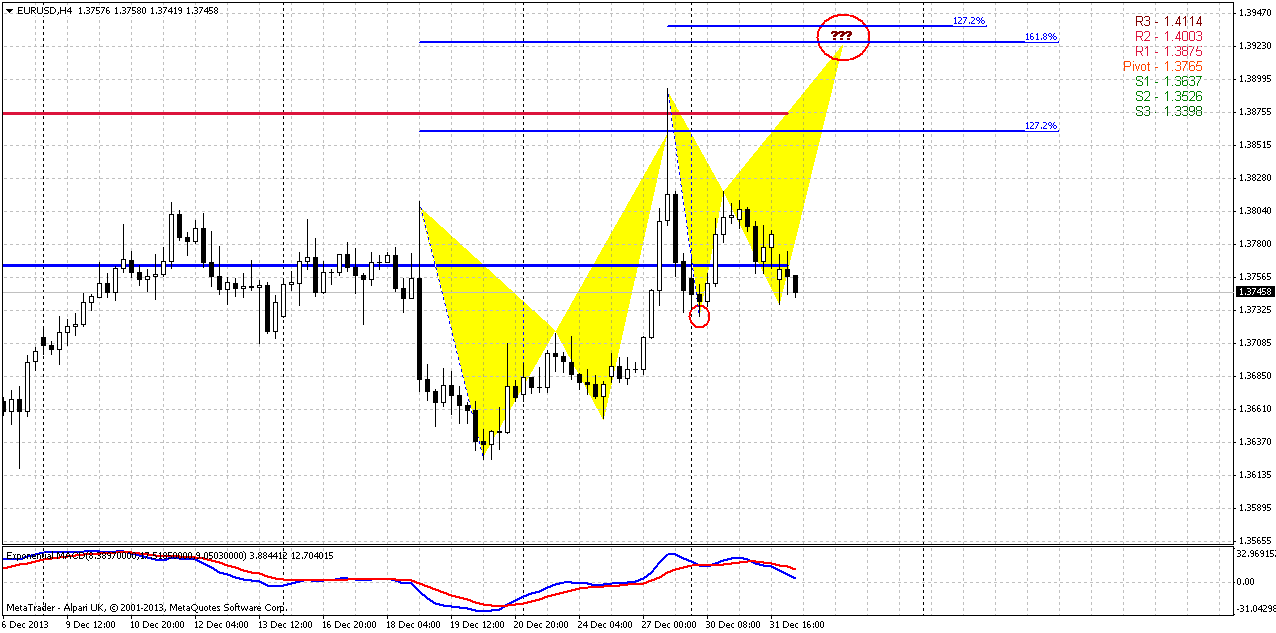
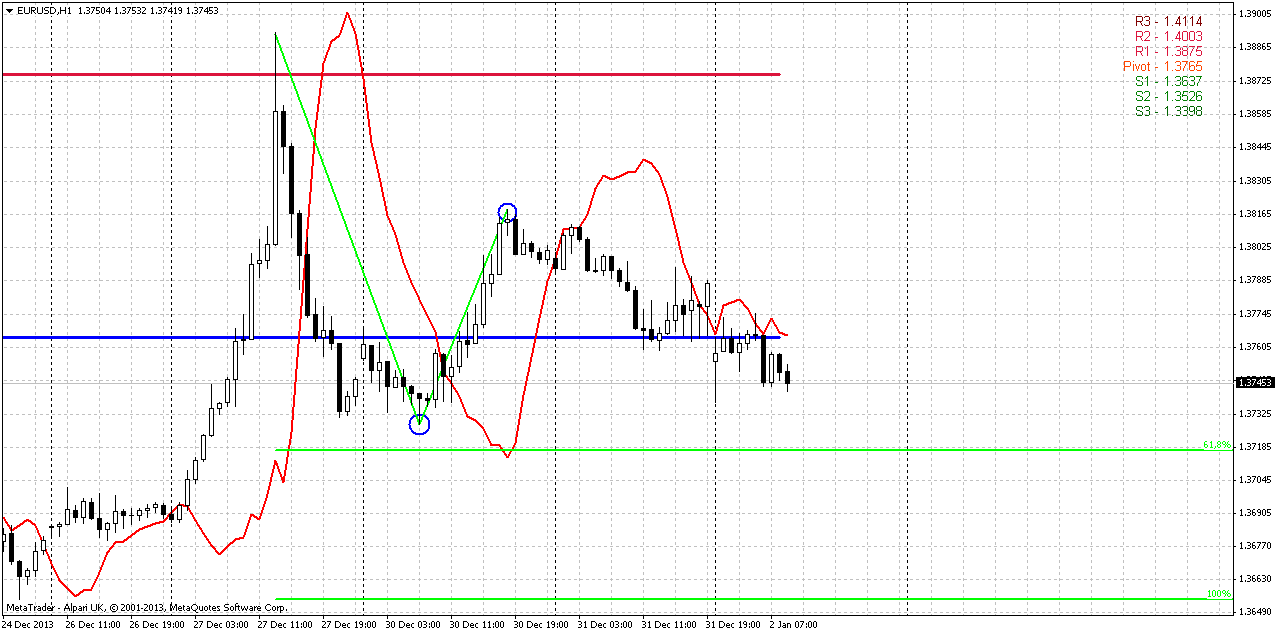
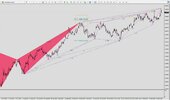
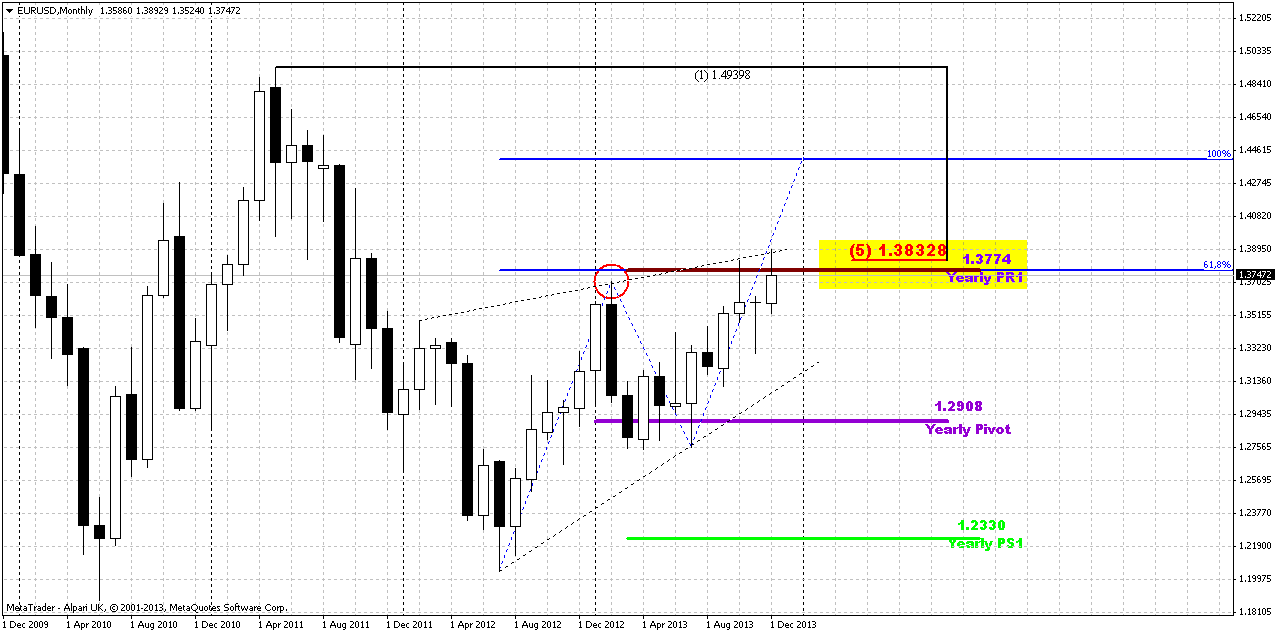
On monthly time frame market is knocking to rock hard resistance – Fib level and Agreemen and yearly PR1. This was the second attempt to pass through it. Fundamentally on past week the reason for EUR growth was demand for EUR for ECB debt payment by commercial banks, while on current week – balance improvement. What will be on next week?
Generally speaking we still stand around breakeven point – at major monthly resistance 1.3775-1.3830 and previous swing high. And market has not done any drastical steps yet. From the one point of view, retracement after first hit of 0.618 target of AB-CD pattern was shy and that is perfect for bullish development, but from the another point of view – market was not able to pass through this target and stand on course to 1.44 area, but stuck in solid resistance. YPR1 has special meaning here – if price will move above it, it will significantly increase probability of further upward action in 2014. As end of the year is gradually approaching, market could sit in the range as investors will avoid strong trading activity. But conclusion here is simple – we either should see upward breakout and take long position, or some reversal pattern on weekly/daily chart and start to think about enter short. Right now market still stands on the edge here. From one point of view price has failed yesterday to break up, but from another one – it still stands very close to previous highs. Thus, by looking at monthly chart we can’t say yet that price has reversed down already.
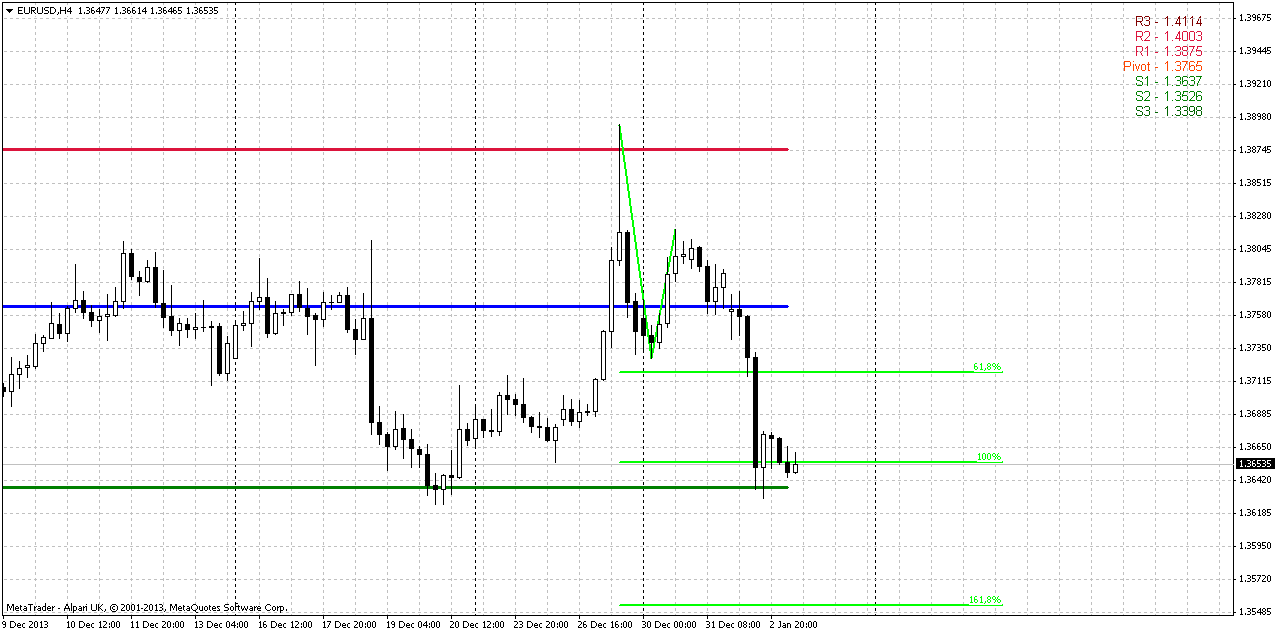
Weekly
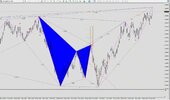
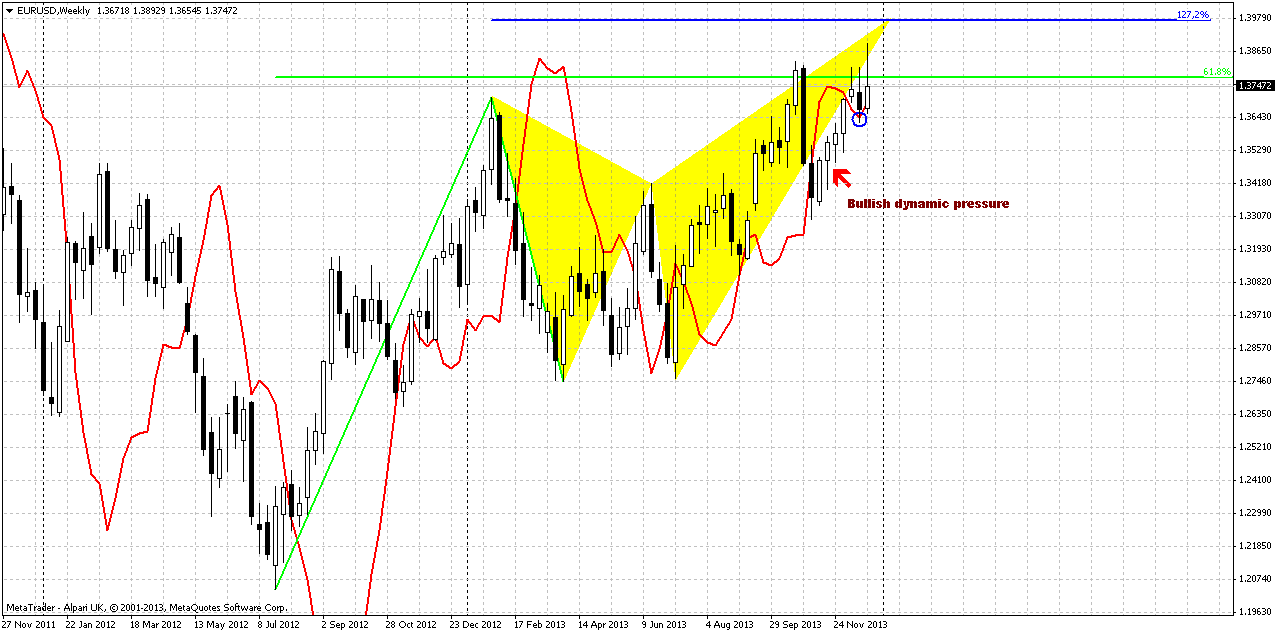
Weekly chart is a corner stone of EUR situation. First of all, take a look, that market has completed our short-term suggestion about previous highs clearing that was based on bullish dynamic pressure and stop grabber on previous week.
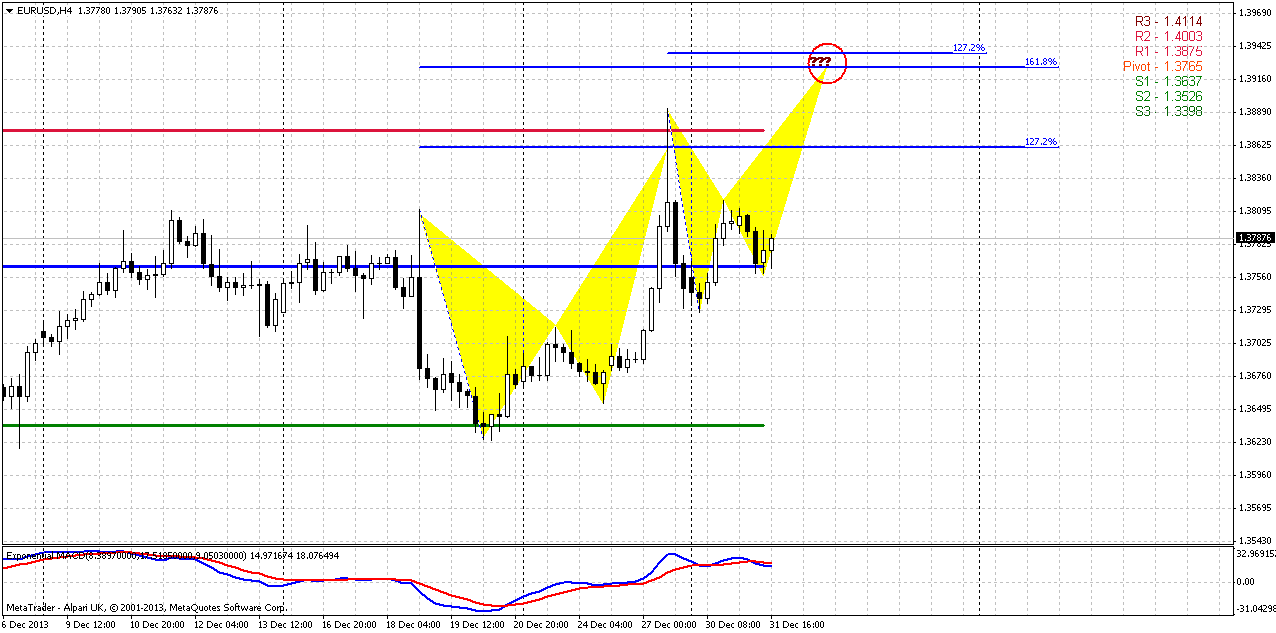
As EUR still holds around previous highs it’s very difficult to say “this is definitely reversal” or “this is definitely continuation”. Here we have to estimate clear conditions when we can treat price action as reversal and when it will be continuation. Signs and patterns that EUR shows us now have more bearish sentiment, rather than bullish. Here what we have – Butterfly “Sell” is forming right around major monthly resistance, price still can’t pass through it. Current AB-CD pattern has reached minor 0.618 target, but CD leg is much flatter than AB and this is the sign of weakness. But still, I’m not feel comfortable enough yet to bet on downward reversal. Something is missing in overall picture. I do not like very much (from bearish perspective, of cause), that price has not hit 1.27 butterfly target yet, second is market stands above MPR1 and finally, we do not see any reasonable thrust down yet. Previous one was erased by upward action, right?
These thin moments on current picture, probably could help us to build a criteria of reversal. Thus, it is prefferable to see butterfly completion and then – move below 1.33 lows. In this case we will get reversal swing on weekly chart that could become at least something that could confirm downward ambitions.
Conversely, to speak about upward continuation, we need to get fulfilling of two conditions as well – market should coil around previous tops without significant retracement, and second – move above 1.3980 – butterfly 1.27 target. In this case next target will be right around 1.43-1.44 – weekly AB-CD and butterfly 1.618. While market will stand inside of specified ranges – we can trade it based on lower time frame (daily and hourly) patterns and setups.
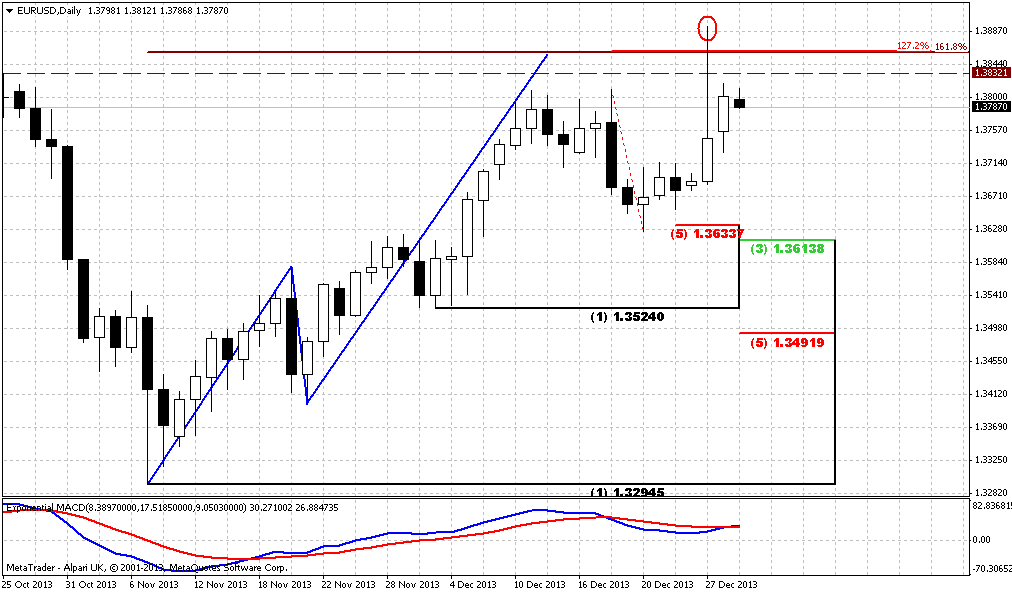
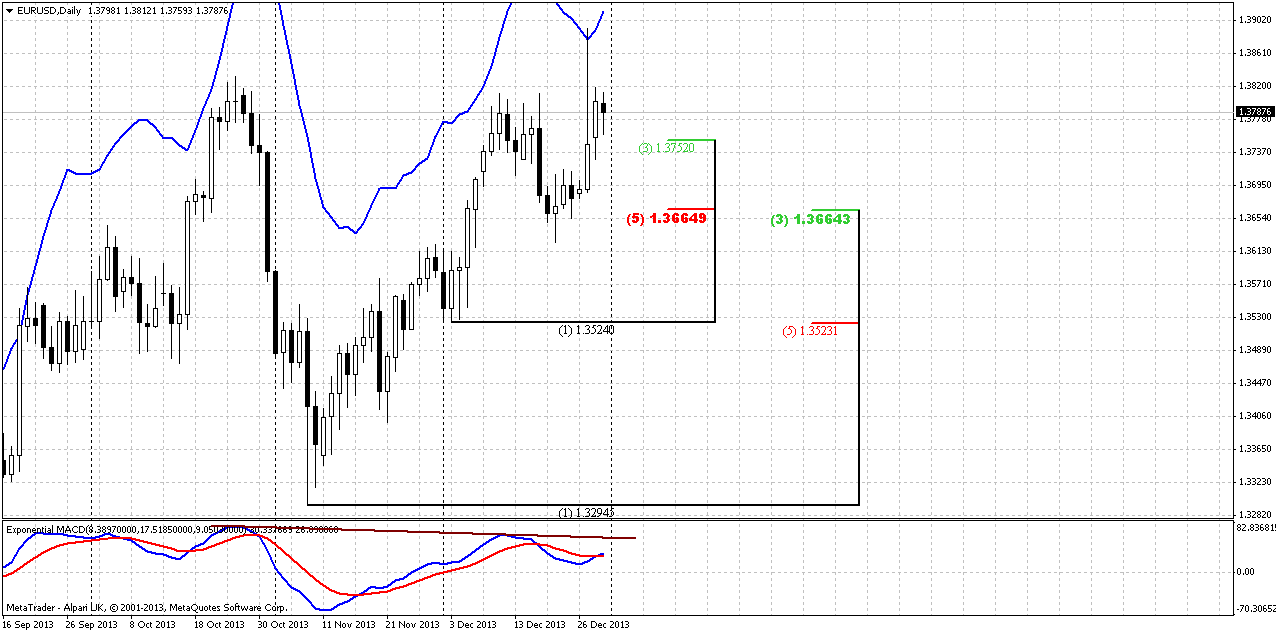
Daily
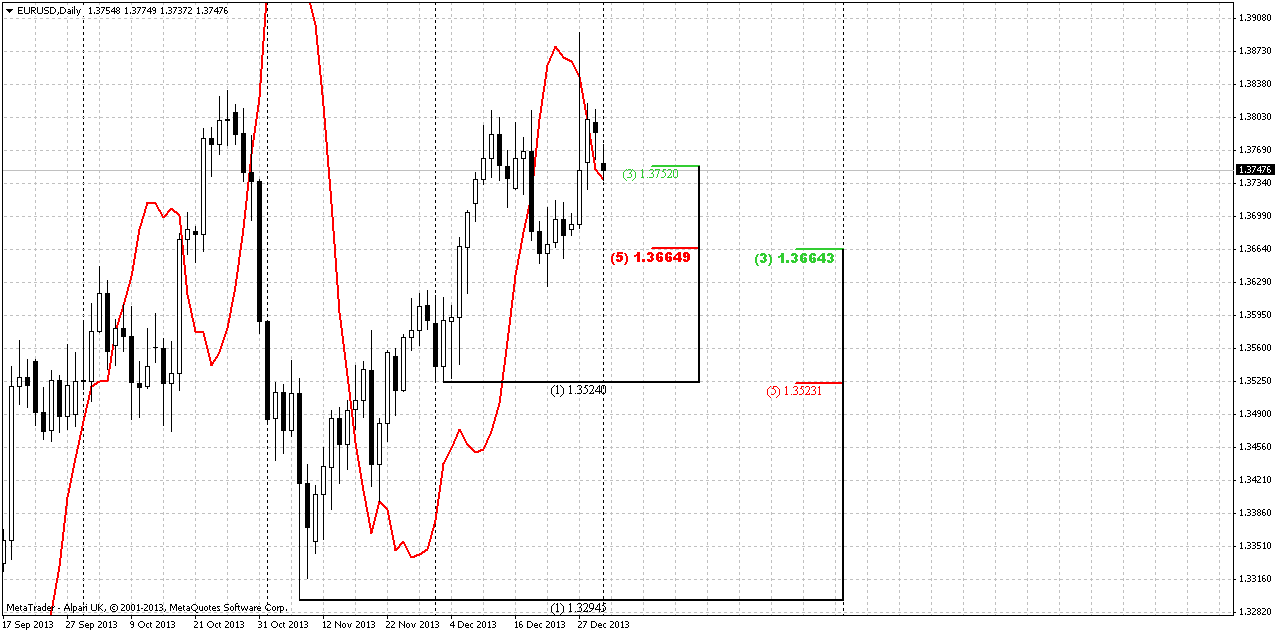
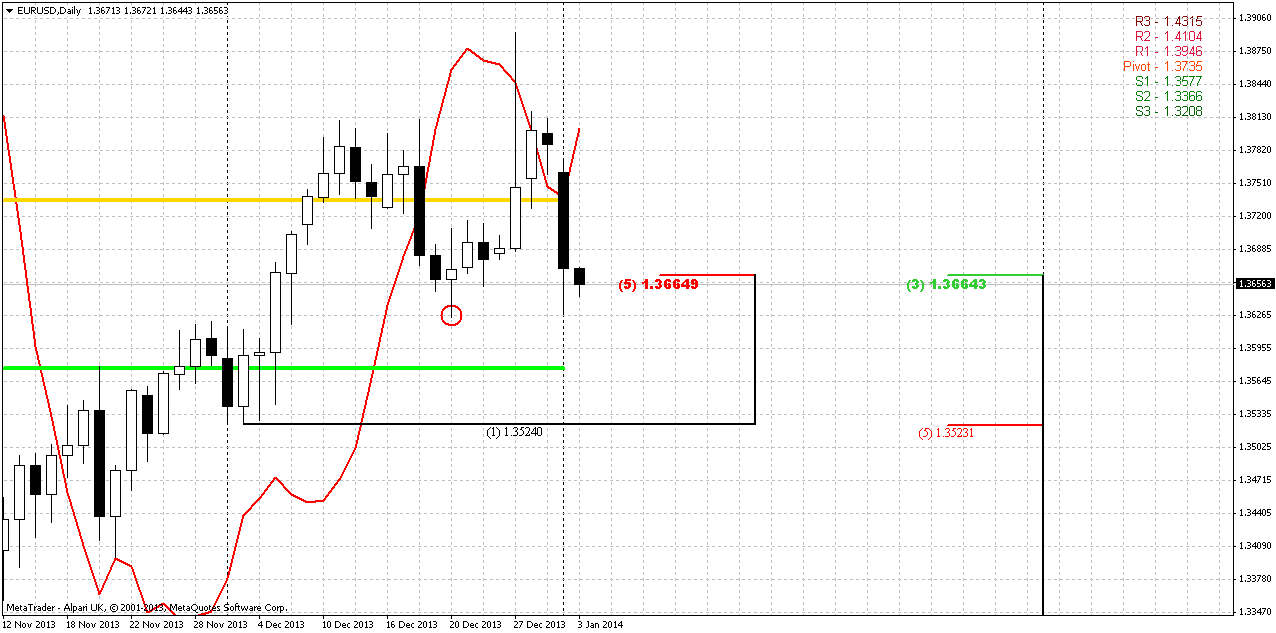
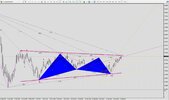
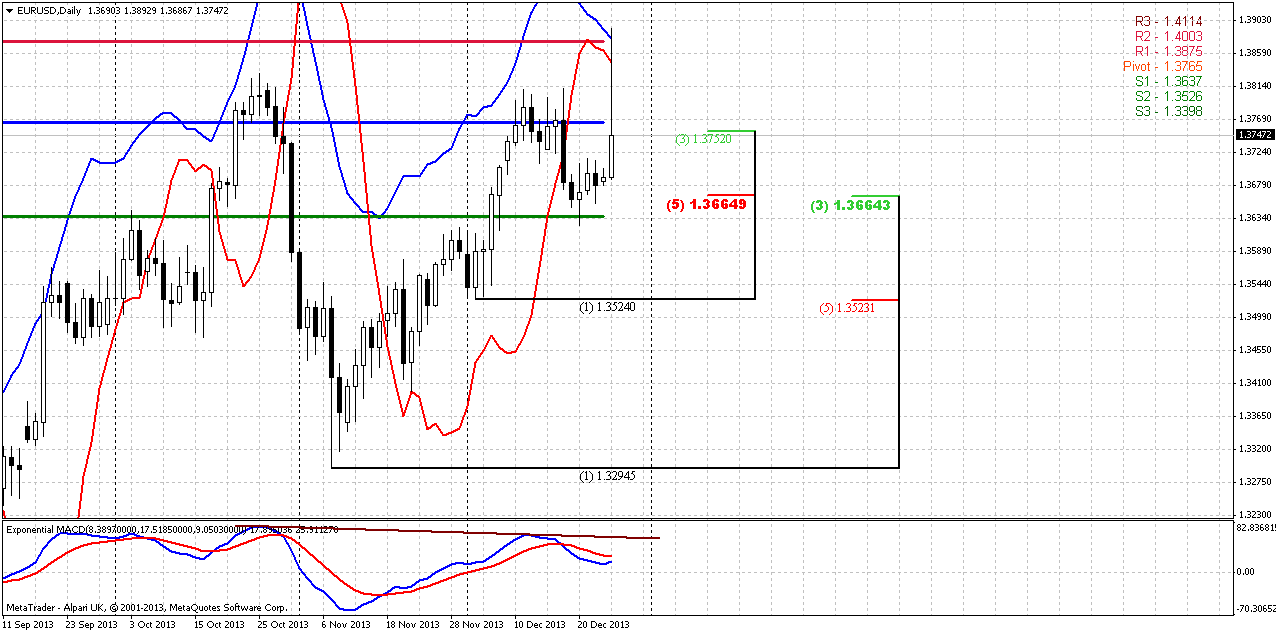
When we’ve discussed possible upward action on EUR, guys, honestly speaking, I thought that it will be a bit slower. But may be by the reason that we’ve mentioned in fundamental part of research or may be by some other reason, but EUR skyrocketed right to our 1.3860 target. Now what’s next? Currently it is very difficult to find any reasons for long entry. Market has hit overbought and bearish divergence right at resistance monthly resistance and formed bearish stop grabber. Actually we have something like Stretch pattern, since 1.39 area is solid Fib resistance on monthly chart and EUR is overbought around it. As we’ve discussed above, we need to see stable market standing above current highs and move again – right back above it. Potential target to the downside based on Fib work and pivots obviously stands around 1.3650 – Daily K-support and WPS1.
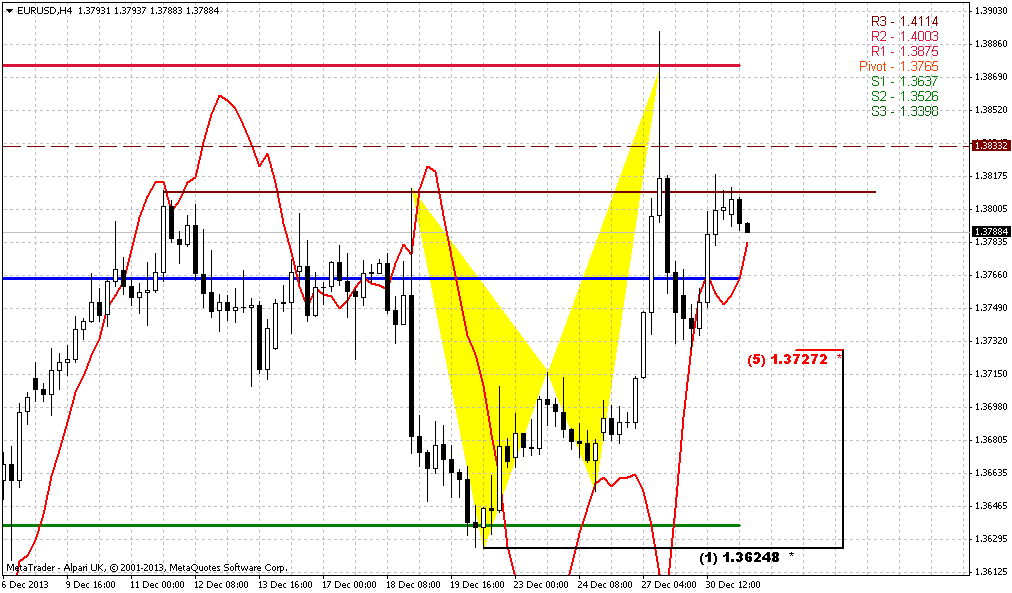
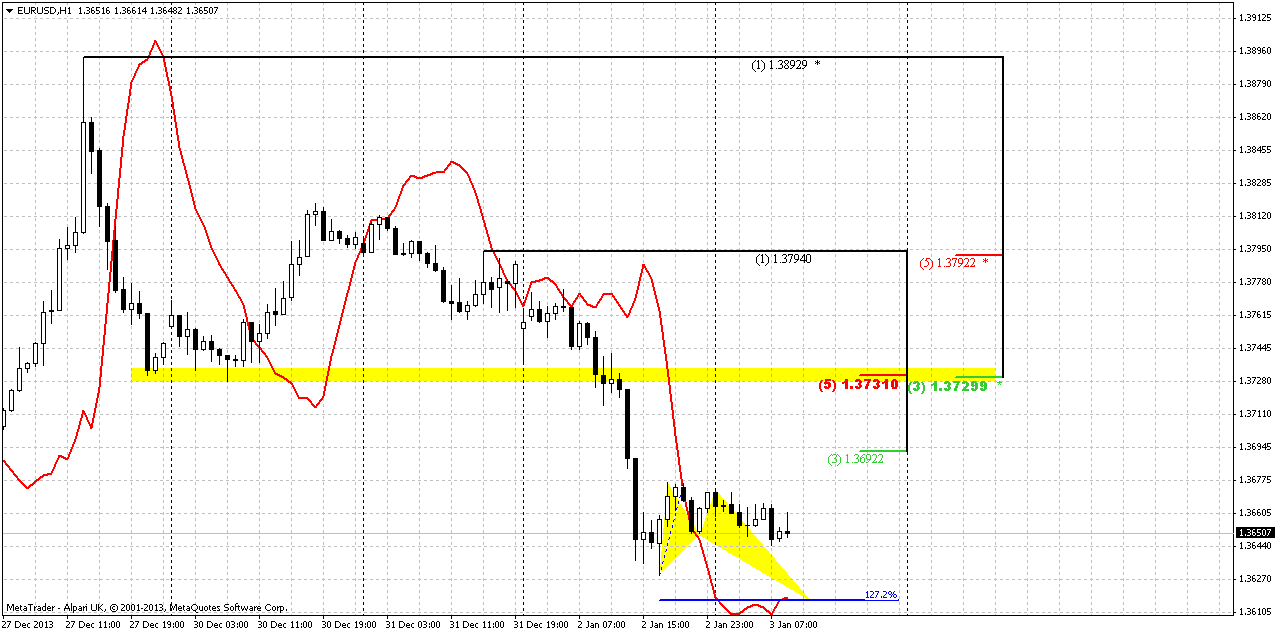
60-min
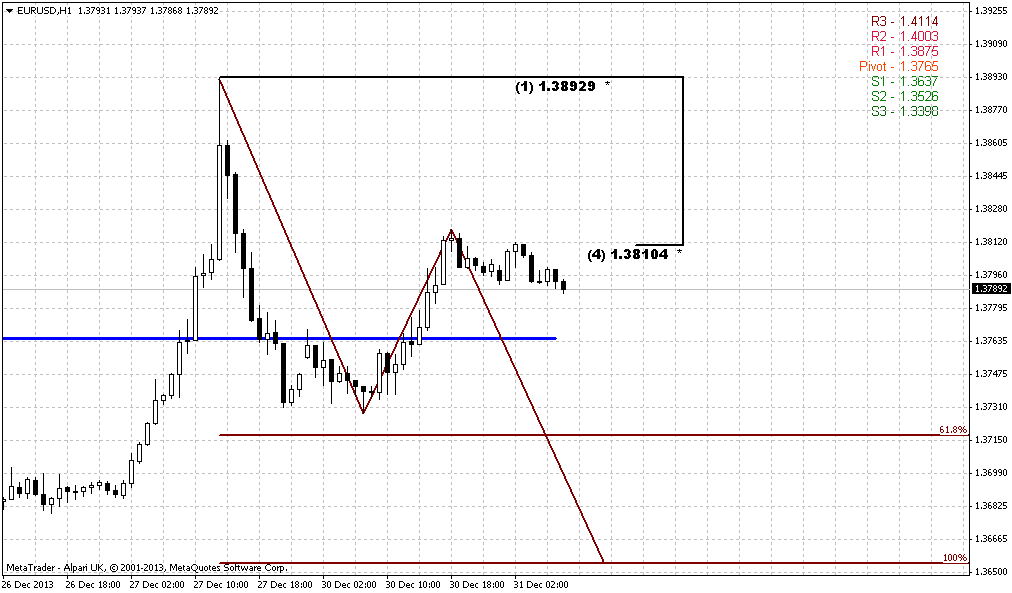
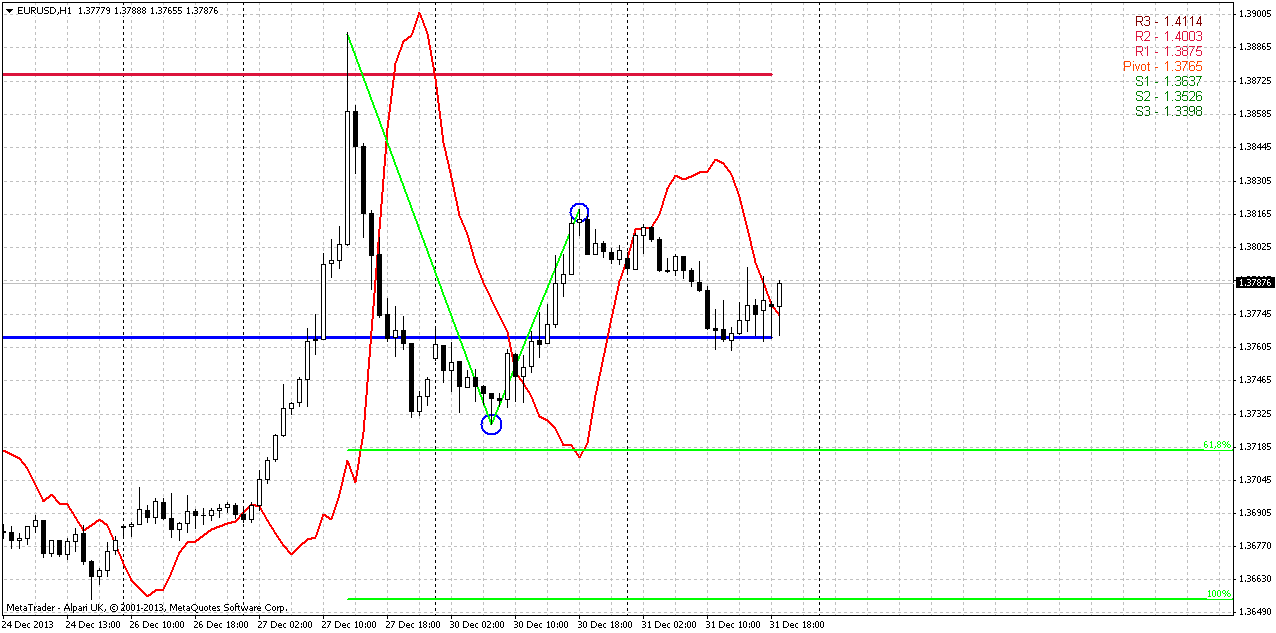
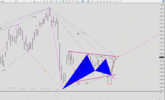
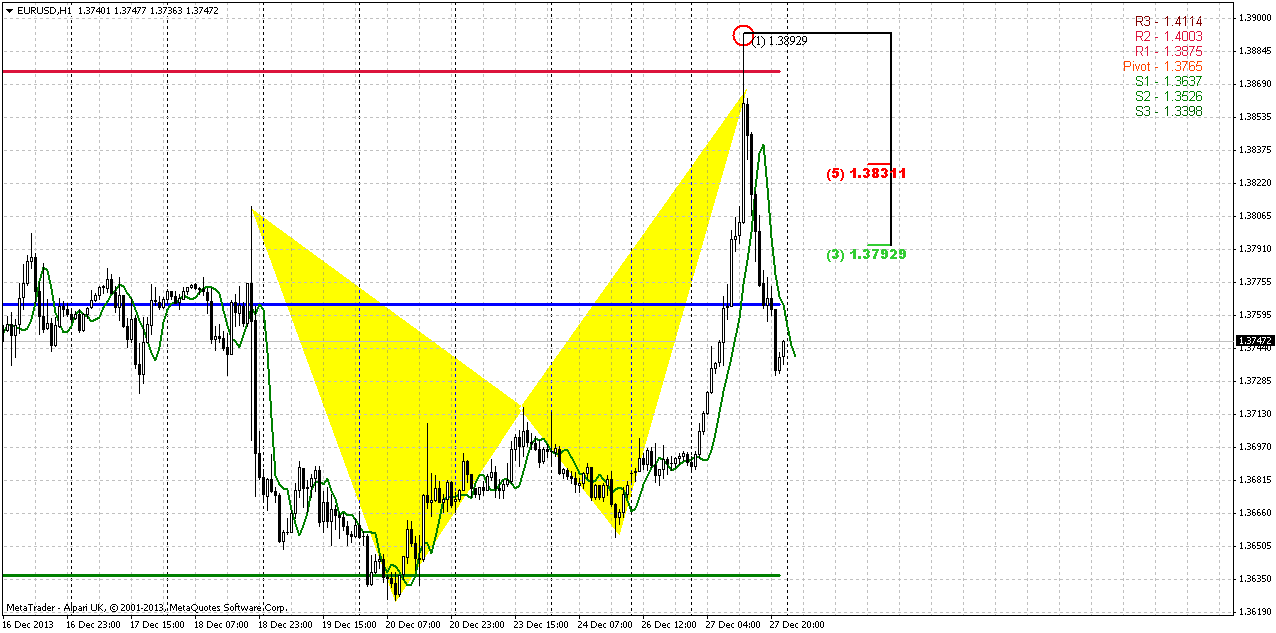
Here is our butterfly that we’ve traded on Friday and price has hit 1.27 target. Market has formed “V-top” reversal. I have found some discussion on forum, concerning possible B&B “Buy” setup here. Theoretically it looks like B&B, since market has shown initially excellent thrust up then move down as retracement, but not quite. The reason why I wouldn’t treat this as B&B “Buy” is the fact that market has broken through all Fib supports that are based on B&B thrust up (from ~1.3685 lows). I would better search for possiblity to sell using B&B “Sell” here. Recent move down also could be treated as setup for B&B “Sell”. But downward pattern has confirmation on higher time frame charts, particularly speaking by divergence and bearish grabber on daily. So, may be it makes sense to watch for some retracement up to 1.3790-1.3810 area and see what will happen there.
Final point here guys, keep an eye on larger picture. We know that butterflies very often anticipate appearing of H&S and become a part of it. Thus, here we could get the same if market really will be unable to continue move up – we could get 1.27 H&S on hourly/4hour chart...
Conclusion:
Despite all positive USD data of previous week, action on EUR does not suggest yet total and final reversal. Price still coiling around edge point and currently chances exist as for upward breakout as for downward reversal. To rely on direction whatever it will be, we need to get clear patterns that could confirm it and point extended targets for us.
Until this will not happen, we probably will have to deal with scalp fast trades on daily chart and lower ones. Thus, approximately we can assume that move above current highs will suggest upward continuation, while breakout below 1.33 will be first sign of possible downward reversal on long-term charts.
In shorter-term perspective patterns that were created on Friday stand more in favor of downward continuation rather than upward move. Nearest target to the downside is WPS1 and daily K-support area around 1.3650.
The technical portion of Sive's analysis owes a great deal to Joe DiNapoli's methods, and uses a number of Joe's proprietary indicators. Please note that Sive's analysis is his own view of the market and is not endorsed by Joe DiNapoli or any related companies.
As Reuters reports, the euro jumped to its strongest level against the dollar in more than two years on Friday as banks adjusted positions for the year end, while the yen hit five-year lows for a second straight session. The dollar was broadly weaker against European currencies, including sterling and the Swiss franc. Thin liquidity likely helped exaggerate market moves. The European Central Bank will take a snapshot of the capital positions of the region's banks at the end of 2013 for an asset-quality review (AQR) next year to work out which of them will need fresh funds. The upcoming review has created some demand for euros to help shore up banks' balance sheets, traders said. "There's a lot of attention on the AQR, and there's some positioning ahead of the end of the calendar year," said John Hardy, FX strategist at Danske Bank in Copenhagen.
Comments from Jens Weidmann, the Bundesbank chief and a member of the European Central Bank Governing Council, also helped the euro. He warned that although the euro zone's current low interest rate is justified, weak inflation does not give a license for "arbitrary monetary easing." "With little else to trade off of for most of the week, the market took the comment as an excuse to push the euro higher and to trigger automatic buy orders in the single currency," said Omer Esiner, chief market analyst at Commonwealth Foreign Exchange in Washington. The euro rose as high as $1.3892, according to Reuters data, the highest since October 2011. It was last up 0.3 percent at $1.3738.
The currency has risen more than 10 cents from a low hit in July below $1.28, as the euro zone economy came out of a recession triggered by its debt crisis. Unlike the U.S. and Japanese central banks, the European Central Bank has not been actively expanding its balance sheet, giving an additional boost to the euro.
The yen touched a five-year trough against the dollar and euro, dented by a renewed appetite for risk that lifted U.S. and German equities to record highs and weighed on the low-yielding Japanese currency. The yen is on course to post its ninth consecutive week of falls against the dollar, the longest such period since 1974, when Japan was suffering from the aftermath of the oil crisis that started the previous year. Many economists expect inflation in Japan to peak soon, forcing the Bank of Japan to take additional easing steps early next year to counter the impact of a sales tax hike in April. "It looks as if there may be more ahead in terms of easing," said Geoffrey Yu, currency strategist at UBS. The yen's decline came in thin year-end trade and was a continuation of a well-entrenched trend after Japanese authorities this year launched a shock-and-awe stimulus strategy to snap the economy out of years of deflation.
Technical
On monthly time frame market is knocking to rock hard resistance – Fib level and Agreemen and yearly PR1. This was the second attempt to pass through it. Fundamentally on past week the reason for EUR growth was demand for EUR for ECB debt payment by commercial banks, while on current week – balance improvement. What will be on next week?
Generally speaking we still stand around breakeven point – at major monthly resistance 1.3775-1.3830 and previous swing high. And market has not done any drastical steps yet. From the one point of view, retracement after first hit of 0.618 target of AB-CD pattern was shy and that is perfect for bullish development, but from the another point of view – market was not able to pass through this target and stand on course to 1.44 area, but stuck in solid resistance. YPR1 has special meaning here – if price will move above it, it will significantly increase probability of further upward action in 2014. As end of the year is gradually approaching, market could sit in the range as investors will avoid strong trading activity. But conclusion here is simple – we either should see upward breakout and take long position, or some reversal pattern on weekly/daily chart and start to think about enter short. Right now market still stands on the edge here. From one point of view price has failed yesterday to break up, but from another one – it still stands very close to previous highs. Thus, by looking at monthly chart we can’t say yet that price has reversed down already.
Weekly
Weekly chart is a corner stone of EUR situation. First of all, take a look, that market has completed our short-term suggestion about previous highs clearing that was based on bullish dynamic pressure and stop grabber on previous week.
As EUR still holds around previous highs it’s very difficult to say “this is definitely reversal” or “this is definitely continuation”. Here we have to estimate clear conditions when we can treat price action as reversal and when it will be continuation. Signs and patterns that EUR shows us now have more bearish sentiment, rather than bullish. Here what we have – Butterfly “Sell” is forming right around major monthly resistance, price still can’t pass through it. Current AB-CD pattern has reached minor 0.618 target, but CD leg is much flatter than AB and this is the sign of weakness. But still, I’m not feel comfortable enough yet to bet on downward reversal. Something is missing in overall picture. I do not like very much (from bearish perspective, of cause), that price has not hit 1.27 butterfly target yet, second is market stands above MPR1 and finally, we do not see any reasonable thrust down yet. Previous one was erased by upward action, right?
These thin moments on current picture, probably could help us to build a criteria of reversal. Thus, it is prefferable to see butterfly completion and then – move below 1.33 lows. In this case we will get reversal swing on weekly chart that could become at least something that could confirm downward ambitions.
Conversely, to speak about upward continuation, we need to get fulfilling of two conditions as well – market should coil around previous tops without significant retracement, and second – move above 1.3980 – butterfly 1.27 target. In this case next target will be right around 1.43-1.44 – weekly AB-CD and butterfly 1.618. While market will stand inside of specified ranges – we can trade it based on lower time frame (daily and hourly) patterns and setups.
Daily
When we’ve discussed possible upward action on EUR, guys, honestly speaking, I thought that it will be a bit slower. But may be by the reason that we’ve mentioned in fundamental part of research or may be by some other reason, but EUR skyrocketed right to our 1.3860 target. Now what’s next? Currently it is very difficult to find any reasons for long entry. Market has hit overbought and bearish divergence right at resistance monthly resistance and formed bearish stop grabber. Actually we have something like Stretch pattern, since 1.39 area is solid Fib resistance on monthly chart and EUR is overbought around it. As we’ve discussed above, we need to see stable market standing above current highs and move again – right back above it. Potential target to the downside based on Fib work and pivots obviously stands around 1.3650 – Daily K-support and WPS1.
60-min
Here is our butterfly that we’ve traded on Friday and price has hit 1.27 target. Market has formed “V-top” reversal. I have found some discussion on forum, concerning possible B&B “Buy” setup here. Theoretically it looks like B&B, since market has shown initially excellent thrust up then move down as retracement, but not quite. The reason why I wouldn’t treat this as B&B “Buy” is the fact that market has broken through all Fib supports that are based on B&B thrust up (from ~1.3685 lows). I would better search for possiblity to sell using B&B “Sell” here. Recent move down also could be treated as setup for B&B “Sell”. But downward pattern has confirmation on higher time frame charts, particularly speaking by divergence and bearish grabber on daily. So, may be it makes sense to watch for some retracement up to 1.3790-1.3810 area and see what will happen there.
Final point here guys, keep an eye on larger picture. We know that butterflies very often anticipate appearing of H&S and become a part of it. Thus, here we could get the same if market really will be unable to continue move up – we could get 1.27 H&S on hourly/4hour chart...
Conclusion:
Despite all positive USD data of previous week, action on EUR does not suggest yet total and final reversal. Price still coiling around edge point and currently chances exist as for upward breakout as for downward reversal. To rely on direction whatever it will be, we need to get clear patterns that could confirm it and point extended targets for us.
Until this will not happen, we probably will have to deal with scalp fast trades on daily chart and lower ones. Thus, approximately we can assume that move above current highs will suggest upward continuation, while breakout below 1.33 will be first sign of possible downward reversal on long-term charts.
In shorter-term perspective patterns that were created on Friday stand more in favor of downward continuation rather than upward move. Nearest target to the downside is WPS1 and daily K-support area around 1.3650.
The technical portion of Sive's analysis owes a great deal to Joe DiNapoli's methods, and uses a number of Joe's proprietary indicators. Please note that Sive's analysis is his own view of the market and is not endorsed by Joe DiNapoli or any related companies.