Sive Morten
Special Consultant to the FPA
- Messages
- 18,732
Monthly
The euro fell on Friday as soft euro zone inflation data rekindled concerns the European Central Bank may have to act to combat deflation, while the dollar strengthened on mildly encouraging data to close out its best month since May. Nagging worries about emerging market woes spreading underpinned safe-haven buying for the yen, which was on track to be the best performer among G7 currencies in January. "The focus on the euro is that we could see a policy response from the ECB next week," said Shaun Osborne, chief foreign exchange strategist at TD Securities in Toronto. Euro zone inflation data on Friday showed a surprise drop to 0.7 percent year-on-year in January. Analysts had expected a rise to 0.9 percent. The fall could be a trigger for further easing by the ECB, which holds its policy review next week, to sustain a fragile recovery and ward off a falling price spiral that could cripple the economy for years. For January, the euro fell 1.8 percent against the dollar for its biggest monthly drop in 11 months, while it shed 4.8 percent against the yen, its steepest monthly decline against that currency since July 2012. Trading volumes were light with large parts of Asia on holiday for the Lunar New Year.
Meanwhile, risk aversion hit commodity-related currencies, with the Canadian dollar falling to a 4-1/2-year low. The loonie last traded 0.3 percent lower at C$1.1126 per dollar in the wake of weaker-than-expected data on Canadian growth in November. The sell-off in the euro and emerging market currencies like the Turkish lira and South African rand this week has benefited the yen - last year's weakest major currency - as the dollar fell 0.3 percent to 102.35 yen on Friday, retracing from an earlier low of 101.78 yen. There were large month-end option expiries at 102.25 and 103 yen, according to one trader. Another boost to the yen was Japan's core consumer price inflation, which accelerated to 1.3 percent in January, the highest level in five years.
B]Technical[/B]
So, guys, today, as you probably understand, I intend to dedicate research to JPY. Situation there has changed since our previous discussion and moved forward in agreement with our analysis of monthly chart. Herer is the core of our previous discussion that is still valid and important:
Let’s take a look at contracted JPY chart first. Here is some very tricky moment hidden and if you careful enough you could find him. First of all, we see that 101.50 area is long-term natural support/resistance line. Sometimes market has pierced it significantly but this line holds. Now we also see that on previous touch market has pierced it as well, but has not broken it. No price stands slightly higher than the line that I’ve drawn, but still lower than previous high. It means that market has not passed through this resistance yet, although at first glance it seems the opposite is true. Now I would ask you – what do you expect to happen when you have natural resistance line and slightly higher solid Fib resistance level? Will chances on true breakout of resistance be greater or smaller? Market could loss a lot of momentum on struggle against natural level and then it will meet Fib resistance. This situation starts to smell as possible W&R or even failure breakout. That’s why it’s very interesting. Anything could happen of cause, but if price will swamp and form some reversal pattern in 101.50-105.5 area this could trigger solid retracement down.
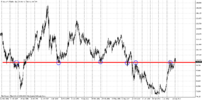
Now the first part of this plan has been accomplished – we’ve got bearish engulfing pattern right in the area where we’ve expected to get it. Still I see two possible risk factors here. First is that market has not quite reached Fib resistance, approximately for 30 pips. Second is now market has reached this 101.50 long-term level from upside and this could be just re-testing of broken level. Other words risk stands in possibility of upward continuation after re-testing of broken area. We should keep in mind these moments later, to create trading plan for next week.
On second monthly chart you can see modern picture of JPY.
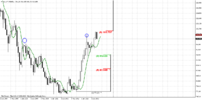
This picture carries really thrilling setups that yet to be formed here. Actually one setup already has been formed. I’m speaking about engulfing pattern so it could traded separately and probably we will start right from it and at the same time will keep an eye on second setup. And second guys, is DRPO “Sell” on monthly chart. Appearing of engulfing pattern and some kind of W&R of previous top makes this setup possible. Another reason for deep retracement here is first bounce up after long-term bear action. Long-term bearish momentum is here and it will press on market and hold further upward action. Thus overall picture for deep dive down looks possible.
Weekly
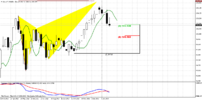
On weekly chart we have two significant moments. First one is a pattern for immediate trading. This is B&B “Buy” that already has been formed. Although upward thrust looks too small when you look at bigger chart, but in reality this is nine consequtive weeks of upward action. Thus, it is suitable for DiNapoli directional pattern. Market has shown two closes below 3x3 DMA and hit nearest 3/8 Fib support level, so neccesary conditions for trading B&B have been accomplished. Market has even one more reserved week for retracement down. In larger scale weekly B&B could become a retracement after monthly engulfing pattern and in perspective could provide us with chance to take short position.
Second moment that I would like to discuss here is butterfly. As you can see market has turned down slightly earlier than 1.27 target. Reason for that stands on daily time frame – smaller butterfly that has hit 1.618 extension. So we have some sort of nested butterflies. Still, the moment that price has not quite reached 1.27 extension and monthly 5/8 Fib level is disturbing sign.
And finally – we have bearish divergence with MACD right at resistance. Thus, although we have some moments that could have hidden menace in longer perspective, now we intend to take long position, based on possible B&B pattern. From that point of view we do not care much whether market will establish new highs or not, since the target of B&B stands much lower. When B&B will work out – we will think about short position, since the core of long-term analysis is based on expectation of appearing bearish reversal pattern and we already have bearish engulfing pattern that could become a part of overall bearish context.
Daily
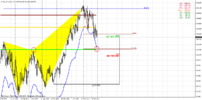
Now let’s take closer look at weekly B&B “Buy” and how it looks like on daily time frame. Trend is bearish here. Market has hit solid support level – daily oversold + AB=CD target+ Fib support at 102.20 and has shown upward bounce. Here you also can clearly see the reason, why market has turned down on weekly chart - smaller butterfly that I’ve talked about and which is inside one for weekly pattern. Although market has accomplished minimum requirements for B&B pattern, as we’ve said – price still has one more week for downward action, since B&B should start within 1-3 weeks below 3x3 while we have two weeks by far. I’m speaking about it, since current picture assumes solid probability for one more leg down. Major reason for that is too fast action CD leg of Fib extension. In such circumstances continuation usually happens. You can see that bounce up itself was a bit weak and has faded rather fast and overruled by solid return right back down to support area as well. So that will be second test of this area. That’s why I can’t exclude and even think that price really could follow to next support area where B&B could start. This is MPS1, approximately 50% Fib support, natural support, 1.618 AB-CD target and daily oversold – 100.60 area.
4-hour
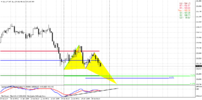
This time frame in general confirms daily analysis and possible deeper move down. At the same time scenario of this move could be twofold. This will be either 1.618 Butterfly with target around 101.73 or, it could take shape of 3-Drive Buy pattern that points on possible reversal around WPS1=101.35. Also we have nicely looking MACD bullish divergence here. Since we do not know yet what particular pattern will work and weekly B&B pattern is significant and valuable for us, here we again should apply scale in entry technique probably. It means that we should take 25-30% of our usual position at 3-Drive target. If market will move lower – take the rest at butterfly target. Stop we will have to place below WPS1 and daily oversold level.
Conclusion:
Yen now is forming and already has formed some interesting patterns that are interesting for trading right now and some of them potentially could put foundation for market action in long-term perspective.
Thus, our long-term plan is to get monthly reversal pattern. Situation stands so that it easily could be B&B “Sell”. At the same time we already have got bearish engulfing and I do not see any reason why we should ignore it. As this pattern in general suggests downward action, but now it is almost a rule that after it has been completed market shows some minor bounce inside the body of this pattern. But this bounce absolutely does not look as “minor” on lower time frame charts and could become excellent object for trading per se. Thus daily chart makes possible to trade market up, while we wait signal for short entry.
The context for bullish trade is B&B “Buy” pattern. Still, as recent move down was really fast, we can’t exclude that market could pass lower a bit more. Thus our area that has to be monitored for long entry is 100.60- 101.35. Since it looks a bit wide and market can turn upward in any point of this range – we suggest that applying of scale-in technique is nice tool for resolving this uncertainty.
The technical portion of Sive's analysis owes a great deal to Joe DiNapoli's methods, and uses a number of Joe's proprietary indicators. Please note that Sive's analysis is his own view of the market and is not endorsed by Joe DiNapoli or any related companies.
The euro fell on Friday as soft euro zone inflation data rekindled concerns the European Central Bank may have to act to combat deflation, while the dollar strengthened on mildly encouraging data to close out its best month since May. Nagging worries about emerging market woes spreading underpinned safe-haven buying for the yen, which was on track to be the best performer among G7 currencies in January. "The focus on the euro is that we could see a policy response from the ECB next week," said Shaun Osborne, chief foreign exchange strategist at TD Securities in Toronto. Euro zone inflation data on Friday showed a surprise drop to 0.7 percent year-on-year in January. Analysts had expected a rise to 0.9 percent. The fall could be a trigger for further easing by the ECB, which holds its policy review next week, to sustain a fragile recovery and ward off a falling price spiral that could cripple the economy for years. For January, the euro fell 1.8 percent against the dollar for its biggest monthly drop in 11 months, while it shed 4.8 percent against the yen, its steepest monthly decline against that currency since July 2012. Trading volumes were light with large parts of Asia on holiday for the Lunar New Year.
Meanwhile, risk aversion hit commodity-related currencies, with the Canadian dollar falling to a 4-1/2-year low. The loonie last traded 0.3 percent lower at C$1.1126 per dollar in the wake of weaker-than-expected data on Canadian growth in November. The sell-off in the euro and emerging market currencies like the Turkish lira and South African rand this week has benefited the yen - last year's weakest major currency - as the dollar fell 0.3 percent to 102.35 yen on Friday, retracing from an earlier low of 101.78 yen. There were large month-end option expiries at 102.25 and 103 yen, according to one trader. Another boost to the yen was Japan's core consumer price inflation, which accelerated to 1.3 percent in January, the highest level in five years.
B]Technical[/B]
So, guys, today, as you probably understand, I intend to dedicate research to JPY. Situation there has changed since our previous discussion and moved forward in agreement with our analysis of monthly chart. Herer is the core of our previous discussion that is still valid and important:
Let’s take a look at contracted JPY chart first. Here is some very tricky moment hidden and if you careful enough you could find him. First of all, we see that 101.50 area is long-term natural support/resistance line. Sometimes market has pierced it significantly but this line holds. Now we also see that on previous touch market has pierced it as well, but has not broken it. No price stands slightly higher than the line that I’ve drawn, but still lower than previous high. It means that market has not passed through this resistance yet, although at first glance it seems the opposite is true. Now I would ask you – what do you expect to happen when you have natural resistance line and slightly higher solid Fib resistance level? Will chances on true breakout of resistance be greater or smaller? Market could loss a lot of momentum on struggle against natural level and then it will meet Fib resistance. This situation starts to smell as possible W&R or even failure breakout. That’s why it’s very interesting. Anything could happen of cause, but if price will swamp and form some reversal pattern in 101.50-105.5 area this could trigger solid retracement down.

Now the first part of this plan has been accomplished – we’ve got bearish engulfing pattern right in the area where we’ve expected to get it. Still I see two possible risk factors here. First is that market has not quite reached Fib resistance, approximately for 30 pips. Second is now market has reached this 101.50 long-term level from upside and this could be just re-testing of broken level. Other words risk stands in possibility of upward continuation after re-testing of broken area. We should keep in mind these moments later, to create trading plan for next week.
On second monthly chart you can see modern picture of JPY.

This picture carries really thrilling setups that yet to be formed here. Actually one setup already has been formed. I’m speaking about engulfing pattern so it could traded separately and probably we will start right from it and at the same time will keep an eye on second setup. And second guys, is DRPO “Sell” on monthly chart. Appearing of engulfing pattern and some kind of W&R of previous top makes this setup possible. Another reason for deep retracement here is first bounce up after long-term bear action. Long-term bearish momentum is here and it will press on market and hold further upward action. Thus overall picture for deep dive down looks possible.
Weekly
On weekly chart we have two significant moments. First one is a pattern for immediate trading. This is B&B “Buy” that already has been formed. Although upward thrust looks too small when you look at bigger chart, but in reality this is nine consequtive weeks of upward action. Thus, it is suitable for DiNapoli directional pattern. Market has shown two closes below 3x3 DMA and hit nearest 3/8 Fib support level, so neccesary conditions for trading B&B have been accomplished. Market has even one more reserved week for retracement down. In larger scale weekly B&B could become a retracement after monthly engulfing pattern and in perspective could provide us with chance to take short position.
Second moment that I would like to discuss here is butterfly. As you can see market has turned down slightly earlier than 1.27 target. Reason for that stands on daily time frame – smaller butterfly that has hit 1.618 extension. So we have some sort of nested butterflies. Still, the moment that price has not quite reached 1.27 extension and monthly 5/8 Fib level is disturbing sign.
And finally – we have bearish divergence with MACD right at resistance. Thus, although we have some moments that could have hidden menace in longer perspective, now we intend to take long position, based on possible B&B pattern. From that point of view we do not care much whether market will establish new highs or not, since the target of B&B stands much lower. When B&B will work out – we will think about short position, since the core of long-term analysis is based on expectation of appearing bearish reversal pattern and we already have bearish engulfing pattern that could become a part of overall bearish context.

Daily
Now let’s take closer look at weekly B&B “Buy” and how it looks like on daily time frame. Trend is bearish here. Market has hit solid support level – daily oversold + AB=CD target+ Fib support at 102.20 and has shown upward bounce. Here you also can clearly see the reason, why market has turned down on weekly chart - smaller butterfly that I’ve talked about and which is inside one for weekly pattern. Although market has accomplished minimum requirements for B&B pattern, as we’ve said – price still has one more week for downward action, since B&B should start within 1-3 weeks below 3x3 while we have two weeks by far. I’m speaking about it, since current picture assumes solid probability for one more leg down. Major reason for that is too fast action CD leg of Fib extension. In such circumstances continuation usually happens. You can see that bounce up itself was a bit weak and has faded rather fast and overruled by solid return right back down to support area as well. So that will be second test of this area. That’s why I can’t exclude and even think that price really could follow to next support area where B&B could start. This is MPS1, approximately 50% Fib support, natural support, 1.618 AB-CD target and daily oversold – 100.60 area.

4-hour
This time frame in general confirms daily analysis and possible deeper move down. At the same time scenario of this move could be twofold. This will be either 1.618 Butterfly with target around 101.73 or, it could take shape of 3-Drive Buy pattern that points on possible reversal around WPS1=101.35. Also we have nicely looking MACD bullish divergence here. Since we do not know yet what particular pattern will work and weekly B&B pattern is significant and valuable for us, here we again should apply scale in entry technique probably. It means that we should take 25-30% of our usual position at 3-Drive target. If market will move lower – take the rest at butterfly target. Stop we will have to place below WPS1 and daily oversold level.

Conclusion:
Yen now is forming and already has formed some interesting patterns that are interesting for trading right now and some of them potentially could put foundation for market action in long-term perspective.
Thus, our long-term plan is to get monthly reversal pattern. Situation stands so that it easily could be B&B “Sell”. At the same time we already have got bearish engulfing and I do not see any reason why we should ignore it. As this pattern in general suggests downward action, but now it is almost a rule that after it has been completed market shows some minor bounce inside the body of this pattern. But this bounce absolutely does not look as “minor” on lower time frame charts and could become excellent object for trading per se. Thus daily chart makes possible to trade market up, while we wait signal for short entry.
The context for bullish trade is B&B “Buy” pattern. Still, as recent move down was really fast, we can’t exclude that market could pass lower a bit more. Thus our area that has to be monitored for long entry is 100.60- 101.35. Since it looks a bit wide and market can turn upward in any point of this range – we suggest that applying of scale-in technique is nice tool for resolving this uncertainty.
The technical portion of Sive's analysis owes a great deal to Joe DiNapoli's methods, and uses a number of Joe's proprietary indicators. Please note that Sive's analysis is his own view of the market and is not endorsed by Joe DiNapoli or any related companies.


