Sive Morten
Special Consultant to the FPA
- Messages
- 18,760
Monthly
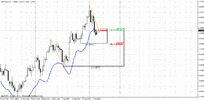
Market still stands around significant area - 50% monthly resistance from previous long swing down and that is the top of previous downward swing. As a rule, when market pretends on reversal – first sign of it is greater upward swing compares to previous downswing, i.e. when market breaks “lower highs, lower lows” tendency. What is also very significant is 1.3486 – is a high of 2012 as well. As we’ve suspected – market is not done yet with this level. Even penetration for 100-150 pips does not necessary mean breakout. Now we see that market has returned right back below 1.3486. Trend holds bullish here, and except of this level we see no barriers: absence of overbought, market has enough room to proceed higher and, what is more important, no resistances till our next destination area – 1.3830 major 5/8 monthly resistance.
At the same time, I would like to share another thought with you. 1.3774 is yearly pivot resistance 1. It stands in agreement with major Fib resistance. What do we know about Pivot Resistance 1? When market stands in long-term bear trend, PR1 should hold upward retracement if bearish trend and bear domination is still intact, right? So – we’ll see. The point is, if market will fail around 1.3830 and move below 1.3486 again – that’s the road to yearly pivot first – recall, it hasn’t been tested yet. However this is a bit extended view. On current week, we probably will dive into problem – how to catch the train to 1.3830...
So what is this – failure, or just retracement before breakout? I probably say – we don’t care, until we can get position in right place that will allow as taking as low risk as possible or even turning the trade to risk free one.

Weekly
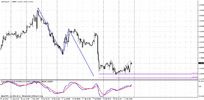
So, guys, I see nothing exciting for the bulls here. Yes, trend still bullish, market is not at oversold, but we have huge bearish engulfing pattern on weekly chart – that is not a piece a cake. Take a look at black candle of this pattern – if market would open slightly higher, we could get a “reversal” bar, because it has closed below the minimum of previous week - very impressive move. And take a look – market has closed below MPP. The trick of current situation stands so, that to be absolutely bullish – we need moving above the highs of engulfing pattern. But if market will get there – it will be too small room till AB=CD target to take long position. Based on this pattern, market can show retracement at minimum till 50%-61.8% support 1.3060-1.3180, that is also MPS1 and another previous swing high.
From another point of view, we have uncompleted weekly AB=CD for about 80 pips higher. Taking into consideration all these stuff, I would like to share with you some thoughts. Probably it makes sense to try a bit risky strategy, but it could give us position for both scenarios. As we will see below – market stands on significant support area (we’ve talked about it o Friday) and there is a nice probability of bounce, at least short-term. That is also very often happens, when market forms engulfing pattern – the next candle usually small retracement right back up.
So, we can try to take long at this strong support and use this respect and small bounce to place stop at breakeven. If engulfing pattern will fail and market will proceed with AB=CD – we can ride right till 1.38, while if we will become wrong – we probably will loose nothing, or just a little and then will start to search possibility for short entry.

Daily
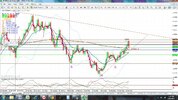
Daily trend has turned bearish. Actually, if we do not have uncompleted weekly AB-CD, I would probably search possibility for short entry here. Anyway, if even you’re bearish and want to enter short – it’s not the time yet. As you can see on the chart we stand at oversold and K-support, MPP, natural support and low of harmonic swing. As we’ve said – in fact we have DiNapoli bullish directional “Stretch” pattern that is based on market’s hankering to move out from uncomfortable oversold condition. Since currencies are financial markets – they rare stand in oversold for extended period of time.
Do not be confused by seeming of breakout. Sometimes this could happen, if market gravitates to some target that stands slightly lower than solid support level. Once market will hit it – it could return right back above this level. And we have this pattern on 4-hour chart…

1-hour
Here is the pattern that I’m talking about. See – its target stands slightly below daily strong support area, and here we see some signs of exhausting of downward move. Although safer way is to just wait how market response on this situation, I offer you to think another possibility. May be it will make sense to enter long around this area with Stretch pattern and use possible pullback for placing stop to breakeven?

Conclusion:
Currently is not quite clear yet – has market passed through significant resistance on monthly or not. On previous week it was looked like breakout has happened, but now we see mostly opposite picture.
To be honest the one thing, why I still do not totally refuse possibility of upward move is weekly AB=CD. Otherwise, I probably start to search possibility to enter short with no doubt and probably offer you just to wait a rally to sell into.
But since this AB=CD patterns adds some uncertainty, may be it makes sense to try take long position, having solid protection of daily support and oversold on your back? So, that lies with you to decide this.
The technical portion of Sive's analysis owes a great deal to Joe DiNapoli's methods, and uses a number of Joe's proprietary indicators. Please note that Sive's analysis is his own view of the market and is not endorsed by Joe DiNapoli or any related companies.
Market still stands around significant area - 50% monthly resistance from previous long swing down and that is the top of previous downward swing. As a rule, when market pretends on reversal – first sign of it is greater upward swing compares to previous downswing, i.e. when market breaks “lower highs, lower lows” tendency. What is also very significant is 1.3486 – is a high of 2012 as well. As we’ve suspected – market is not done yet with this level. Even penetration for 100-150 pips does not necessary mean breakout. Now we see that market has returned right back below 1.3486. Trend holds bullish here, and except of this level we see no barriers: absence of overbought, market has enough room to proceed higher and, what is more important, no resistances till our next destination area – 1.3830 major 5/8 monthly resistance.
At the same time, I would like to share another thought with you. 1.3774 is yearly pivot resistance 1. It stands in agreement with major Fib resistance. What do we know about Pivot Resistance 1? When market stands in long-term bear trend, PR1 should hold upward retracement if bearish trend and bear domination is still intact, right? So – we’ll see. The point is, if market will fail around 1.3830 and move below 1.3486 again – that’s the road to yearly pivot first – recall, it hasn’t been tested yet. However this is a bit extended view. On current week, we probably will dive into problem – how to catch the train to 1.3830...
So what is this – failure, or just retracement before breakout? I probably say – we don’t care, until we can get position in right place that will allow as taking as low risk as possible or even turning the trade to risk free one.

Weekly
So, guys, I see nothing exciting for the bulls here. Yes, trend still bullish, market is not at oversold, but we have huge bearish engulfing pattern on weekly chart – that is not a piece a cake. Take a look at black candle of this pattern – if market would open slightly higher, we could get a “reversal” bar, because it has closed below the minimum of previous week - very impressive move. And take a look – market has closed below MPP. The trick of current situation stands so, that to be absolutely bullish – we need moving above the highs of engulfing pattern. But if market will get there – it will be too small room till AB=CD target to take long position. Based on this pattern, market can show retracement at minimum till 50%-61.8% support 1.3060-1.3180, that is also MPS1 and another previous swing high.
From another point of view, we have uncompleted weekly AB=CD for about 80 pips higher. Taking into consideration all these stuff, I would like to share with you some thoughts. Probably it makes sense to try a bit risky strategy, but it could give us position for both scenarios. As we will see below – market stands on significant support area (we’ve talked about it o Friday) and there is a nice probability of bounce, at least short-term. That is also very often happens, when market forms engulfing pattern – the next candle usually small retracement right back up.
So, we can try to take long at this strong support and use this respect and small bounce to place stop at breakeven. If engulfing pattern will fail and market will proceed with AB=CD – we can ride right till 1.38, while if we will become wrong – we probably will loose nothing, or just a little and then will start to search possibility for short entry.

Daily
Daily trend has turned bearish. Actually, if we do not have uncompleted weekly AB-CD, I would probably search possibility for short entry here. Anyway, if even you’re bearish and want to enter short – it’s not the time yet. As you can see on the chart we stand at oversold and K-support, MPP, natural support and low of harmonic swing. As we’ve said – in fact we have DiNapoli bullish directional “Stretch” pattern that is based on market’s hankering to move out from uncomfortable oversold condition. Since currencies are financial markets – they rare stand in oversold for extended period of time.
Do not be confused by seeming of breakout. Sometimes this could happen, if market gravitates to some target that stands slightly lower than solid support level. Once market will hit it – it could return right back above this level. And we have this pattern on 4-hour chart…

1-hour
Here is the pattern that I’m talking about. See – its target stands slightly below daily strong support area, and here we see some signs of exhausting of downward move. Although safer way is to just wait how market response on this situation, I offer you to think another possibility. May be it will make sense to enter long around this area with Stretch pattern and use possible pullback for placing stop to breakeven?

Conclusion:
Currently is not quite clear yet – has market passed through significant resistance on monthly or not. On previous week it was looked like breakout has happened, but now we see mostly opposite picture.
To be honest the one thing, why I still do not totally refuse possibility of upward move is weekly AB=CD. Otherwise, I probably start to search possibility to enter short with no doubt and probably offer you just to wait a rally to sell into.
But since this AB=CD patterns adds some uncertainty, may be it makes sense to try take long position, having solid protection of daily support and oversold on your back? So, that lies with you to decide this.
The technical portion of Sive's analysis owes a great deal to Joe DiNapoli's methods, and uses a number of Joe's proprietary indicators. Please note that Sive's analysis is his own view of the market and is not endorsed by Joe DiNapoli or any related companies.
