Sive Morten
Special Consultant to the FPA
- Messages
- 18,673
Annual
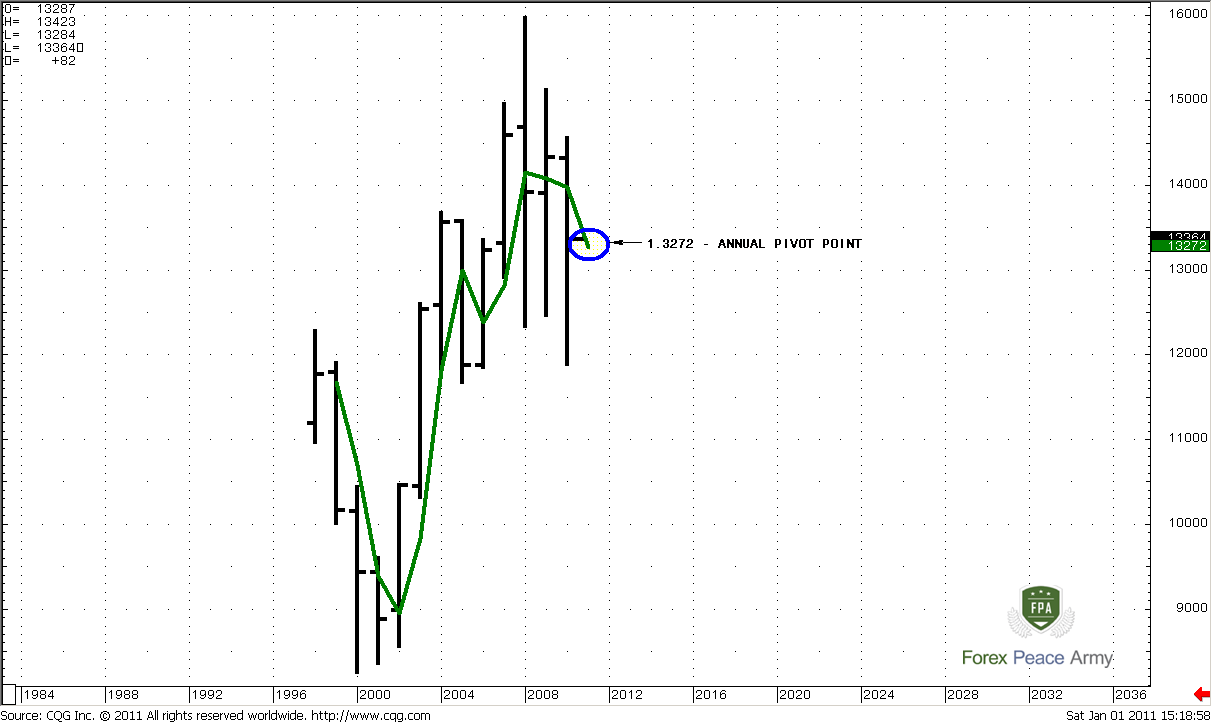
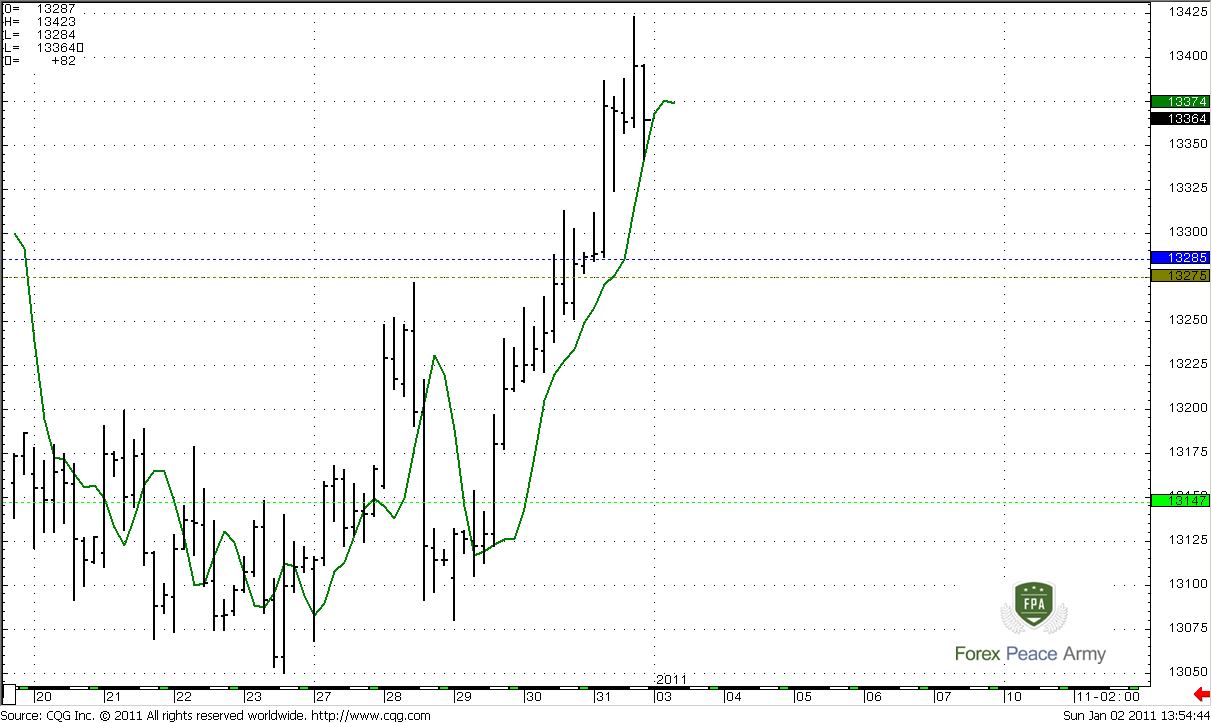
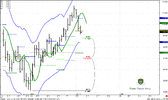
Today we will start from this really long-term view. I do not trade annual trends or something, but in the beginning of the year always look at one thing that seems to me important – yearly pivot point. As weekly pivots are traded by market in 70% of cases during the week – yearly pivot trades by the market in 70% of cases during the year. The green line on the chart is 1-period SMA at (H+L+C)/3 shifted forward for 1 period. This is nothing else than pivot point. So, the pivot point for 2011 is at 1.3272, and currently market is above it.
Well, in general this number is not so valuable, because it’s very close to current price action, but nevertheless this fact does not cancel its beacons qualities.
#1
Monthly
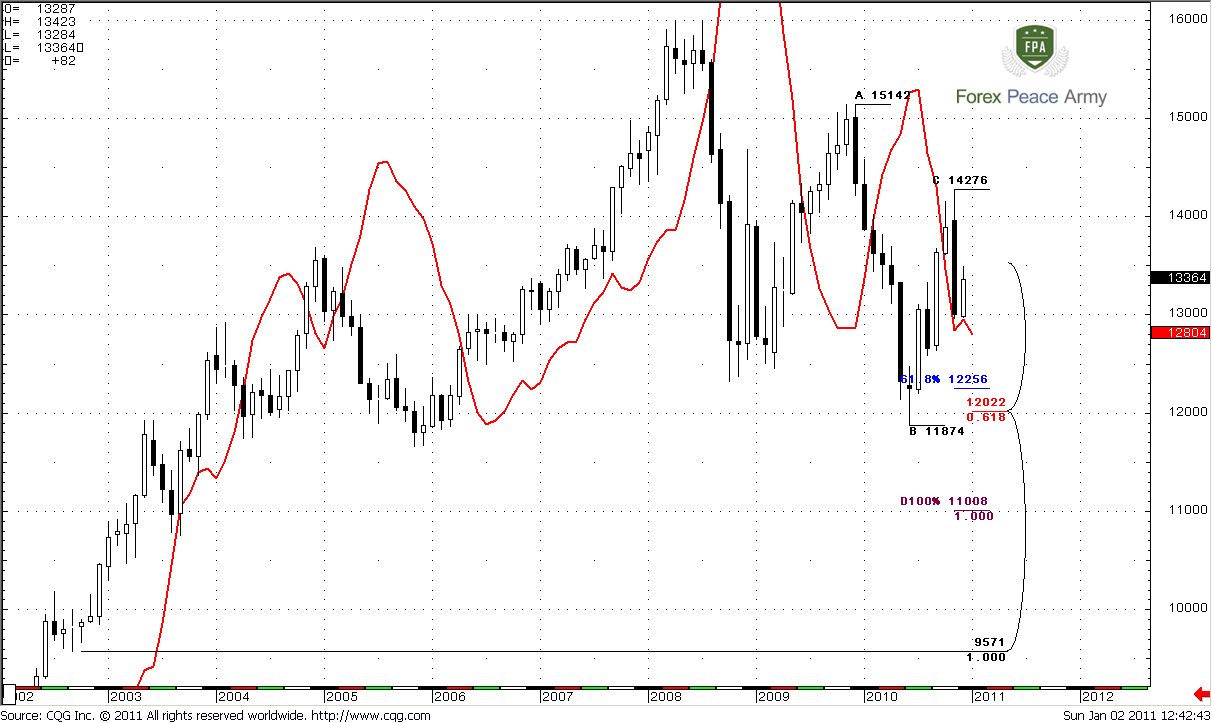
Monthly trend is bullish, but price action is not very impressive due to huge bearish engulfing pattern, that has happened month ago. If you remember, when it has happened, we’ve said that this pattern is a basis for next trading action, because this huge black candle is a tradable swing and we can use any retracement as a possibility for enter short. The next closest monthly target is 0.618 Fib expansion at 1.2256, next Fib support is 1.2022 that has been tested already once, but this penetration was very light, so I think that this level is still valid.
Weekly
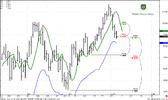
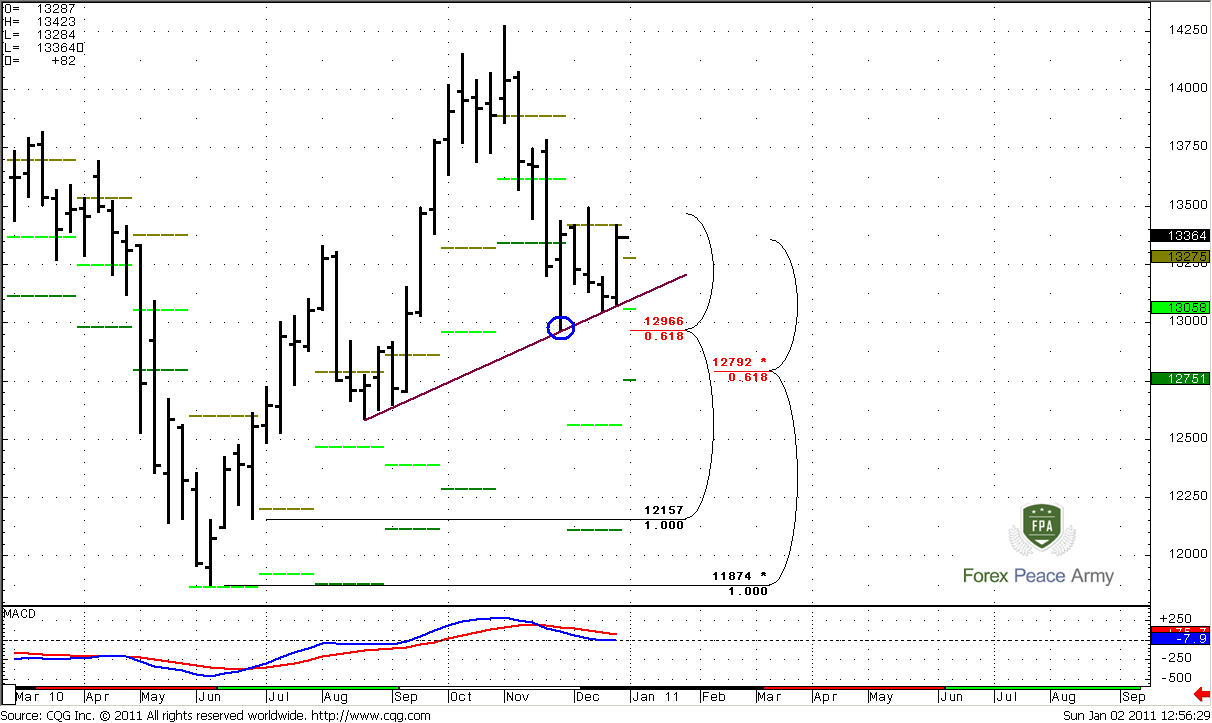
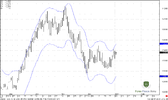
Weekly trend is clearly bearish. You can see the same levels that we’ve discussed couple weeks ago, but still we have to make a couple of notifications that are not so obvious. First, we see new numbers for monthly pivots. January pivot point stands at 1.3275 (so as Yearly one), monthly pivot support 1 at 1.3058 that is very close to Fib support at 1.2966.
Second, look at the hammer bar (or spike), which low is in blue circle. In previous analysis we’ve said that if market will take out this low, we can count on downside acceleration. Also, we’ve noted that sometimes, when market shows wide range bar, market can stay in this range for some time. So that has happened, we can see, that during next 5 weeks market stays in the range of this hammer. Why is it so important? Because as longer market stays in the range the more obvious it appears and range traders are trade them, stops accumulate as above the range as below. So, we can count on strong breakout.
Also I show you nice trend line. This is not H&S, but price action holds by this line very well.
#1
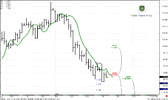
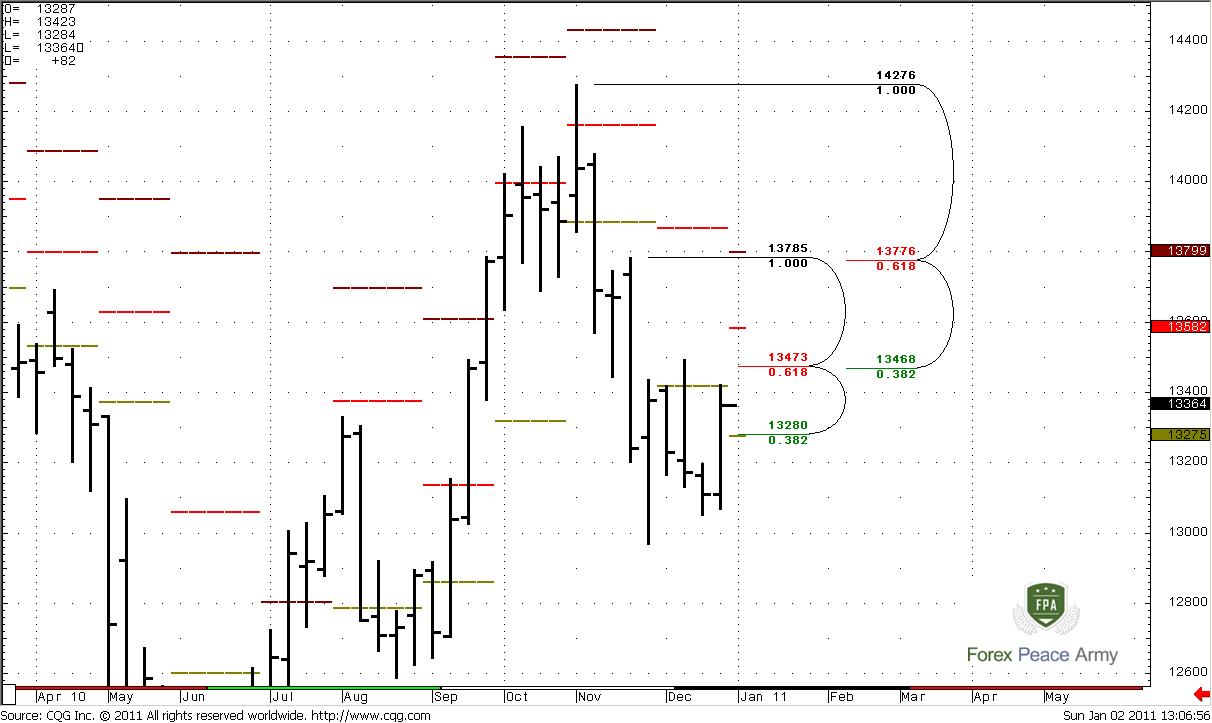
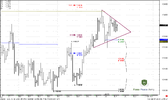
On the #2 chart we can see the last swing down and resistance levels. 1.3280 is no more the Fib resistance, because it has been erased by price action. The next strong area of resistance is 1.3468-1.3473 Confluence resistance. Monthly pivot resistance 1 is at 1.3582. Very often, when market corrects in the long-term bear trend, it corrects to pivot resistance 1.
#2
Daily
Daily trend is bullish, market has reached 0.618 expansion target at 1.3380 that we’ve expected. The next target is 100% expansion at 1.3580. Also, as we already know, this is monthly pivot resistance 1 at 1.3582. But this target is not logical currently because it beyond the blue line – level of overbought. Meantime, just above the market is very solid resistance area. Judge by yourself – 1.3455-1.3460 daily/weekly Confluence resistance, 1.3483 daily overbought and 1.3502 (red dash line) weekly pivot resistance 1. So currently is not the level to establish Long positions. The probability suggests that market should bounce from this area, at least during the first touch. So, if you are bullish – wait the pullback to support, if you’re bearish – look for sell signal in this area.
#1

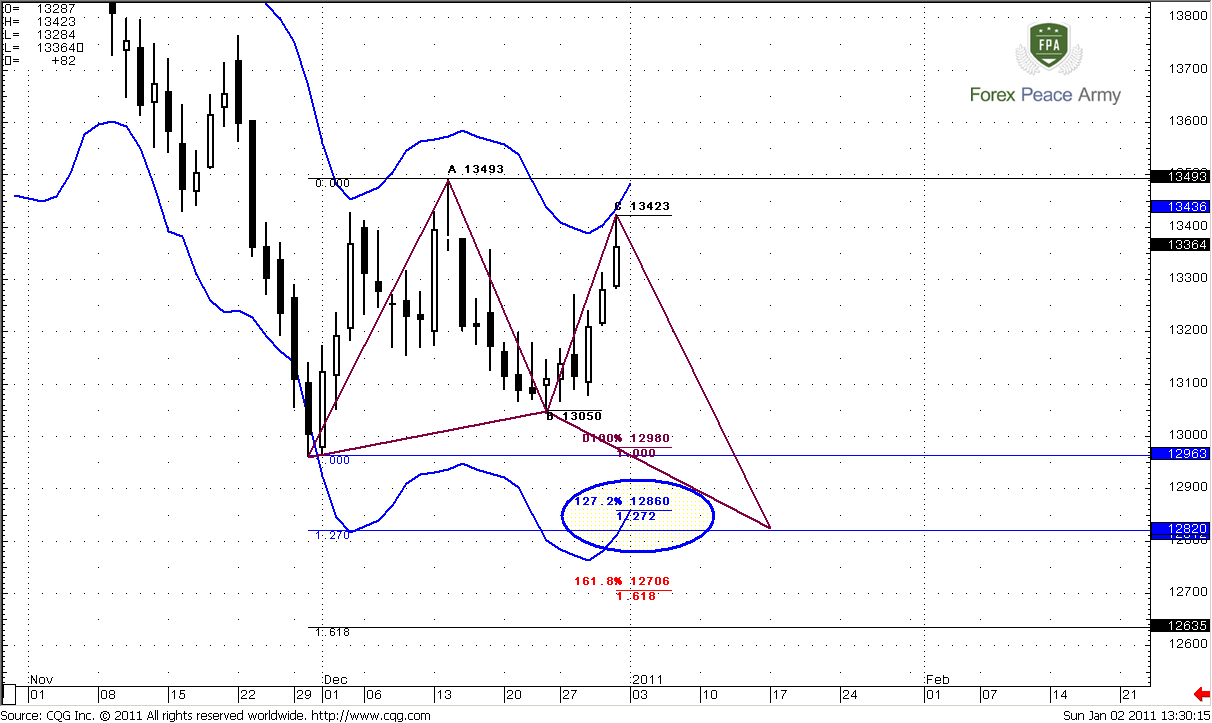
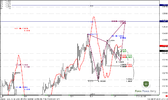
And here is another interesting picture. If point “C” is in place or at least it will be below A-point at 1.3493, then butterfly could come to life, especially, if we take into consideration strong resistance area just 30 pips above it. If this will really happen, I’m not saying “it has to”, then, the initial target of butterfly is 1.272 expansion – 1.2820. Also take a look at ABC-top pattern – 1.27 expansion is at 1.2860 – very close to the Butterfly target. This will be also the level of daily oversold. I suppose that this will be the next downside target. The extended target is 1.618 of butterfly at 1.2635. But there is one area exists that will be crucial for price action during the next week – let’s shift to intraday analysis.
#2
4- Hour
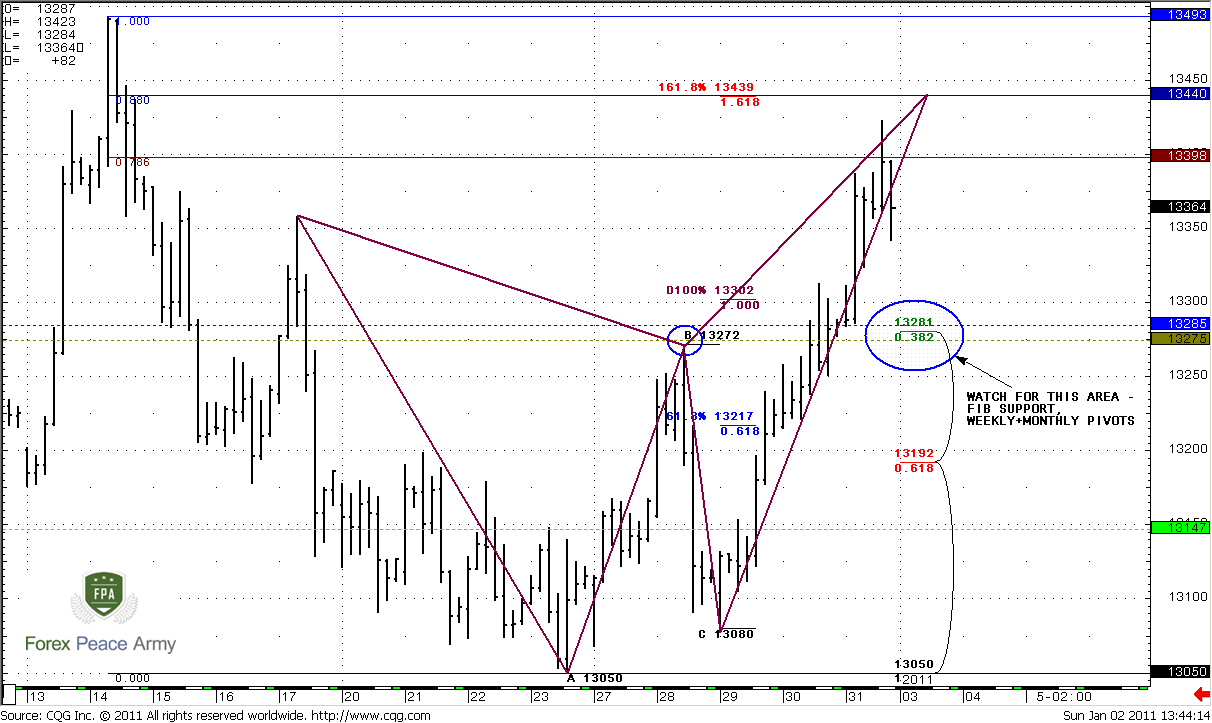
Well, #1 chat is a bit overload with details, but it’s just a goldmine for scalpers, because market has strong areas as above it, as below. So, let’s start from the points that we’ve discussed on Friday. First, just above the market the combination of different resistance areas – 0.88 Fib resistance at 1.3440, 1.618 Fib target at 1.3439, 1.27 target of Butterfly “Sell” that is also at 1.3440. Now, you could surplus to this stuff daily Confluence resistance 1.3450-1.3460 and overbought, and everything becomes clear. I think that something extraordinary should happen for market will break this area to the upside. So, if you’re bearish – wait for Sell signals around 1.3440-1.3450 area.
Second, if market will pull down from there, the first area that will support it will be 1.3275-1.3285 that includes yearly pivot point, weekly pivot (blue dash line), monthly pivot (gold dash line) and Fib support. Depending, on how market will response there, the further move could be difference. If pivots will hold market and market will stay above them – better is to close short positions. So, if you’re bullish, you can use this signal for entering long with stops below 1.3147 – weekly pivot support 1.
#1
On the #2 chart we see excellent context for possible DRPO Sell pattern. 4-hour chart shows excellent thrust up. We do not see any close below 3x3 MA yet, but I prefer to see it as follows – close below 3x3 then close above and making new highs, during which market reaching the targets at 1.3440 and then close below 3x3 again – this will be prefect sell signal as in terms of pattern as in terms of market mechanic.
#2
Conclusion: I still think that the recent swing down on monthly chart is absolutely tradable and there are no signs yet that bears has lost control over the market. On coming week I expect that market should reach 1.3440-1.3460 area and show sell signals in the beginning of the week. Watch for 1.3270-1.3280 area. If market will pass through it to the downside – you can hold shorts. If not – better will be to close shorts. This could be the first bell, that market can continue move higher to the next target at 1.3580.
The technical portion of Sive's analysis owes a great deal to Joe DiNapoli's methods, and uses a number of Joe's proprietary indicators. Please note that Sive's analysis is his own view of the market and is not endorsed by Joe DiNapoli or any related companies.
Today we will start from this really long-term view. I do not trade annual trends or something, but in the beginning of the year always look at one thing that seems to me important – yearly pivot point. As weekly pivots are traded by market in 70% of cases during the week – yearly pivot trades by the market in 70% of cases during the year. The green line on the chart is 1-period SMA at (H+L+C)/3 shifted forward for 1 period. This is nothing else than pivot point. So, the pivot point for 2011 is at 1.3272, and currently market is above it.
Well, in general this number is not so valuable, because it’s very close to current price action, but nevertheless this fact does not cancel its beacons qualities.
#1
Monthly
Monthly trend is bullish, but price action is not very impressive due to huge bearish engulfing pattern, that has happened month ago. If you remember, when it has happened, we’ve said that this pattern is a basis for next trading action, because this huge black candle is a tradable swing and we can use any retracement as a possibility for enter short. The next closest monthly target is 0.618 Fib expansion at 1.2256, next Fib support is 1.2022 that has been tested already once, but this penetration was very light, so I think that this level is still valid.
Weekly
Weekly trend is clearly bearish. You can see the same levels that we’ve discussed couple weeks ago, but still we have to make a couple of notifications that are not so obvious. First, we see new numbers for monthly pivots. January pivot point stands at 1.3275 (so as Yearly one), monthly pivot support 1 at 1.3058 that is very close to Fib support at 1.2966.
Second, look at the hammer bar (or spike), which low is in blue circle. In previous analysis we’ve said that if market will take out this low, we can count on downside acceleration. Also, we’ve noted that sometimes, when market shows wide range bar, market can stay in this range for some time. So that has happened, we can see, that during next 5 weeks market stays in the range of this hammer. Why is it so important? Because as longer market stays in the range the more obvious it appears and range traders are trade them, stops accumulate as above the range as below. So, we can count on strong breakout.
Also I show you nice trend line. This is not H&S, but price action holds by this line very well.
#1
On the #2 chart we can see the last swing down and resistance levels. 1.3280 is no more the Fib resistance, because it has been erased by price action. The next strong area of resistance is 1.3468-1.3473 Confluence resistance. Monthly pivot resistance 1 is at 1.3582. Very often, when market corrects in the long-term bear trend, it corrects to pivot resistance 1.
#2
Daily
Daily trend is bullish, market has reached 0.618 expansion target at 1.3380 that we’ve expected. The next target is 100% expansion at 1.3580. Also, as we already know, this is monthly pivot resistance 1 at 1.3582. But this target is not logical currently because it beyond the blue line – level of overbought. Meantime, just above the market is very solid resistance area. Judge by yourself – 1.3455-1.3460 daily/weekly Confluence resistance, 1.3483 daily overbought and 1.3502 (red dash line) weekly pivot resistance 1. So currently is not the level to establish Long positions. The probability suggests that market should bounce from this area, at least during the first touch. So, if you are bullish – wait the pullback to support, if you’re bearish – look for sell signal in this area.
#1
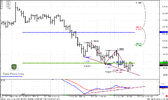
And here is another interesting picture. If point “C” is in place or at least it will be below A-point at 1.3493, then butterfly could come to life, especially, if we take into consideration strong resistance area just 30 pips above it. If this will really happen, I’m not saying “it has to”, then, the initial target of butterfly is 1.272 expansion – 1.2820. Also take a look at ABC-top pattern – 1.27 expansion is at 1.2860 – very close to the Butterfly target. This will be also the level of daily oversold. I suppose that this will be the next downside target. The extended target is 1.618 of butterfly at 1.2635. But there is one area exists that will be crucial for price action during the next week – let’s shift to intraday analysis.
#2
4- Hour
Well, #1 chat is a bit overload with details, but it’s just a goldmine for scalpers, because market has strong areas as above it, as below. So, let’s start from the points that we’ve discussed on Friday. First, just above the market the combination of different resistance areas – 0.88 Fib resistance at 1.3440, 1.618 Fib target at 1.3439, 1.27 target of Butterfly “Sell” that is also at 1.3440. Now, you could surplus to this stuff daily Confluence resistance 1.3450-1.3460 and overbought, and everything becomes clear. I think that something extraordinary should happen for market will break this area to the upside. So, if you’re bearish – wait for Sell signals around 1.3440-1.3450 area.
Second, if market will pull down from there, the first area that will support it will be 1.3275-1.3285 that includes yearly pivot point, weekly pivot (blue dash line), monthly pivot (gold dash line) and Fib support. Depending, on how market will response there, the further move could be difference. If pivots will hold market and market will stay above them – better is to close short positions. So, if you’re bullish, you can use this signal for entering long with stops below 1.3147 – weekly pivot support 1.
#1
On the #2 chart we see excellent context for possible DRPO Sell pattern. 4-hour chart shows excellent thrust up. We do not see any close below 3x3 MA yet, but I prefer to see it as follows – close below 3x3 then close above and making new highs, during which market reaching the targets at 1.3440 and then close below 3x3 again – this will be prefect sell signal as in terms of pattern as in terms of market mechanic.
#2
Conclusion: I still think that the recent swing down on monthly chart is absolutely tradable and there are no signs yet that bears has lost control over the market. On coming week I expect that market should reach 1.3440-1.3460 area and show sell signals in the beginning of the week. Watch for 1.3270-1.3280 area. If market will pass through it to the downside – you can hold shorts. If not – better will be to close shorts. This could be the first bell, that market can continue move higher to the next target at 1.3580.
The technical portion of Sive's analysis owes a great deal to Joe DiNapoli's methods, and uses a number of Joe's proprietary indicators. Please note that Sive's analysis is his own view of the market and is not endorsed by Joe DiNapoli or any related companies.
") joh
joh