Sive Morten
Special Consultant to the FPA
- Messages
- 18,781
Monthly
As Reuters reports, The dollar rose broadly on Friday, buoyed by comments made by outgoing Federal Reserve Chairman Ben Bernanke and by risk aversion but a major snowstorm blanketing the Northeast of the United States kept trade thin. A heavy snowstorm and dangerously cold conditions gripped the northeastern United States, delaying flights, paralyzing road travel and closing schools and government offices across the region. The governors of New York and New Jersey declared states of emergency. “You have a holiday week, which is always going to be pretty light on volume and with most of the Northeast digging itself out of the snowstorm, that has made activity especially light, even for a holiday week,” said Omer Esiner, chief market analyst at Commonwealth Foreign Exchange in Washington, D.C.
The dollar gained ground after comments made by the Fed's Bernanke. The Fed is no less committed to highly accommodative policy now that it has trimmed its bond-buying stimulus, he said on Friday in what could be his last speech as Fed chairman. Bernanke, who steps down as head of the U.S. central bank at month's end, gave an upbeat assessment of the U.S. economy in coming quarters. But he tempered the good news in housing, finance and fiscal policies by repeating that the overall recovery "clearly remains incomplete" in the United States.
“The rebound in the yen is carryover from yesterday’s sell-off in equities and we also saw U.S. bond yields pull back from the higher end of their ranges," Commonwealth's Esiner said. "Both of those factors provided investors an excuse to book some profit on the yen’s decline.” "With U.S. 10-year Treasury yields back at three percent, we have already seen the yen pare some of its overnight gains and it is trading well off its overnight highs,” he said.
The dollar index, which tracks the greenback against six major currencies, was up 0.3 percent at 80.854, having hit a two-week high on Thursday as a slew of generally positive U.S. economic data reinforced expectations the Fed will continue to move away from its bond purchases.
A measure of future U.S. economic growth rose last week to its strongest since April 2010, while the annualized growth rate stayed steady, a research group said on Friday. The Economic Cycle Research Institute, a New York-based independent forecasting group, said its Weekly Leading Index increased to 132.9 in the week ended Dec. 27 from 131.9 the previous week. The index's annualized growth rate was 1.8 percent, the same as a week earlier. The previous week's figure was originally reported at 1.9 percent.
"January is a bit of a messy month for foreign exchange," said Simon Smith, head of research at FxPro. "Volumes are still thin ... things are very much driven by flows. "I don't think the yen is a one-way bet in 2014. The easy wins have been had. Always the most run-over people in the markets are yen bears." Smith expects dollar/yen to end the year at 109 yen per dollar.
Looking ahead, next week will include the release of the minutes from the Federal Reserve’s December meeting and key U.S. labor market data. The Fed’s minutes on Wednesday will be watched for signs over how far the Fed may further reduce its bond-buying program. Last month it said it would cut mortgage-backed securities and Treasuries purchases by $10 billion to $75 billion a month. The Fed faces "immense" challenges now that it has reduced bond-buying, and needs to be cognizant of a rapid rise in future inflation, Philadelphia Fed President Charles Plosser, a voter on monetary policy this year, said on Friday.
Meanwhile, the euro - whose second-half rally was driven by factors such as euro zone banks repatriating funds to shore up their capital bases and repaying cheap loans to the European Central Bank - has retreated from a two-year high of $1.3892 touched last Friday.
Technical
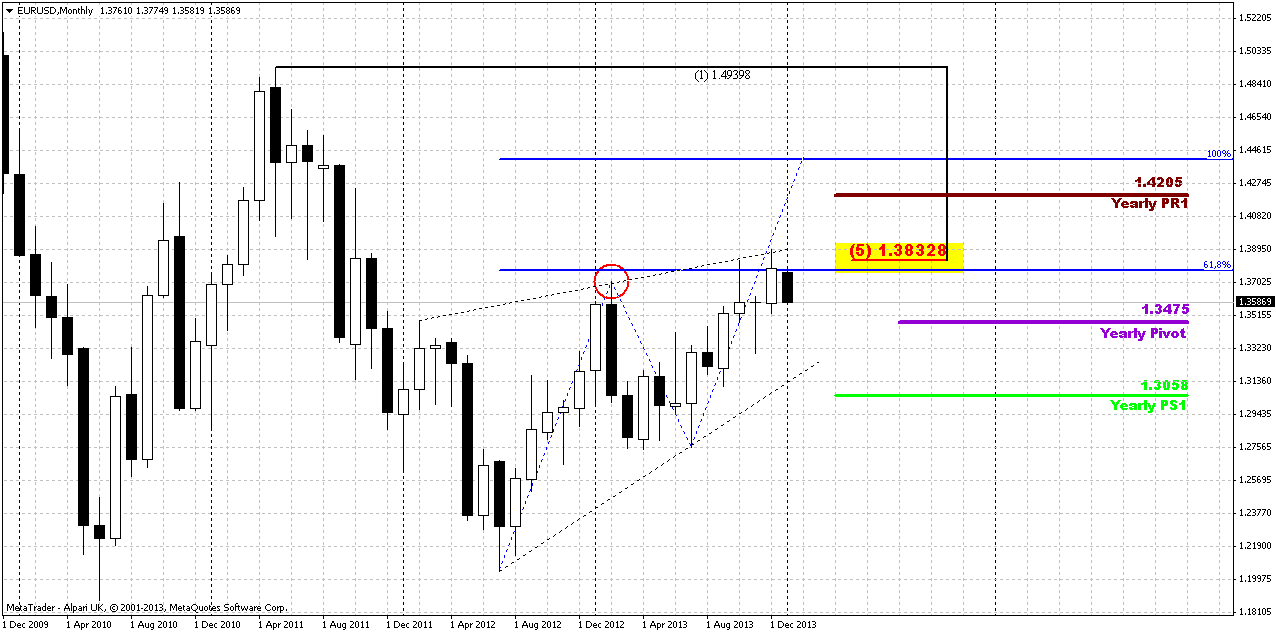
As this is first research in 2014 and following to our tradition, let’s draw new Yearly Pivots on the chart. On previous year market has done well around them. Prticularly speaking has tested YPP~1.2975 in summer and has finished year right around YPR1.
Appearing of YPP=1.3475 in current situation could play significant part on our analysis, since market stands just 100 pips above it. As we know that price always gravitates to pivot, this moment significantly increases the probability of more extended move down in short-term perspective.
Although we see solid downward action right now, but since monthly time frame is really big picture – this move has no drastical value yet. Most important here is recent 3-4 candles. Previously we’ve said that until market stands around current highs and above 1.33 chances on upward continuation still exists.
If we will follow to market mechanics, we’ll see that currently market should not show any solid retracement down. Any move of this kind should be treated as market weakness and it will increase probability of reversal. Take a look that as market has hit minor 0.618 AB-CD extension target right at rock hard resistance – Fib level and Agreemen and former yearly PR1, it has shown reasonable bounce down and now it has tested it again. As retracement after 0.618 target already has happened, it is unlogical and unreasonable to see another deep bounce and it will look suspicious. Right now market still stands on the edge here. From one point of view price has failed yesterday to break up, but from another one – it still stands very close to previous highs. Thus, by looking at monthly chart we can’t say yet that price has reversed down already.
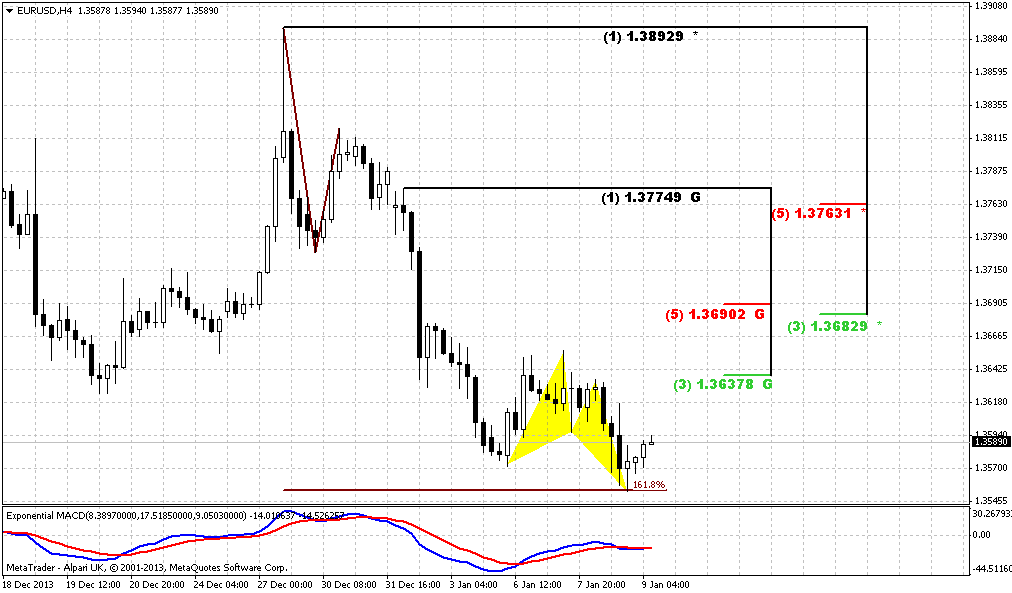
Weekly
Weekly chart is a corner stone of EUR situation. First of all, take a look, that market has completed our short-term suggestion about previous highs clearing that was based on bullish dynamic pressure and stop grabber on previous week.
As EUR still holds around previous highs it’s very difficult to say “this is definitely reversal” or “this is definitely continuation”. Here we have to estimate clear conditions when we can treat price action as reversal and when it will be continuation. Signs and patterns that EUR shows us now have more bearish sentiment, rather than bullish. Here what we have – Butterfly “Sell” is forming right around major monthly resistance, price still can’t pass through it. Current AB-CD pattern has reached minor 0.618 target, but CD leg is much flatter than AB and this is the sign of weakness. On previous week trend has turned bearish and we’ve got bearish divergence here right at monthly resistance. As previous move down was solid and in fact, engulfs the action of previous 4-5 weeks, chances on reaching butterfly target become blur.
Our ideal criteria of reversal was to see butterfly completion and then – move below 1.33 lows. By looking at current action I’m not as sure with butterfly’s completion. Thus, we need at least move below 1.33 lows. In this case we will get reversal swing on weekly chart that could become at least something that could confirm downward ambitions.
Conversely, to speak about upward continuation, we need to get fulfilling of two conditions as well – market should coil around previous tops without significant retracement, and second – move above 1.3980 – butterfly 1.27 target. In this case next target will be right around 1.43-1.44 – weekly AB-CD, Yearly PR1 and butterfly 1.618. While market will stand inside of specified ranges – we can trade it based on lower time frame (daily and hourly) patterns and setups. Particularly speaking, daily chart should clarify whether we could count on reaching butterfly’s target on weekly or not.
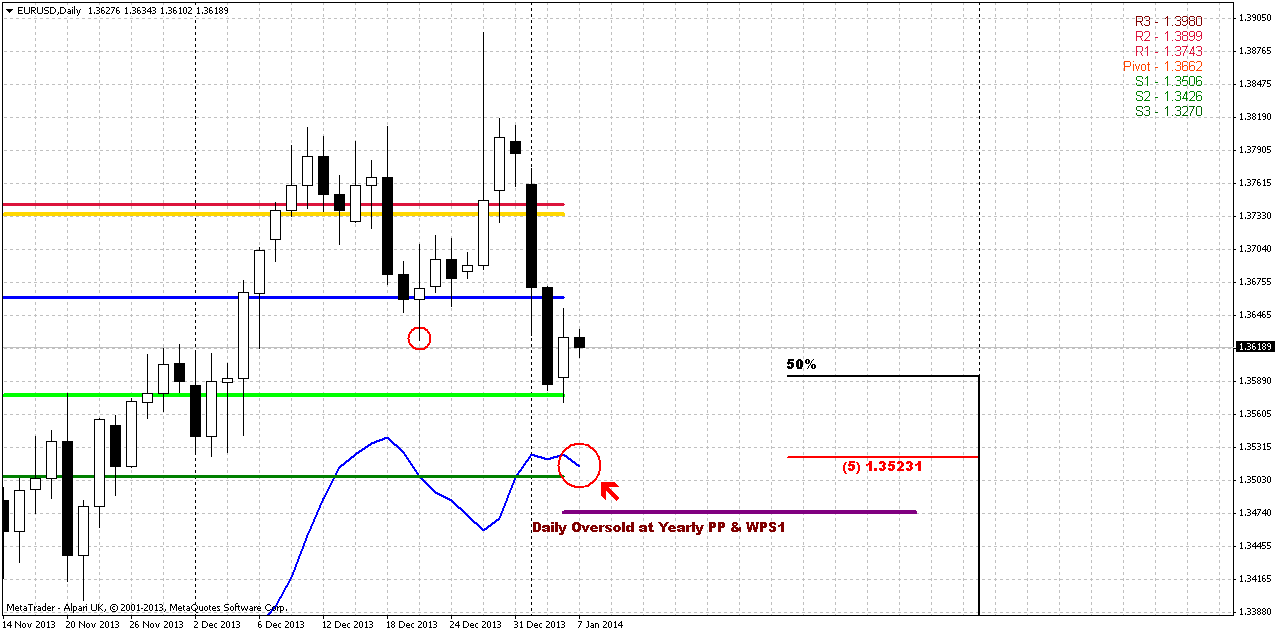
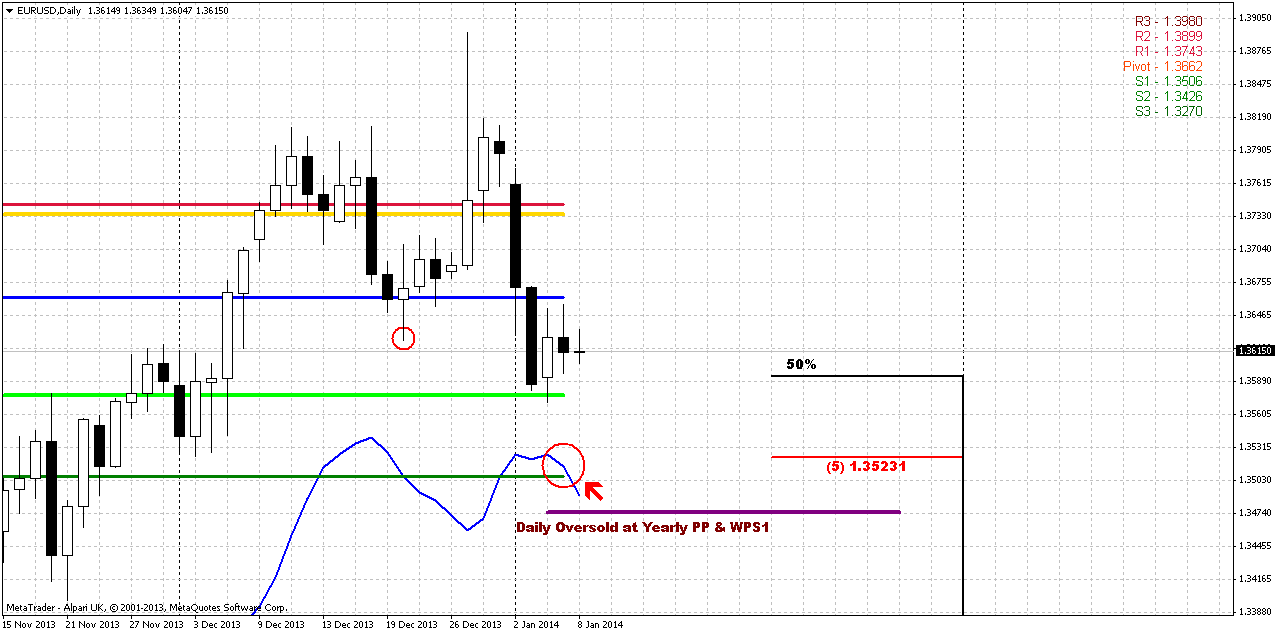
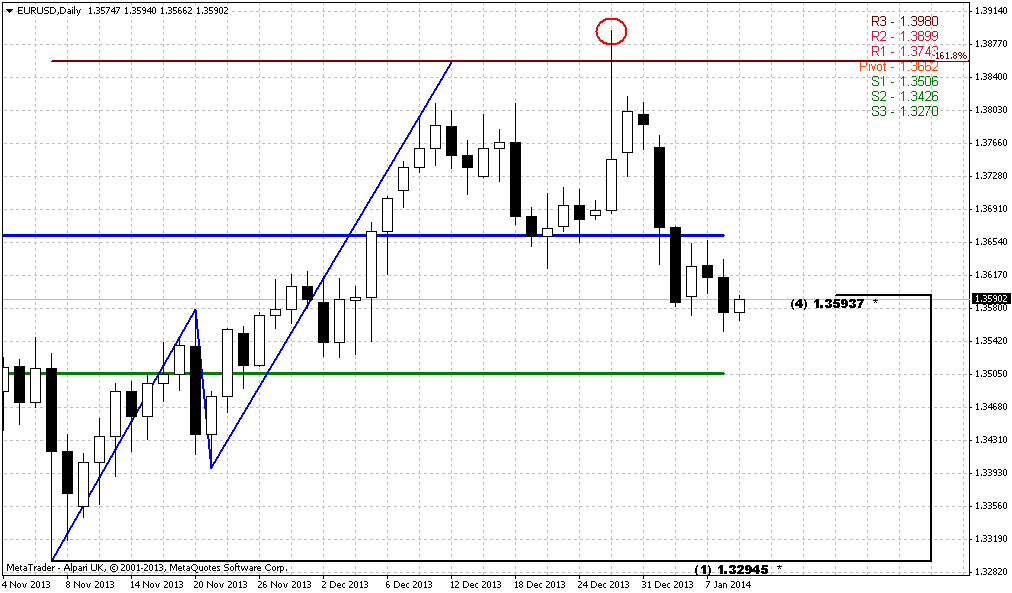
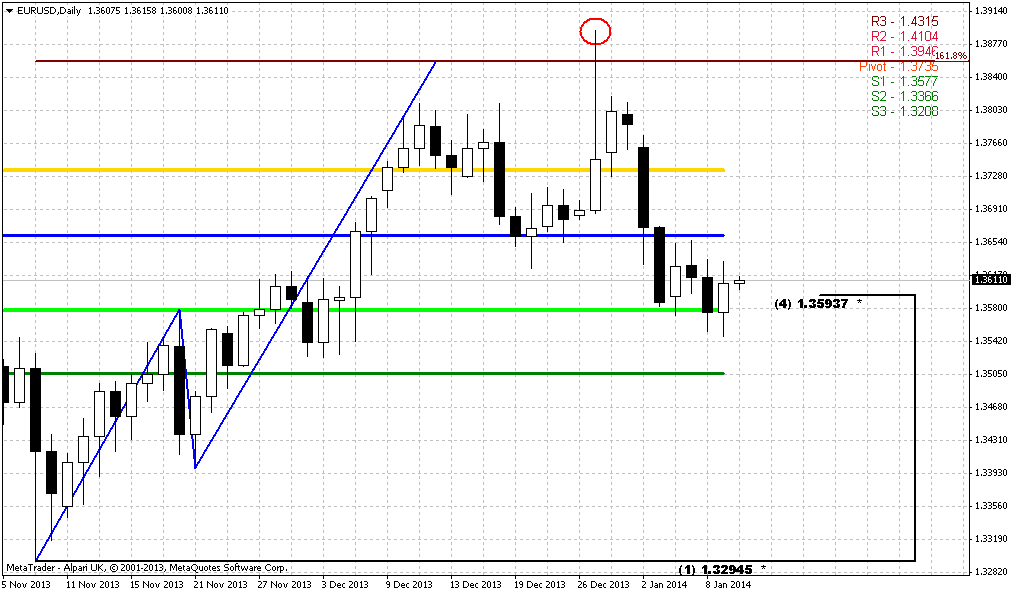
Daily
So, market has completed our short-term targets rather fast – as intraday AB-CD targets, as daily grabber and Stretch pattern have reached their minimum destinations. But now we have other beacons here. First is, I do not see any patterns that could hint on possible reaching of weekly butterfly’s target. Actually, I do not see any bullish setups here at all. Market has passed through daily K-support area without any respect. Recent action down is really fast – market opened at the top and closed at the bottom. Appearing of YPP slightly below current level also will attract price action.
That’s why I suspect that market could show some upward retracement since it stands at support – favorite 50% level and MPS1. But after retracement some continuation to WPS1, daily Overbought and YPP is possible – 1.3475-1.35 area. Trend here is bearish as well.
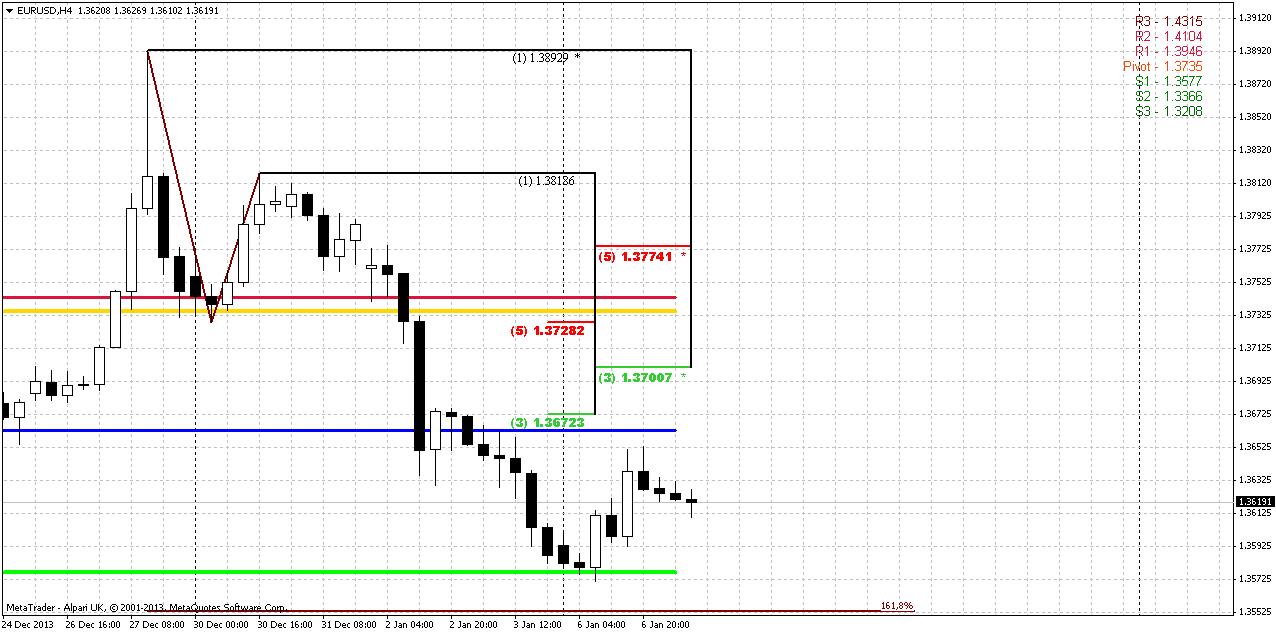
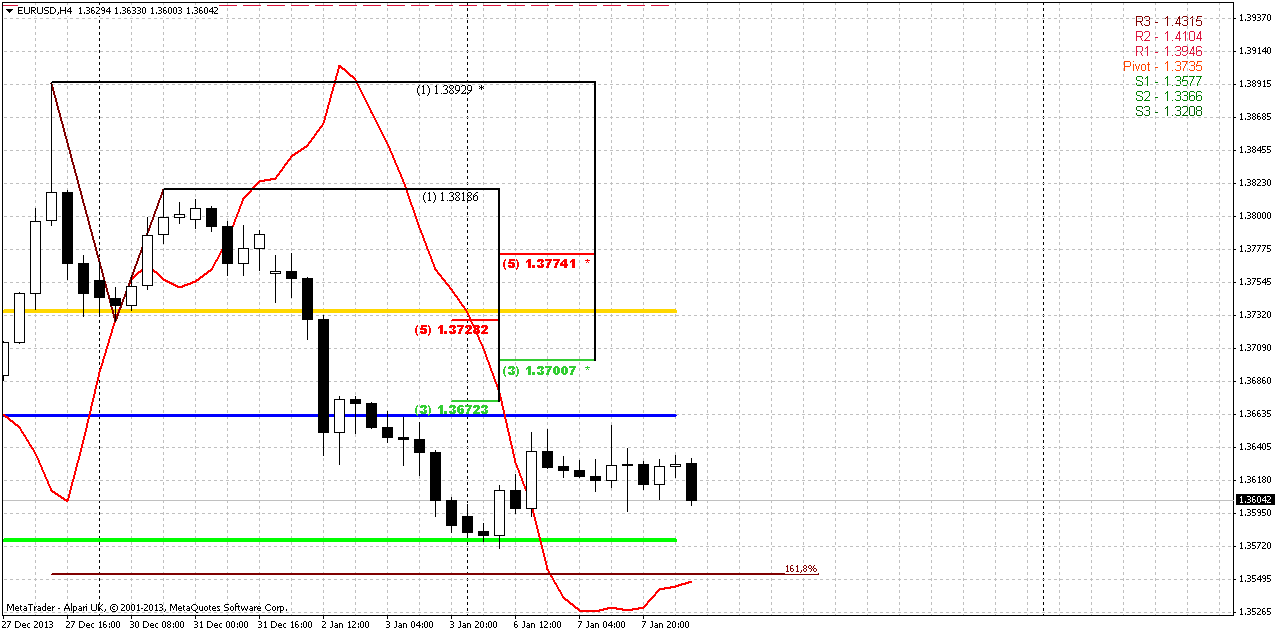
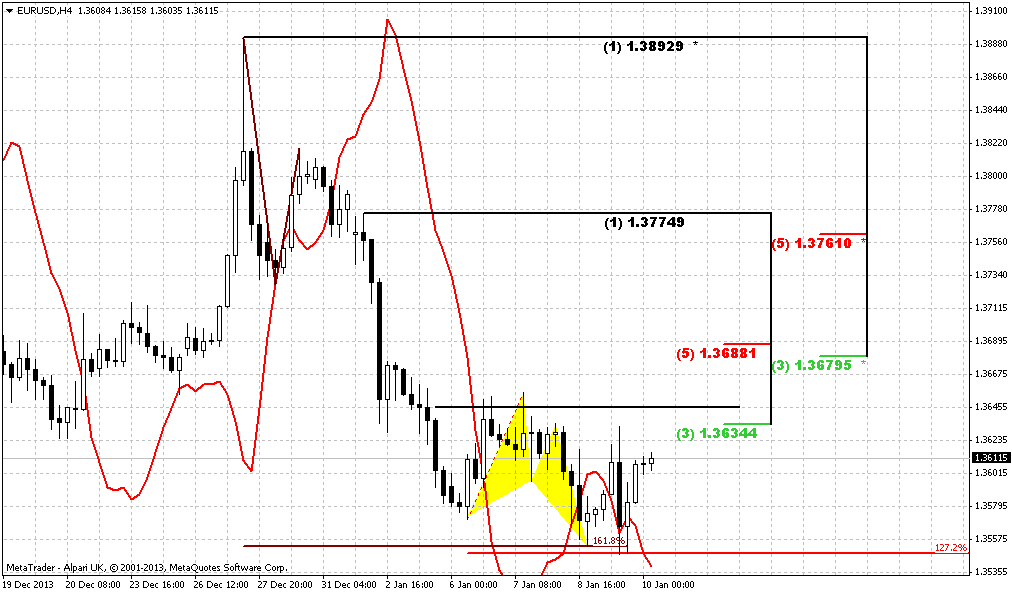
4-hour
Here we see that although market stands at support on daily, it has not quite hit 1.618 extension of AB=CD pattern. Thus, it is difficult to tell how precisely retracement up will start – either market will open lower, right at 1.618 at turn north, or it will move down a bit first, or some other way. But, anyway there are two levels where retracement could finish. First one is WPP and 1.3672 Fib level ad second – K-resistance 1.37-1.3730 and combination of MPP and WPR1. Besides 1.3730 is approximately 50% major resistance. Thus, if price will hit 1.618 target first and start retracement second – bounce probably will be deeper, while if retracement will start before reaching of 1.618 target, in this case market could stop pullback around WPP.
Conclusion:
Despite all positive USD data of previous week, action on EUR does not suggest yet total and final reversal. Price still coiling around edge point and currently chances exist as for upward breakout as for downward reversal, although in recent time downward direction has become dominate. To rely on direction whatever it will be, we need to get clear patterns that could confirm it and point extended targets for us.
Until this will not happen, we probably will have to deal with scalp fast trades on daily chart and lower ones. Thus, approximately we can assume that move above current highs will suggest upward continuation, while breakout below 1.33 will be first sign of possible downward reversal on long-term charts.
In shorter-term perspective market shows solid move down that probably will continue. Appearing of Yearly PP around 1.3475 makes it’s reaching very probable. Thus, in the beginning of the week some retracement could happen (to 1.3670 or 1.3730 area) but then downward action probably will continue.
The technical portion of Sive's analysis owes a great deal to Joe DiNapoli's methods, and uses a number of Joe's proprietary indicators. Please note that Sive's analysis is his own view of the market and is not endorsed by Joe DiNapoli or any related companies.
As Reuters reports, The dollar rose broadly on Friday, buoyed by comments made by outgoing Federal Reserve Chairman Ben Bernanke and by risk aversion but a major snowstorm blanketing the Northeast of the United States kept trade thin. A heavy snowstorm and dangerously cold conditions gripped the northeastern United States, delaying flights, paralyzing road travel and closing schools and government offices across the region. The governors of New York and New Jersey declared states of emergency. “You have a holiday week, which is always going to be pretty light on volume and with most of the Northeast digging itself out of the snowstorm, that has made activity especially light, even for a holiday week,” said Omer Esiner, chief market analyst at Commonwealth Foreign Exchange in Washington, D.C.
The dollar gained ground after comments made by the Fed's Bernanke. The Fed is no less committed to highly accommodative policy now that it has trimmed its bond-buying stimulus, he said on Friday in what could be his last speech as Fed chairman. Bernanke, who steps down as head of the U.S. central bank at month's end, gave an upbeat assessment of the U.S. economy in coming quarters. But he tempered the good news in housing, finance and fiscal policies by repeating that the overall recovery "clearly remains incomplete" in the United States.
“The rebound in the yen is carryover from yesterday’s sell-off in equities and we also saw U.S. bond yields pull back from the higher end of their ranges," Commonwealth's Esiner said. "Both of those factors provided investors an excuse to book some profit on the yen’s decline.” "With U.S. 10-year Treasury yields back at three percent, we have already seen the yen pare some of its overnight gains and it is trading well off its overnight highs,” he said.
The dollar index, which tracks the greenback against six major currencies, was up 0.3 percent at 80.854, having hit a two-week high on Thursday as a slew of generally positive U.S. economic data reinforced expectations the Fed will continue to move away from its bond purchases.
A measure of future U.S. economic growth rose last week to its strongest since April 2010, while the annualized growth rate stayed steady, a research group said on Friday. The Economic Cycle Research Institute, a New York-based independent forecasting group, said its Weekly Leading Index increased to 132.9 in the week ended Dec. 27 from 131.9 the previous week. The index's annualized growth rate was 1.8 percent, the same as a week earlier. The previous week's figure was originally reported at 1.9 percent.
"January is a bit of a messy month for foreign exchange," said Simon Smith, head of research at FxPro. "Volumes are still thin ... things are very much driven by flows. "I don't think the yen is a one-way bet in 2014. The easy wins have been had. Always the most run-over people in the markets are yen bears." Smith expects dollar/yen to end the year at 109 yen per dollar.
Looking ahead, next week will include the release of the minutes from the Federal Reserve’s December meeting and key U.S. labor market data. The Fed’s minutes on Wednesday will be watched for signs over how far the Fed may further reduce its bond-buying program. Last month it said it would cut mortgage-backed securities and Treasuries purchases by $10 billion to $75 billion a month. The Fed faces "immense" challenges now that it has reduced bond-buying, and needs to be cognizant of a rapid rise in future inflation, Philadelphia Fed President Charles Plosser, a voter on monetary policy this year, said on Friday.
Meanwhile, the euro - whose second-half rally was driven by factors such as euro zone banks repatriating funds to shore up their capital bases and repaying cheap loans to the European Central Bank - has retreated from a two-year high of $1.3892 touched last Friday.
Technical
As this is first research in 2014 and following to our tradition, let’s draw new Yearly Pivots on the chart. On previous year market has done well around them. Prticularly speaking has tested YPP~1.2975 in summer and has finished year right around YPR1.
Appearing of YPP=1.3475 in current situation could play significant part on our analysis, since market stands just 100 pips above it. As we know that price always gravitates to pivot, this moment significantly increases the probability of more extended move down in short-term perspective.
Although we see solid downward action right now, but since monthly time frame is really big picture – this move has no drastical value yet. Most important here is recent 3-4 candles. Previously we’ve said that until market stands around current highs and above 1.33 chances on upward continuation still exists.
If we will follow to market mechanics, we’ll see that currently market should not show any solid retracement down. Any move of this kind should be treated as market weakness and it will increase probability of reversal. Take a look that as market has hit minor 0.618 AB-CD extension target right at rock hard resistance – Fib level and Agreemen and former yearly PR1, it has shown reasonable bounce down and now it has tested it again. As retracement after 0.618 target already has happened, it is unlogical and unreasonable to see another deep bounce and it will look suspicious. Right now market still stands on the edge here. From one point of view price has failed yesterday to break up, but from another one – it still stands very close to previous highs. Thus, by looking at monthly chart we can’t say yet that price has reversed down already.
Weekly
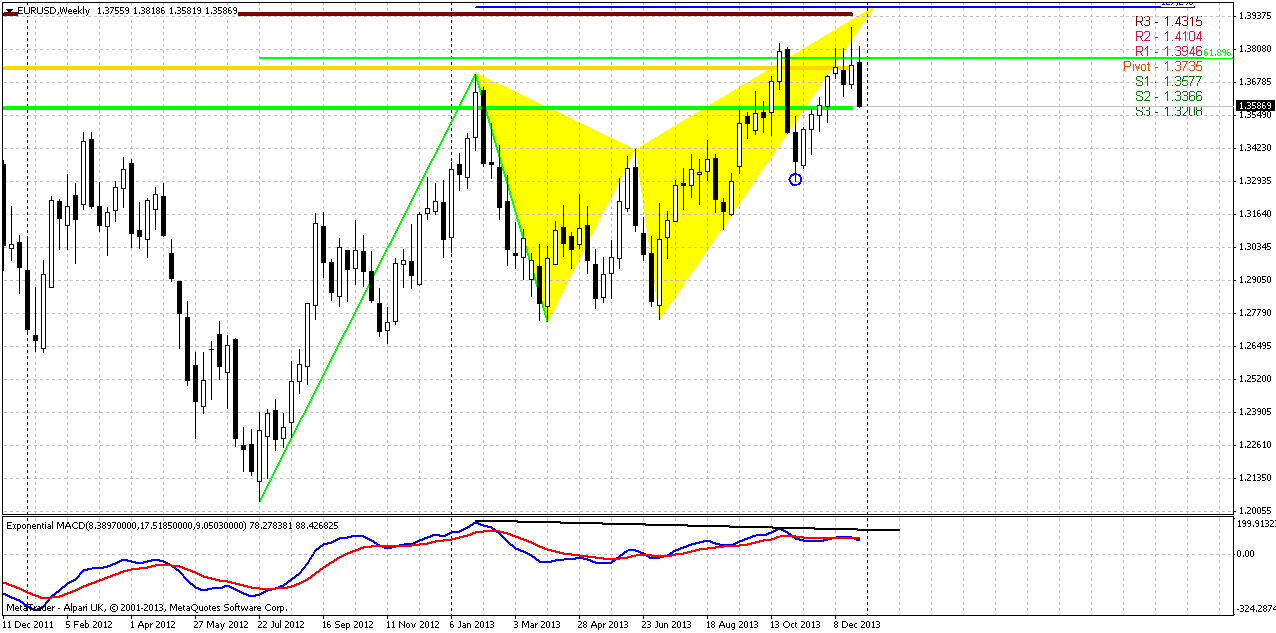
Weekly chart is a corner stone of EUR situation. First of all, take a look, that market has completed our short-term suggestion about previous highs clearing that was based on bullish dynamic pressure and stop grabber on previous week.
As EUR still holds around previous highs it’s very difficult to say “this is definitely reversal” or “this is definitely continuation”. Here we have to estimate clear conditions when we can treat price action as reversal and when it will be continuation. Signs and patterns that EUR shows us now have more bearish sentiment, rather than bullish. Here what we have – Butterfly “Sell” is forming right around major monthly resistance, price still can’t pass through it. Current AB-CD pattern has reached minor 0.618 target, but CD leg is much flatter than AB and this is the sign of weakness. On previous week trend has turned bearish and we’ve got bearish divergence here right at monthly resistance. As previous move down was solid and in fact, engulfs the action of previous 4-5 weeks, chances on reaching butterfly target become blur.
Our ideal criteria of reversal was to see butterfly completion and then – move below 1.33 lows. By looking at current action I’m not as sure with butterfly’s completion. Thus, we need at least move below 1.33 lows. In this case we will get reversal swing on weekly chart that could become at least something that could confirm downward ambitions.
Conversely, to speak about upward continuation, we need to get fulfilling of two conditions as well – market should coil around previous tops without significant retracement, and second – move above 1.3980 – butterfly 1.27 target. In this case next target will be right around 1.43-1.44 – weekly AB-CD, Yearly PR1 and butterfly 1.618. While market will stand inside of specified ranges – we can trade it based on lower time frame (daily and hourly) patterns and setups. Particularly speaking, daily chart should clarify whether we could count on reaching butterfly’s target on weekly or not.
Daily
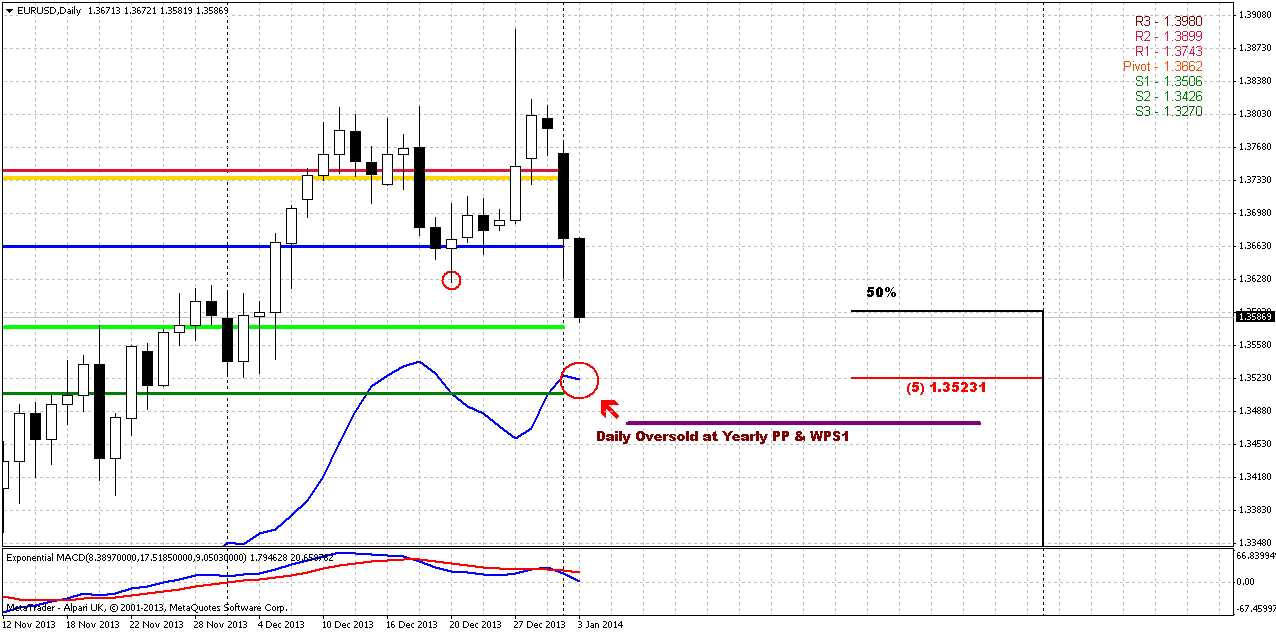
So, market has completed our short-term targets rather fast – as intraday AB-CD targets, as daily grabber and Stretch pattern have reached their minimum destinations. But now we have other beacons here. First is, I do not see any patterns that could hint on possible reaching of weekly butterfly’s target. Actually, I do not see any bullish setups here at all. Market has passed through daily K-support area without any respect. Recent action down is really fast – market opened at the top and closed at the bottom. Appearing of YPP slightly below current level also will attract price action.
That’s why I suspect that market could show some upward retracement since it stands at support – favorite 50% level and MPS1. But after retracement some continuation to WPS1, daily Overbought and YPP is possible – 1.3475-1.35 area. Trend here is bearish as well.
4-hour
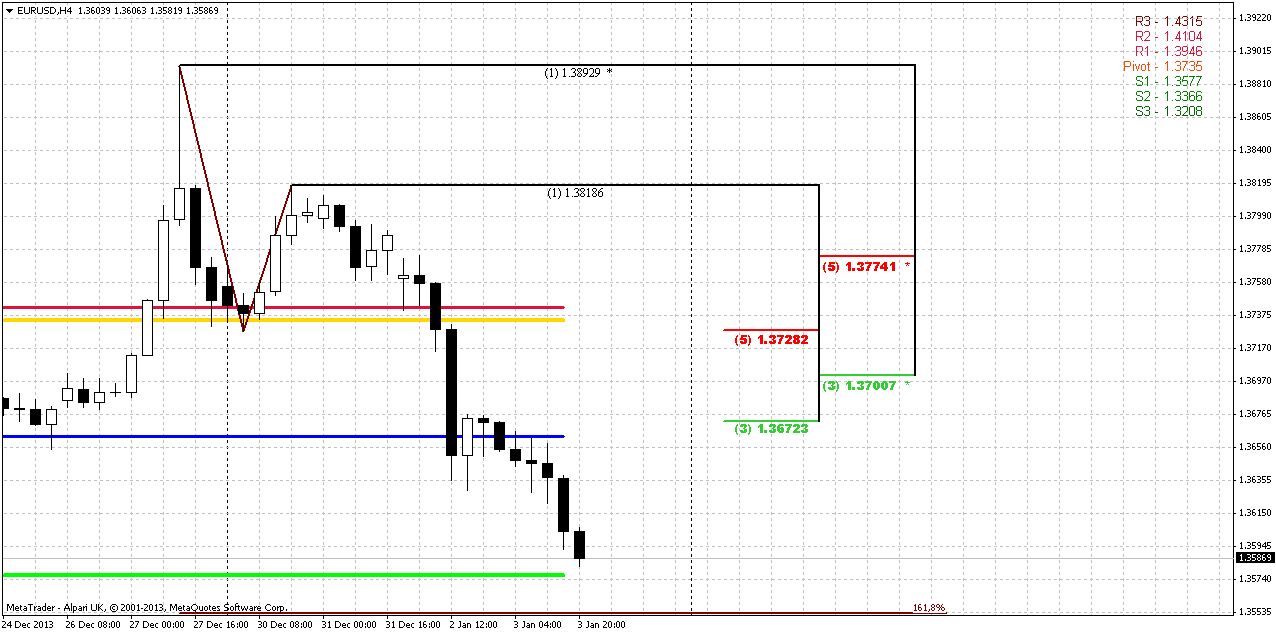
Here we see that although market stands at support on daily, it has not quite hit 1.618 extension of AB=CD pattern. Thus, it is difficult to tell how precisely retracement up will start – either market will open lower, right at 1.618 at turn north, or it will move down a bit first, or some other way. But, anyway there are two levels where retracement could finish. First one is WPP and 1.3672 Fib level ad second – K-resistance 1.37-1.3730 and combination of MPP and WPR1. Besides 1.3730 is approximately 50% major resistance. Thus, if price will hit 1.618 target first and start retracement second – bounce probably will be deeper, while if retracement will start before reaching of 1.618 target, in this case market could stop pullback around WPP.
Conclusion:
Despite all positive USD data of previous week, action on EUR does not suggest yet total and final reversal. Price still coiling around edge point and currently chances exist as for upward breakout as for downward reversal, although in recent time downward direction has become dominate. To rely on direction whatever it will be, we need to get clear patterns that could confirm it and point extended targets for us.
Until this will not happen, we probably will have to deal with scalp fast trades on daily chart and lower ones. Thus, approximately we can assume that move above current highs will suggest upward continuation, while breakout below 1.33 will be first sign of possible downward reversal on long-term charts.
In shorter-term perspective market shows solid move down that probably will continue. Appearing of Yearly PP around 1.3475 makes it’s reaching very probable. Thus, in the beginning of the week some retracement could happen (to 1.3670 or 1.3730 area) but then downward action probably will continue.
The technical portion of Sive's analysis owes a great deal to Joe DiNapoli's methods, and uses a number of Joe's proprietary indicators. Please note that Sive's analysis is his own view of the market and is not endorsed by Joe DiNapoli or any related companies.

")
