Sive Morten
Special Consultant to the FPA
- Messages
- 18,695
Monthly
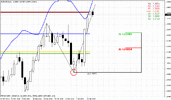
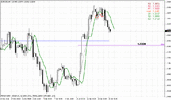
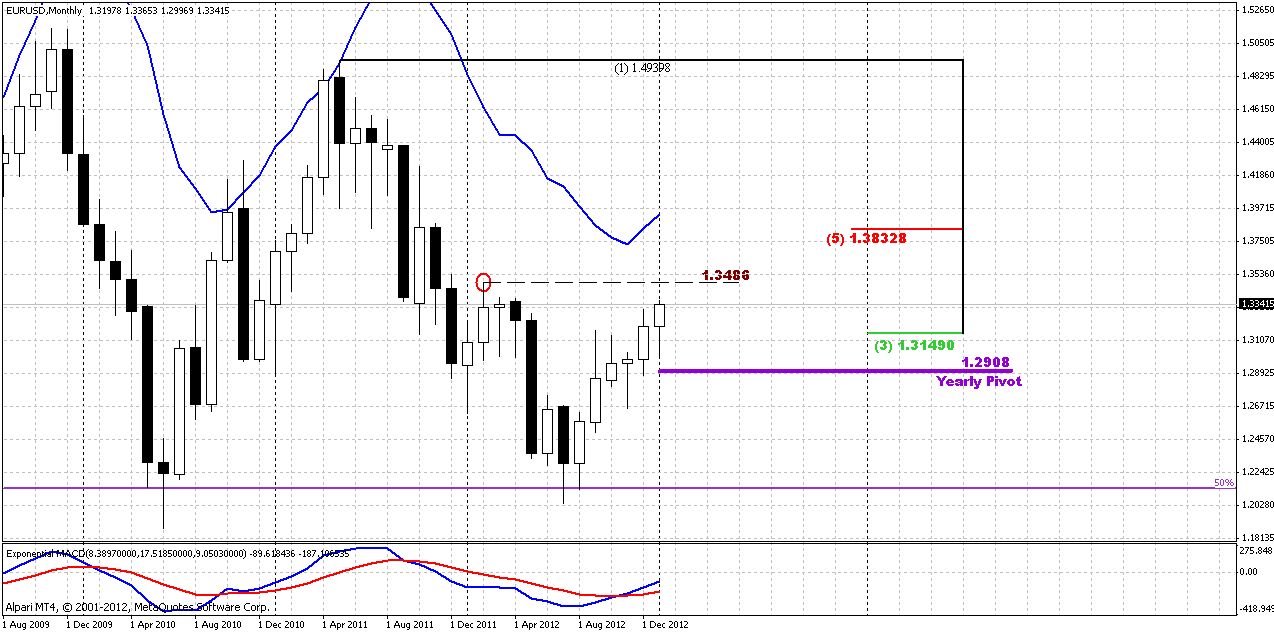
Now we probably can say that market has passed through Confluence resistance. It stands 200 pips above it. Trend holds bullish here, as well as price action, and there are two important moments. First one is related to current move up. Actually, market has no barriers ahead – next resistance level is 1.3834 and monthly overbought. Still, take a look at 1.3486. This level is significant by two reasons. It coincides with 50% resistance and second - this level is a kind of quality test for current upward move, since this is a high of most recent swing down. We know that when market forms swing up that is greater than previous swing down – this might be an indication of reversal. Particularly by that mean – 1.3486 is significant. That is what about current swing up...
Now is about longer and larger view. Pay attention to 1.2130 area – here we have all time 50% support level and it has been tested already once in 2010. In 2012 we have seen second test. When market hits support level multiple times sooner or later it will behave as a thrown ball on the ground – every next jump up will be smaller than previous one. The same relates to market’s bouncing from support. We have no signs currently – how strong current bounce will be. Sometimes second bounce has the same distance as the first and market breaks level on third touch, but sometimes second bounce will be smaller since support has become weaker. What does it mean in long-term perspective? Very simple – market is challenging all time 50% support. Now it’s bouncing for the second time, but it will probably return right back. Third bounce could happen as well, but it will be much smaller and after that breakout should follow. It means that although current move up looks pretty bullish – very probable it’s just a bounce in a longer picture, at least until it holds inside of previous swing up.
Weekly
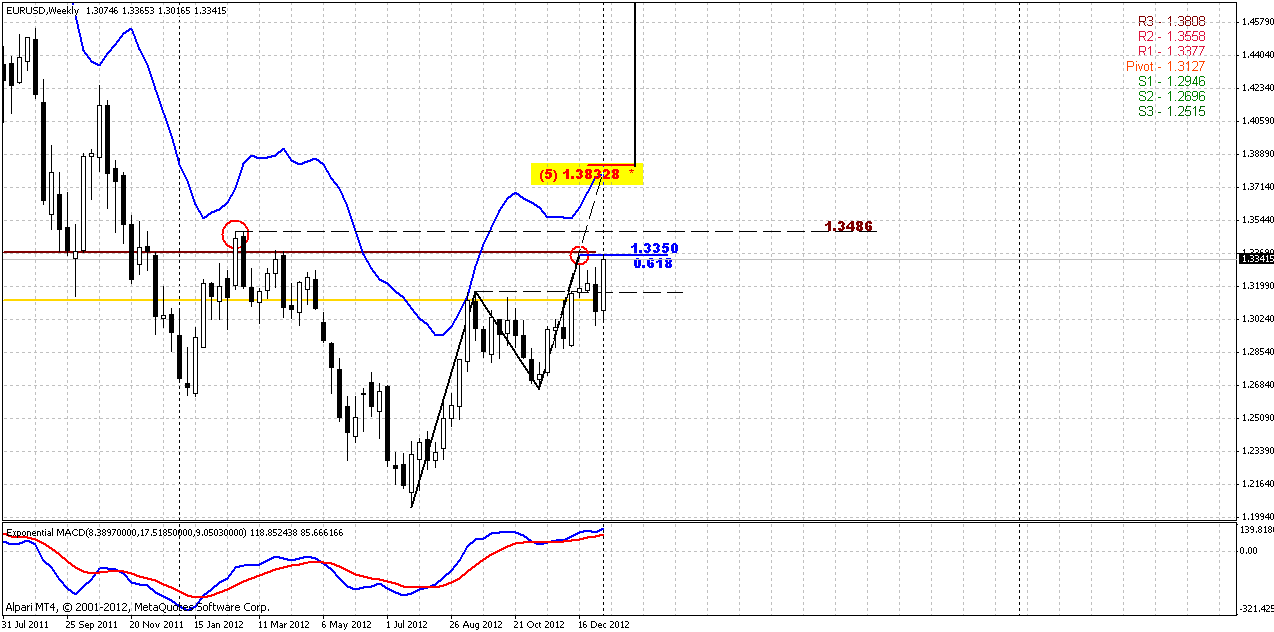
On couple of previous week price action was really cunning. When we saw that market has not reached 1.3350 area and minimum extension target of AB-CD pattern – we knew that it should happen. But usually market continues to the target immediately while here we had rather deep dive down inside of consolidation and testing of MPP that put confusion on us.
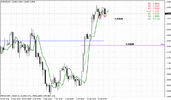
Now I do not see anything special here. Price has reached 0.618 target of AB-CD, trend holds bullish. There are no bearish signs here – any divergences, DiNapoli directional patterns… nothing. All that I can say here is that we have trending action, I mean all that we have now is just a trend that is confirmed by price action. Trend is bullish, previous week was rather bullish as well, market has tested MPP and now holds above it, i.e. sentiment is bullish as well here.
Next resistance area is 1.3486, but it will catch AB=CD development between 0.618 and 1.0 targets. I do not know, how market will deal with it. Ultimately, we have strong resistance around major 5/8 Fib level that as we can see now – is weekly Agreement and overbought as well.
Daily
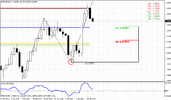
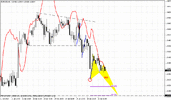
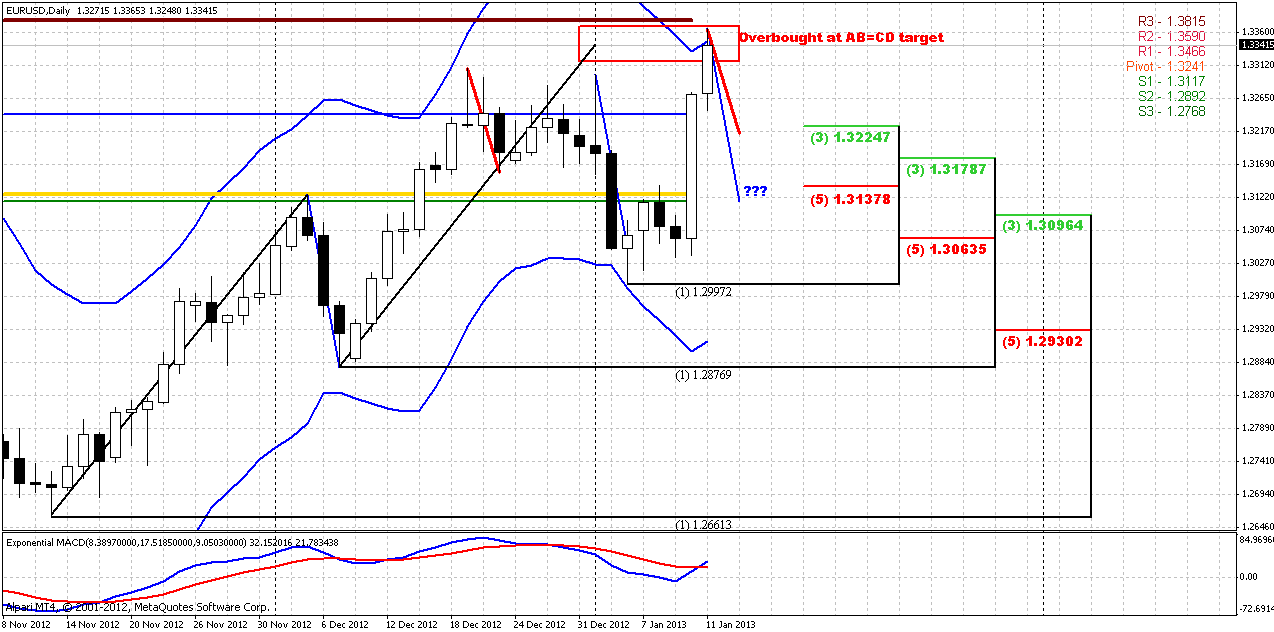
Sorry, guys for a bit overloaded chart, I just want to safe space. Daily setup is rather sophisticated, mostly due most recent AB-CD pattern that we will discuss on 4-hour time frame. One definite conclusion could be made here – context is bullish, trend is bullish but it’s not the time to jump in. Market stands at weekly AB-CD target, daily AB=CD completion point and daily overbought. Hence we need some deep to buy. Since market just has hit this level it had no time to start retracement and we do not have any orienting points currently to judge about its possible depth. Usually EUR is good trending market that makes rather small retracements once it stands in long-term solid trend. However, we know that market at overbought that could suggest a bit deeper retracement. Looks like there are two major levels to watch for. If it will be small retracement, probably we will see testing of WPP at 1.3241 and nearest Fib support at 1.3225. Take a look at red harmonic line – it points on this level as well.
If retracement still will be deeper due overbought condition – then our attention to confluence support at 1.3140. That is also WPS1, MPP and take a look – another harmonic swing. Still, as I said, here is some moment that makes overall situation not as simple as we would like to see it. That is another AB-CD on 4-hour time frame chart…
4-hour
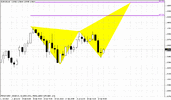
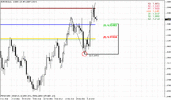
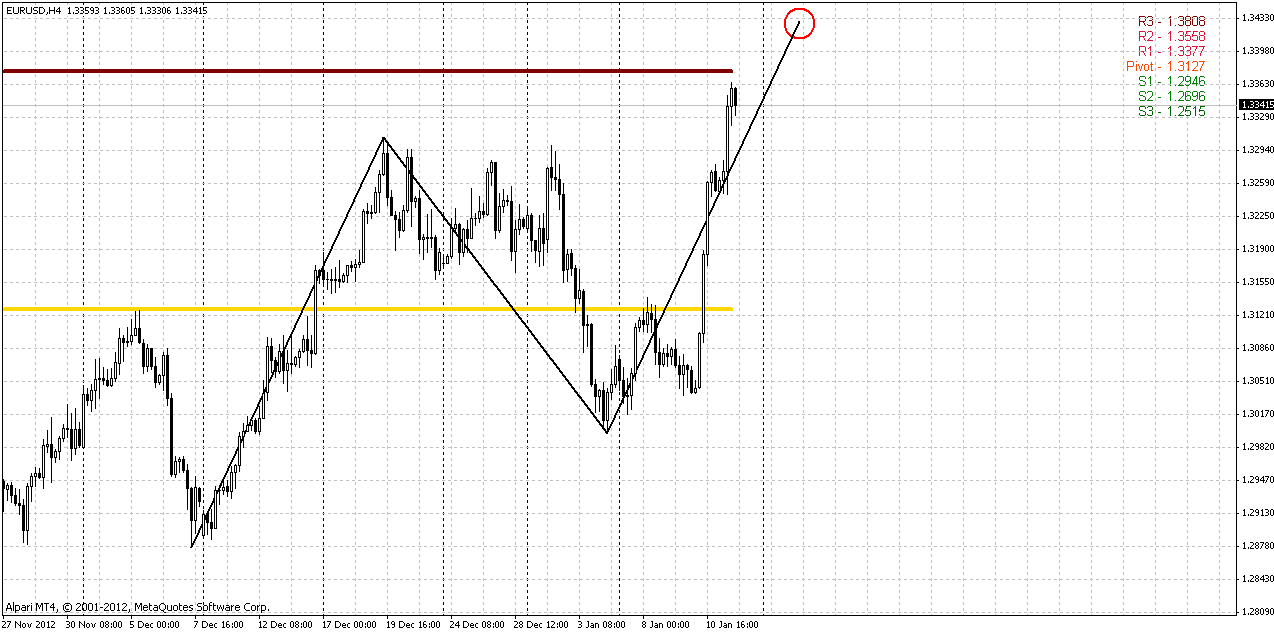
The major difficulty with it is it’s target. It stands around 1.3430 that is beyond as daily overbought as MPR1. So, the major question is – whether market will turn down right now immediately or, it will hit AB=CD target first and only after that will show retracement? Tell me if you’ll know. But one this should be kept in mind – if market on Monday will show continuation up – don’t be hasty to jump in, since it could reach just 1.3433 and start move down.
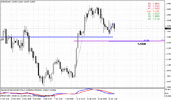
On houlry chart I do not see anything important currently.
Conclusion:
Upward bias holds well on all time frames. Still technically market feels the downward pressure from different Extension targets and overbought condition. That’s why it makes sense to wait a pullback to enter long, although currently there is no possibility to estimate as whether pullback has started or not as its potential depth. All that we can do now is to make some assumptions as we did in daily analysis.
In long term perspective now it looks like price has chances to reach 1.3830 level.
The technical portion of Sive's analysis owes a great deal to Joe DiNapoli's methods, and uses a number of Joe's proprietary indicators. Please note that Sive's analysis is his own view of the market and is not endorsed by Joe DiNapoli or any related companies.
Now we probably can say that market has passed through Confluence resistance. It stands 200 pips above it. Trend holds bullish here, as well as price action, and there are two important moments. First one is related to current move up. Actually, market has no barriers ahead – next resistance level is 1.3834 and monthly overbought. Still, take a look at 1.3486. This level is significant by two reasons. It coincides with 50% resistance and second - this level is a kind of quality test for current upward move, since this is a high of most recent swing down. We know that when market forms swing up that is greater than previous swing down – this might be an indication of reversal. Particularly by that mean – 1.3486 is significant. That is what about current swing up...
Now is about longer and larger view. Pay attention to 1.2130 area – here we have all time 50% support level and it has been tested already once in 2010. In 2012 we have seen second test. When market hits support level multiple times sooner or later it will behave as a thrown ball on the ground – every next jump up will be smaller than previous one. The same relates to market’s bouncing from support. We have no signs currently – how strong current bounce will be. Sometimes second bounce has the same distance as the first and market breaks level on third touch, but sometimes second bounce will be smaller since support has become weaker. What does it mean in long-term perspective? Very simple – market is challenging all time 50% support. Now it’s bouncing for the second time, but it will probably return right back. Third bounce could happen as well, but it will be much smaller and after that breakout should follow. It means that although current move up looks pretty bullish – very probable it’s just a bounce in a longer picture, at least until it holds inside of previous swing up.

Weekly
On couple of previous week price action was really cunning. When we saw that market has not reached 1.3350 area and minimum extension target of AB-CD pattern – we knew that it should happen. But usually market continues to the target immediately while here we had rather deep dive down inside of consolidation and testing of MPP that put confusion on us.
Now I do not see anything special here. Price has reached 0.618 target of AB-CD, trend holds bullish. There are no bearish signs here – any divergences, DiNapoli directional patterns… nothing. All that I can say here is that we have trending action, I mean all that we have now is just a trend that is confirmed by price action. Trend is bullish, previous week was rather bullish as well, market has tested MPP and now holds above it, i.e. sentiment is bullish as well here.
Next resistance area is 1.3486, but it will catch AB=CD development between 0.618 and 1.0 targets. I do not know, how market will deal with it. Ultimately, we have strong resistance around major 5/8 Fib level that as we can see now – is weekly Agreement and overbought as well.

Daily
Sorry, guys for a bit overloaded chart, I just want to safe space. Daily setup is rather sophisticated, mostly due most recent AB-CD pattern that we will discuss on 4-hour time frame. One definite conclusion could be made here – context is bullish, trend is bullish but it’s not the time to jump in. Market stands at weekly AB-CD target, daily AB=CD completion point and daily overbought. Hence we need some deep to buy. Since market just has hit this level it had no time to start retracement and we do not have any orienting points currently to judge about its possible depth. Usually EUR is good trending market that makes rather small retracements once it stands in long-term solid trend. However, we know that market at overbought that could suggest a bit deeper retracement. Looks like there are two major levels to watch for. If it will be small retracement, probably we will see testing of WPP at 1.3241 and nearest Fib support at 1.3225. Take a look at red harmonic line – it points on this level as well.
If retracement still will be deeper due overbought condition – then our attention to confluence support at 1.3140. That is also WPS1, MPP and take a look – another harmonic swing. Still, as I said, here is some moment that makes overall situation not as simple as we would like to see it. That is another AB-CD on 4-hour time frame chart…

4-hour
The major difficulty with it is it’s target. It stands around 1.3430 that is beyond as daily overbought as MPR1. So, the major question is – whether market will turn down right now immediately or, it will hit AB=CD target first and only after that will show retracement? Tell me if you’ll know. But one this should be kept in mind – if market on Monday will show continuation up – don’t be hasty to jump in, since it could reach just 1.3433 and start move down.
On houlry chart I do not see anything important currently.

Conclusion:
Upward bias holds well on all time frames. Still technically market feels the downward pressure from different Extension targets and overbought condition. That’s why it makes sense to wait a pullback to enter long, although currently there is no possibility to estimate as whether pullback has started or not as its potential depth. All that we can do now is to make some assumptions as we did in daily analysis.
In long term perspective now it looks like price has chances to reach 1.3830 level.
The technical portion of Sive's analysis owes a great deal to Joe DiNapoli's methods, and uses a number of Joe's proprietary indicators. Please note that Sive's analysis is his own view of the market and is not endorsed by Joe DiNapoli or any related companies.
