Sive Morten
Special Consultant to the FPA
- Messages
- 18,781
Monthly
Emerging market currencies were battered on Friday as global investors scrambled for shelter from a broad financial markets sell-off by buying dollars, yen and Swiss francs. The Japanese yen surged to a seven-week high against the dollar, while the Swiss franc touched a four-week peak against the euro as U.S. stocks tumbled and safe-haven Treasuries gained.
"The adjustment process is showing through in emerging market FX rates, particular those of Turkey and Argentina," said currency strategist Mark McCormick at Credit Agricole in New York. "The G10 currencies, especially the yen, are benefiting." Global investors remain firmly risk-averse; the sell-off in emerging markets this week, triggered in part by the steep decline in the Argentinian peso, has fuelled renewed concerns about the eventual withdrawal of liquidity as the Federal Reserve tapers its quantitative easing program," said Samarjit Shankar, director of market strategy at BNY Mellon in Boston.
The dollar fell to a seven-week low of 101.98 yen and was last at 102.24, down nearly 1 percent, while the euro slid to 1.2222 francs, it’s weakest since Dec. 18. The euro last traded at 1.2235 francs, 0.4 percent lower.
The euro was down 0.1 percent versus the dollar at $1.3679 , having jumped 1.1 percent on Thursday, stalling ahead of resistance at $1.37. Both the dollar and euro fell as much as 1 percent against the yen , pressured as well by signs of a slowdown in China and broad expectations of a tightening of monetary conditions this year by some central banks.
Amid a jumbled start to the year for major currency markets, analysts believed money was set to drain out of emerging market economies. Supporting this view, investors have bid strongly for a flurry of large bond issues in the euro zone this month. That helps explain why, along with lackluster U.S. data on Thursday, the year's other big bet of a stronger dollar against the euro has yet to materialize. "European assets have become a sort of safe haven for investors," said Alvin Tan, currency strategist at Societe Generale in London. Data published on Thursday showed the euro zone current account surplus hit a record high in November. More broadly, the banking and debt crisis that began in 2007 finally appears to be easing in Europe, and this year should see central banks begin to reel in some of the enormous volumes of cash they have pumped into the world economy.
In other currencies, the Australian dollar fell to US$0.8658, its lowest in 3-1/2 years after Reserve Bank of Australia board member Heather Ridout was reported as saying the currency had not fallen enough and that the currency at 80 U.S. cents would be a "fair deal" for the economy. Sterling has also done well in January, surging to its highest against the dollar in almost three years on Friday on speculation the Bank of England could raise interest rates before the end of the year. But it ended off 0.75 percent in New York at $1.6504.
B]Technical[/B]
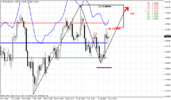
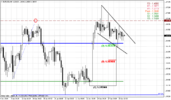
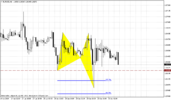
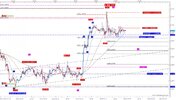
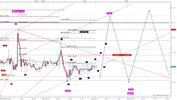
Although volatility inside the week was significant, on monthly time frame price has changed just for few pips. But recent price action confirms our suggestion that until market stands above 1.33 and coiling around current levels – nothing clear about possible direction. As upward breakout as downward reversal could happen.
On monthly time frame January candle is still an inside one for December and has not made any impact on overall situation yet. Although price has started some downward move recently it has not reached YPP=1.3475 We know that price always gravitates to pivot and Yearly pivot should play its role sooner or later.
If we will follow to market mechanics, we’ll see that currently market should not show any solid retracement down. Any move of this kind should be treated as market weakness and it will increase probability of reversal down. Take a look that as market has hit minor 0.618 AB-CD extension target right at rock hard resistance – Fib level and Agreement and former yearly PR1, it has shown reasonable bounce down and now it has tested it again. As retracement after 0.618 target already has happened, it is unlogical and unreasonable to see another deep bounce and it will look suspicious. Right now market still stands on the edge here. From one point of view price has failed to break up, but from another one – it still stands very close to previous highs. As we’ve seen on lower time frames – price has shown fast and drastical reversal. By following logic that we’ve mentioned above, this reversal has chances to become the starting point of upward continuation in big scale.

Weekly
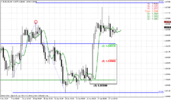
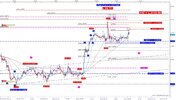
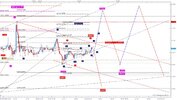
Here we have inside week as well. Trend is bearish. In general, our long-term analysis here still the same, since nothing has changed yet.
As EUR still holds around previous highs it’s very difficult to say “this is definitely reversal” or “this is definitely continuation”. Here we have to estimate clear conditions when we can treat price action as reversal and when it will be continuation
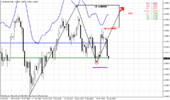
Here what we have – Butterfly “Sell” is forming right around major monthly resistance, price still can’t pass through it. Current AB-CD pattern has reached minor 0.618 target, but CD leg is much flatter than AB and this is the sign of weakness. On previous week trend has turned bearish and we’ve got bearish divergence here right at monthly resistance.
Our ideal criteria of reversal was to see butterfly completion and then – move below 1.33 lows. In this case we will get reversal swing on weekly chart that could become at least something that could confirm downward ambitions. Previously we’ve said that as we’ve got bearish engulfing then chances have become shyer on upward continuation to butterfly target. But right now some new information has appeared and that will be the core of our anaysis on coming week. At the first glance we see nothing special, but there are a lot of special if you know where to search. I hope that you remember market mechanics of engulfing pattern, since it stands as a basis here and you easily will understand what is particularly wrong with it right now.
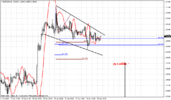
So, In red ellipse our engulfing pattern stands. Week #1 is normal retracement inside the body of the pattern. #2 week should become starting move as extension and reaction on engulfing pattern. And it was – price has closed below the low of engulfing pattern and has triggered it. But take a look what has happened on #3 day – market has returned right back up befor it has hit the target of engulfing. It can’t be due MPS1, since it was tested aleardy twice. This return on #3 stands in contradiction with normal action. Hence now it becomes probable that engulfing pattern will fail and market will start motion to the top. Top now coincides with MPR1 and 1.27 target of big butterfly. Interesting, right? From the Pivot point framework action alsol looks logical – market has tested MPS1 and it has held retracement down. And we now that any retracement on upward trend should be held by MPS1. It means that upward trend is sitll valid. And, as market has held at MPS1 – next logical destination is MPR1. The one problem here is time – too few time has left till the end of the month. Anyway having such situation on our back, I think we should not be hurry with short entering. Even more, currently I do not want to take short position.
Final moment is trend by MACD, it stands bearish, but price action stands flat. This could be bullish dynamic pressure that suggests taking out of previous highs at minimum.
Conversely, to speak about upward continuation o big scale, we need to get fulfilling of two conditions as well – market should coil around previous tops without significant retracement, and second – move above 1.3980 – butterfly 1.27 target. In this case next target will be right around 1.43-1.44 – weekly AB-CD, Yearly PR1 and butterfly 1.618. While market will stand inside of specified ranges – we can trade it based on lower time frame (daily and hourly) patterns and setups.

Daily
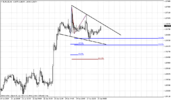
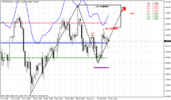
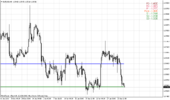
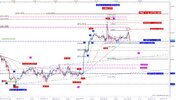
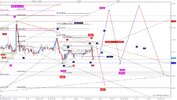
At the surface situation here is simple. As market has formed reversal swing up, i.e. recent upward action is greater than previous swing down, we can make two conclusions. First is – retracement down probably will be 50% at minimum of thrusting candle. Second – we can return to discussion of downward action only when & if price will take out current lows and move below them. Trend has shift bullish here.
As we have estimated invalidation conditions for short-term bullish action, now we can speak about possible targets. In very short-term, this will be probably WPR1 at 1.3775 and daily overbought. On larger scale – 0.618 extension of most recent AB=CD around 1.3870. Thus, short-term trading plan is to wait for deep retracement (50% at minimum) on intraday charts and try to take bullish position with target around 1.3775. Now let’s take a look, could we estimate possible depth of retracement with more precision on lower time frames…

4-hour
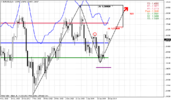
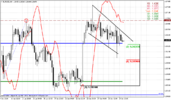
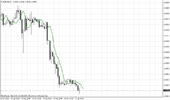
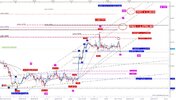
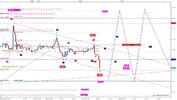
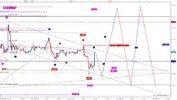
Here we need to watch for couple of moments. As we’ve got butterfly as reversal pattern here, I can’t exclude that we could get reverse 1.27 H&S pattern here. This pattern absolutely does not contradict with suggestion of deep retracement, but it assumes that retracement could be even to 1.3560 area – almost to WPS1. In this case pattern will look harmonic. At the same time we have solid support around WPP = 1.3640, that incudes pivot itself, Fib support and natural support area. So, let’s see how it will stand. May be price will form something on hourly chart during Monday that will help us better understand where retracement could finish. Currently I see nothing on hourly chart since move up just has finished.

Conclusion:
Despite all positive recent USD data action on EUR does not suggest yet total and final reversal. Price still coiling around edge point and currently chances exist as for upward breakout as for downward reversal, although in recent time downward direction has become dominate. To rely on direction whatever it will be, we need to get clear patterns that could confirm it and point extended targets for us. But we do not have them yet.
Until this will not happen, we probably will have to deal with scalp fast trades on daily chart and lower ones. Thus, approximately we can assume that move above current highs will suggest upward continuation, while breakout below 1.33 will be first sign of possible downward reversal on long-term charts.
Recent upward action stands in contradiction with market mechanic of weekly bearish engulfing pattern and could become starting point of move to weekly extended targets. But first we need to get confirmation of reversal on lower time frames – market should show upward continuation on 4-hour chart and may be to complete the shape of reverse H&S pattern. If market will do this, we will shift to next step of big weekly move. Invalidation point for current upward reversal is recent lows on daily chart. Only if market will move below them we could start to discuss bearish setups again.
The technical portion of Sive's analysis owes a great deal to Joe DiNapoli's methods, and uses a number of Joe's proprietary indicators. Please note that Sive's analysis is his own view of the market and is not endorsed by Joe DiNapoli or any related companies.
Emerging market currencies were battered on Friday as global investors scrambled for shelter from a broad financial markets sell-off by buying dollars, yen and Swiss francs. The Japanese yen surged to a seven-week high against the dollar, while the Swiss franc touched a four-week peak against the euro as U.S. stocks tumbled and safe-haven Treasuries gained.
"The adjustment process is showing through in emerging market FX rates, particular those of Turkey and Argentina," said currency strategist Mark McCormick at Credit Agricole in New York. "The G10 currencies, especially the yen, are benefiting." Global investors remain firmly risk-averse; the sell-off in emerging markets this week, triggered in part by the steep decline in the Argentinian peso, has fuelled renewed concerns about the eventual withdrawal of liquidity as the Federal Reserve tapers its quantitative easing program," said Samarjit Shankar, director of market strategy at BNY Mellon in Boston.
The dollar fell to a seven-week low of 101.98 yen and was last at 102.24, down nearly 1 percent, while the euro slid to 1.2222 francs, it’s weakest since Dec. 18. The euro last traded at 1.2235 francs, 0.4 percent lower.
The euro was down 0.1 percent versus the dollar at $1.3679 , having jumped 1.1 percent on Thursday, stalling ahead of resistance at $1.37. Both the dollar and euro fell as much as 1 percent against the yen , pressured as well by signs of a slowdown in China and broad expectations of a tightening of monetary conditions this year by some central banks.
Amid a jumbled start to the year for major currency markets, analysts believed money was set to drain out of emerging market economies. Supporting this view, investors have bid strongly for a flurry of large bond issues in the euro zone this month. That helps explain why, along with lackluster U.S. data on Thursday, the year's other big bet of a stronger dollar against the euro has yet to materialize. "European assets have become a sort of safe haven for investors," said Alvin Tan, currency strategist at Societe Generale in London. Data published on Thursday showed the euro zone current account surplus hit a record high in November. More broadly, the banking and debt crisis that began in 2007 finally appears to be easing in Europe, and this year should see central banks begin to reel in some of the enormous volumes of cash they have pumped into the world economy.
In other currencies, the Australian dollar fell to US$0.8658, its lowest in 3-1/2 years after Reserve Bank of Australia board member Heather Ridout was reported as saying the currency had not fallen enough and that the currency at 80 U.S. cents would be a "fair deal" for the economy. Sterling has also done well in January, surging to its highest against the dollar in almost three years on Friday on speculation the Bank of England could raise interest rates before the end of the year. But it ended off 0.75 percent in New York at $1.6504.
B]Technical[/B]
Although volatility inside the week was significant, on monthly time frame price has changed just for few pips. But recent price action confirms our suggestion that until market stands above 1.33 and coiling around current levels – nothing clear about possible direction. As upward breakout as downward reversal could happen.
On monthly time frame January candle is still an inside one for December and has not made any impact on overall situation yet. Although price has started some downward move recently it has not reached YPP=1.3475 We know that price always gravitates to pivot and Yearly pivot should play its role sooner or later.
If we will follow to market mechanics, we’ll see that currently market should not show any solid retracement down. Any move of this kind should be treated as market weakness and it will increase probability of reversal down. Take a look that as market has hit minor 0.618 AB-CD extension target right at rock hard resistance – Fib level and Agreement and former yearly PR1, it has shown reasonable bounce down and now it has tested it again. As retracement after 0.618 target already has happened, it is unlogical and unreasonable to see another deep bounce and it will look suspicious. Right now market still stands on the edge here. From one point of view price has failed to break up, but from another one – it still stands very close to previous highs. As we’ve seen on lower time frames – price has shown fast and drastical reversal. By following logic that we’ve mentioned above, this reversal has chances to become the starting point of upward continuation in big scale.

Weekly
Here we have inside week as well. Trend is bearish. In general, our long-term analysis here still the same, since nothing has changed yet.
As EUR still holds around previous highs it’s very difficult to say “this is definitely reversal” or “this is definitely continuation”. Here we have to estimate clear conditions when we can treat price action as reversal and when it will be continuation
Here what we have – Butterfly “Sell” is forming right around major monthly resistance, price still can’t pass through it. Current AB-CD pattern has reached minor 0.618 target, but CD leg is much flatter than AB and this is the sign of weakness. On previous week trend has turned bearish and we’ve got bearish divergence here right at monthly resistance.
Our ideal criteria of reversal was to see butterfly completion and then – move below 1.33 lows. In this case we will get reversal swing on weekly chart that could become at least something that could confirm downward ambitions. Previously we’ve said that as we’ve got bearish engulfing then chances have become shyer on upward continuation to butterfly target. But right now some new information has appeared and that will be the core of our anaysis on coming week. At the first glance we see nothing special, but there are a lot of special if you know where to search. I hope that you remember market mechanics of engulfing pattern, since it stands as a basis here and you easily will understand what is particularly wrong with it right now.
So, In red ellipse our engulfing pattern stands. Week #1 is normal retracement inside the body of the pattern. #2 week should become starting move as extension and reaction on engulfing pattern. And it was – price has closed below the low of engulfing pattern and has triggered it. But take a look what has happened on #3 day – market has returned right back up befor it has hit the target of engulfing. It can’t be due MPS1, since it was tested aleardy twice. This return on #3 stands in contradiction with normal action. Hence now it becomes probable that engulfing pattern will fail and market will start motion to the top. Top now coincides with MPR1 and 1.27 target of big butterfly. Interesting, right? From the Pivot point framework action alsol looks logical – market has tested MPS1 and it has held retracement down. And we now that any retracement on upward trend should be held by MPS1. It means that upward trend is sitll valid. And, as market has held at MPS1 – next logical destination is MPR1. The one problem here is time – too few time has left till the end of the month. Anyway having such situation on our back, I think we should not be hurry with short entering. Even more, currently I do not want to take short position.
Final moment is trend by MACD, it stands bearish, but price action stands flat. This could be bullish dynamic pressure that suggests taking out of previous highs at minimum.
Conversely, to speak about upward continuation o big scale, we need to get fulfilling of two conditions as well – market should coil around previous tops without significant retracement, and second – move above 1.3980 – butterfly 1.27 target. In this case next target will be right around 1.43-1.44 – weekly AB-CD, Yearly PR1 and butterfly 1.618. While market will stand inside of specified ranges – we can trade it based on lower time frame (daily and hourly) patterns and setups.

Daily
At the surface situation here is simple. As market has formed reversal swing up, i.e. recent upward action is greater than previous swing down, we can make two conclusions. First is – retracement down probably will be 50% at minimum of thrusting candle. Second – we can return to discussion of downward action only when & if price will take out current lows and move below them. Trend has shift bullish here.
As we have estimated invalidation conditions for short-term bullish action, now we can speak about possible targets. In very short-term, this will be probably WPR1 at 1.3775 and daily overbought. On larger scale – 0.618 extension of most recent AB=CD around 1.3870. Thus, short-term trading plan is to wait for deep retracement (50% at minimum) on intraday charts and try to take bullish position with target around 1.3775. Now let’s take a look, could we estimate possible depth of retracement with more precision on lower time frames…

4-hour
Here we need to watch for couple of moments. As we’ve got butterfly as reversal pattern here, I can’t exclude that we could get reverse 1.27 H&S pattern here. This pattern absolutely does not contradict with suggestion of deep retracement, but it assumes that retracement could be even to 1.3560 area – almost to WPS1. In this case pattern will look harmonic. At the same time we have solid support around WPP = 1.3640, that incudes pivot itself, Fib support and natural support area. So, let’s see how it will stand. May be price will form something on hourly chart during Monday that will help us better understand where retracement could finish. Currently I see nothing on hourly chart since move up just has finished.

Conclusion:
Despite all positive recent USD data action on EUR does not suggest yet total and final reversal. Price still coiling around edge point and currently chances exist as for upward breakout as for downward reversal, although in recent time downward direction has become dominate. To rely on direction whatever it will be, we need to get clear patterns that could confirm it and point extended targets for us. But we do not have them yet.
Until this will not happen, we probably will have to deal with scalp fast trades on daily chart and lower ones. Thus, approximately we can assume that move above current highs will suggest upward continuation, while breakout below 1.33 will be first sign of possible downward reversal on long-term charts.
Recent upward action stands in contradiction with market mechanic of weekly bearish engulfing pattern and could become starting point of move to weekly extended targets. But first we need to get confirmation of reversal on lower time frames – market should show upward continuation on 4-hour chart and may be to complete the shape of reverse H&S pattern. If market will do this, we will shift to next step of big weekly move. Invalidation point for current upward reversal is recent lows on daily chart. Only if market will move below them we could start to discuss bearish setups again.
The technical portion of Sive's analysis owes a great deal to Joe DiNapoli's methods, and uses a number of Joe's proprietary indicators. Please note that Sive's analysis is his own view of the market and is not endorsed by Joe DiNapoli or any related companies.
