FOREX PRO WEEKLY January 27-31, 2014

07.35

Good morning!

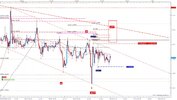
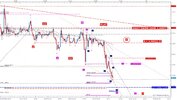
I stil expect move up but can not exclude downside leg as long channel line holds PA and 1,36872 is in place. To upside I like 1,3703 and 1,3720/30 mostly, higher is possible but less probable, to downside I like 1,3620 zone.

Good trading!
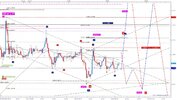
20140129_eurusd_M30_0740.jpg


09.50
Yes, the day of Great expectations!
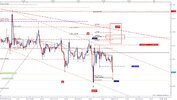
As said previously, I like the most Flat pattern developing and here is the catch: 2nd of flat must hit 50% of 1st and this is 1,36833, to upside is the limit farfar above, so this level is very important especially because it is hidden just below blue a high and move down could be treated as retrace...take care!
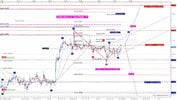
20140129_eurusd_M30_0955.jpg


12.00
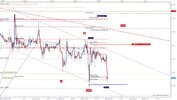
I turned my untilFOMC bias again to the downside BUT on H2 we are inside the candle so break is possible to both sides; I think before FOMC the picture will be clearer....
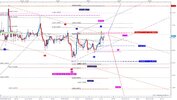
20140129_eurusd_M30_1205.jpg


14.05
I started thinking bullish again...maybe too early..we will see soon, I expect in this hour price action will tell
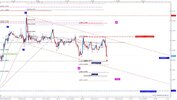
20140129_eurusd_M30_1405.jpg


14.30
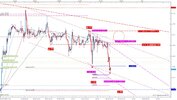
For my taste move down went a bit too low, it is exactly on the edge for one of possible counts..pullback, shape and speed will determine whole story...down move could proceed directly but I do expect retrace
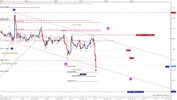
20140129_eurusd_M30_1430.jpg
 
Last edited:
This is one of the few times that I really need Sive's analysis to confirm my view on possible direction of EUR/USD due to today's FOMC report;)....really waiting with great anticipation and anxiety cause I have already committed my positions, not only on EUR/USD, but also on USD/JPY!:p
 
Good morning!

Mountain shook and again a mouse was born, hehe...somehow I miss the times of Trichet and BBs speaches...

Good trading!


08.04
I think decision about the direction will be shown soon, maybe even today.

20140130_eurusd_M30_0804.jpg


08.55
This might be it! To upside I like the most 1,3690 but sky is the limit...

20140130_eurusd_M30_0857.jpg


09.17
For my count low @1,3602 should remain in tact, but also could be W&R what I do not expect really, to upside now I like possible Butterfly sell just below HH or maybe just a bit shorter D few pips above 1,3700, but there is 20 very near again....
ps:Butterfly D could be Butterfly C to down side..

20140130_eurusd_M30_0917.jpg


11.35
I was wrong....but not totaly surprised, what would be if price strongly drops...I expect very soon pullback above 1,3602, but really above 1,36521; there,between 1,36521 and 1,36837 is to me most important zone because if 1,36837 falls then we could go toward HH; to the downside 1,3556 should hold, touching pink channel would invalidate ED but 2nd of flat and even 3rd would remain in play; if this, from 1,36837 is ED then pullback could be very short, just above 1,3602 and 5th could be very long..
Whole construction is very complicated but move seems to me too anemic for an impulse, at leat so far, but eurusd is able to creep slowly and far. We will see..I remain bullish for retrace and think down move could continue, at least one more wave.
Good luck!

20140130_eurusd_M30_1147.jpg


16.36
I think we are slowly nesting low, after 17.00 CET price can go into last wave which is limited with 1,3538. What kind of pattern we will get on the way up will tell if we go once more down or we go directly above 1,36521, my favourite zone.

ps: well, once again....

20140130_eurusd_M30_1641.jpg
 
Last edited:
Good morning!

Mountain shook and again a mouse was born, hehe...somehow I miss the times of Trichet and BBs speaches...

Good trading!


08.04
I think decision about the direction will be shown soon, maybe even today.

View attachment 13183

Looking for 3560 area before some more action will happen. Bulls needs to go lower to get some momentum
 
Looking for 3560 area before some more action will happen. Bulls needs to go lower to get some momentum

I am not talking about next or last low...in very near future I expect high swing before lower and this wave (shape & height) might tell the direction....now I am waiting for 20.........

Good luck!
 
I am not talking about next or last low...in very near future I expect high swing before lower and this wave (shape & height) might tell the direction....now I am waiting for 20.........

Good luck!

Sorry, I'm not a EW guy so I don't understand this kind of waves count, I just wrote what I think :)

If we take out yesterdays low and then 3694/95 before 356x how does it fit into your EW count? Because that is the path I'm in atm, Acually I like the 3584 as a bounce to the 3694/95

3584 is the 1/4 mark in the bullish sequence to the 3816 target, the current high at 373x is the 3/4 mark in same sequence. It is normal to go back to their mirrors before higher
 
Last edited:
Sorry, I'm not a EW guy so I don't understand this kind of waves count, I just wrote what I think :)

If we take out yesterdays low and then 3694/95 before 356x how does it fit into your EW count? Because that is the path I'm in atm, Acually I like the 3584 as a bounce to the 3694/95

3584 is the 1/4 mark in the bullish sequence to the 3816 target, the current high at 373x is the 3/4 mark in same sequence. It is normal to go back to their mirrors before higher


It fits..but this would be very bearish, I would consider as 5 waves C leg and goes very deep or eventualy as flat X wave, could also go deep down to 162 extension...BUT I expect daily high swing first to go lower and this is above 1,3686 and on Monday soonest we might be below 1,3602..we will see..
 
Good morning and good trading!


08.20
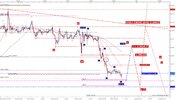
So, we made 200 pips in this move down,so far. To me this is stil corective type of move but my overall picture is more bearish than bullish and I think we are on the way toward 1,3170 in shape of ending diagonal so we have 370 pips to go, if I am right. Sooner or later we will get daily swing high....
As seen in my count, I had to decide for one, we might be bottoming 2nd wave of flat correction in X wave of double Zigzag with target above 1,3628. Here is one catch, level 1,35636, above it bottom is most likely in place or we will get another low and W could change into 1st of probable longlong C wave. We could spend whole day in this zone, making low after low, and dark blue a&b could become 1&2 what would not change whole story.
Pink line @1,3525 is 62 expansion from very HH @1,38924 to Daily A @1,35649 from 20140109 and Daily B @1,37383 from 20130124 and could be reason for Daily low swing. This would be very tricky.
Invalidation of my count is with price above 1,37383.

ps: Daily high swing level today is @1,36837, not correct in the picture!

ps2: daily high swing level coincides with b top so we might get also, lets say double top of b and x wave...


20140131_eurusd_M30_0829.jpg


11.40
Huh, worming like real worm!
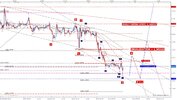
Adjusted the count, remain retrace bullish, only how high: below 1,35636, a bit higher and fast down again or what?

20140131_eurusd_M30_1143.jpg


12.39
I regret but before this spike up I wrote my analysis and something crashed and it was not published..
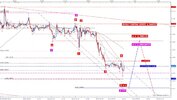
Was too fast with my previous post, have not checked all TFs. Here is new picture. It is already happening what I ment to tell..

20140131_eurusd_M30_1236.jpg
 
Last edited:
Back
Top