Sive Morten
Special Consultant to the FPA
- Messages
- 18,748
Monthly
Just we were happy with downward breakout of the flag two weeks ago, but our happiness was not very long as market has stopped move down due FOMC meeting protocol, that contains voting and major points of discussion and shows that many OMC members do not support fast and aggressive QE closing. Actually this information is not new and right after FOMC meeting, when markets have shown furius reaction Bernanker was hurry to put on back-pedal and chill out markets a bit. But one thing is Bernanke post-comments and quite another one – official FOMC meeting protocol. In long term perspective markets will probably try to understand whether this bounce is something long-play issue or just short-term reaction.
Previously we said that on monthy time frames nearest tendency will be determined by flag breakout direction. Depending on breakout direction – further action will follow.Two weeks ago we’ve got significant bearish pattern – bullish trap or fake upward flag breakout. By classical school of technical analysis this should lead to oposite real breakout, i.e. downside. But now we see the same oposite picture. Also market is stuck in yearly pivot point and 50% support area again. Still there is significant difference still exists. Why bullish trap has been confirmed already, current fake breakout is not confirmed yet, since July candle is still in progress. It could happened that by the close of the month, the downward breakout will be real. As we can see, monthly chart can’t help us much by far in our short-term trading.
In long-term perspective, now we can start to watch over bearish dynamic pressure here, on monthly chart. Now it can be signed much easier than before. Take a look that although trend holds bullish, price action mostly develops oppositely.
Targets to the downside remain the same – minimum target stands the same area around Yearly Pivot support 1 and preavious lows 1.2150-1.23. Potentially this probably will trigger downward action by huge AB=CD pattern that has minor 0.618 target and will challenge 1.1875 lows around all time major 50% support. Dynamic pressure itself suggests taking out of previous lows around 1.2050.
But on coming week our major focus will be on weekly and daily time frames.

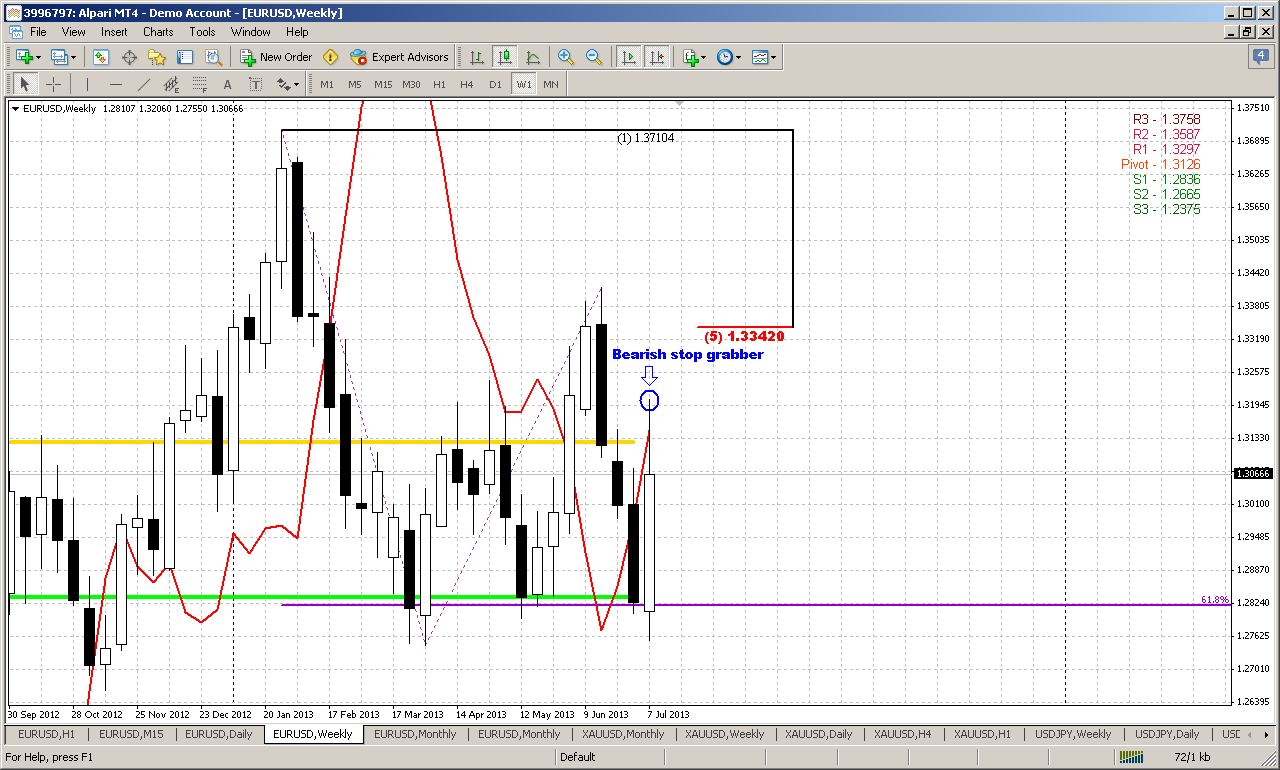
Weekly
Here is guys the foundation for whole our work on coming week. This is bearish stop grabber pattern, and I have big hopes with it. If you will take a careful look at this chart, then you’ll see that despite how drastical this bounce was – it has not shown anything outstanding for bearish trend here. What in really it has happened – market has hit significant support of neckline, MPS1 and what is most important – 0.618 target of H&S AB=CD pattern. And we know that even after 0.618 target some retracement could follow, but this retracement should not be too deep. And our retracement is not deep at all – just 5/8 from small CD leg. MPP has been tested and market has returned right below it. That’s being said, right now I do not see the break of previous bearish setup, at least by far. So our working range for coming week is a range of stop grabber. Invalidation point at top and minimum target at bottom.
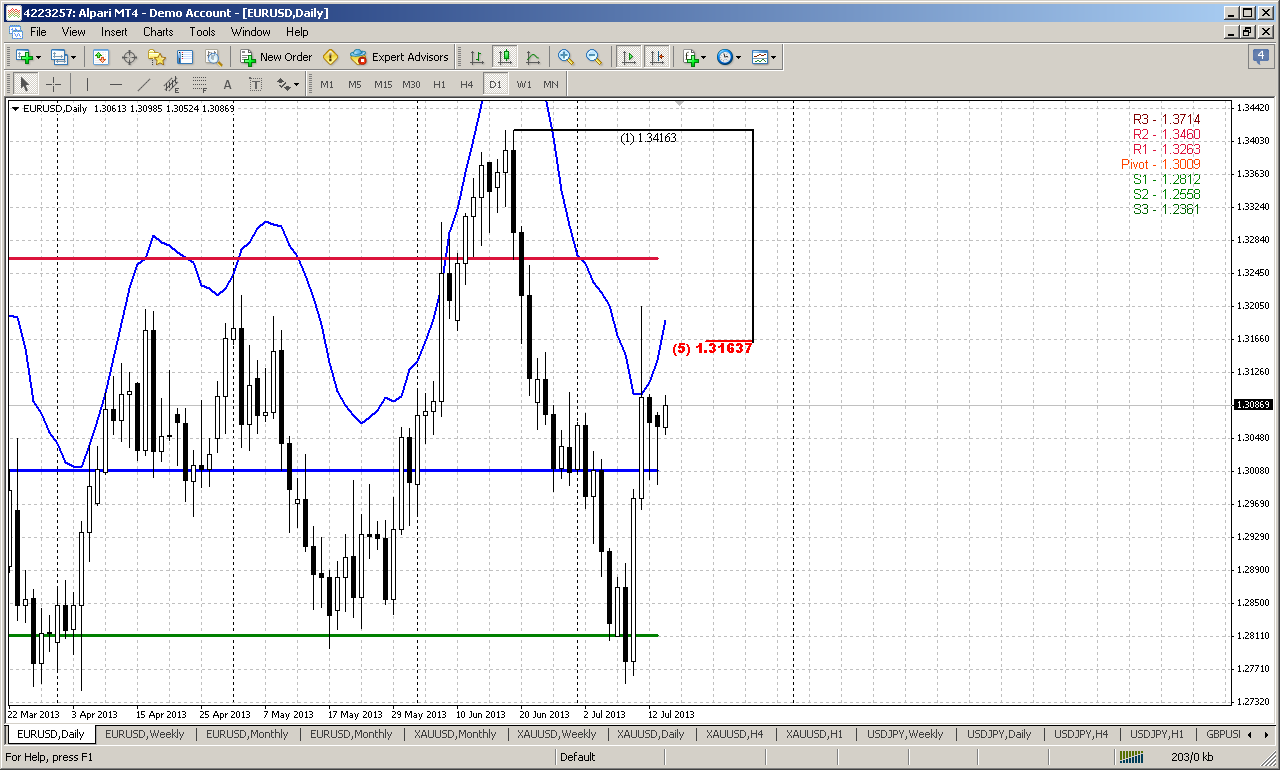
Daily
Here is few that we can add. Friday was an inside trading session and upward furious action we’ve discussed already many times. Currently our B&B setup interestingly coincides with bearish stop grabber on weekly chart and hardly this has happened just occasionally. Unfortunately, there are too small time has passed and we can’t understand yet – whether this upward splash was mostly emotional or not. If yes, than it should not last too long. Technically if you remember, we many times have said that market looks overextended to the downside. This is as pushed spring – when it releases, it happens fast. This is what we’ve seen on previous week. Now our major task is control overall action here. We need to get signs of starting downward move on Monday to get a confidence with as B&B as stop grabber.

4-hour
Here market stands in a bit tricky moment. At the first glance, B&B has started nice, but on Friday market has stopped a bit. And now it is not quite clear – whether we will get deeper move up, or this is just shallow retracement, because price has hit an agreement of AB-CD minor 0.618 target and 3/8 Fib support. Butterfly “Sell” is impossible here, since current low stands slightly lower than initial AB swing. But we have a hint on potential bullish dynamic pressure – trend has turned bearish, but price action has shown upward action. So, as market has hit just minor support level, we do not want to get too extended bounce, especially we do not want to see exceeding of previous high, since there is invalidation point of weekly stop grabber pattern. Thus, all that we can do here is protect shorts that we have with breakeven and if market will continue move up – sit on the hands and wait clarification, because we can’t enter long since market at overbought at Fib resistance.

60-min
On hourly chart market has accomplished our DRPO “Sell” by nice AB=CD pattern right at K-support area. One thing why I’m not absolutely sure with upward continuation is current action up, it does not look like thrusting action and more as retracement after move down.
Anyway, analysis of short-term charts does not give us possibility to create clear trading plan right now, since market is showing sideways consolidation by far. But we need that current retracement was not too extended and we need that market re-establish move down as soon as possible.

Conclusion:
On longer time frames we still have bearish patterns and bearish setup is still valid, since even upward price action on Thursday couldn’t break it. Since we can’t enter long due overbought and resistance on daily, all that we can do in the beginning of the week – is to monitor whether market will confirm our expectations or not. Particularly speaking, we need to see downward reversal as soon as possible and get confidence that market is continuing move down. In fact, daily B&B could become just a triggering pattern, since weekly bearish stop grabber assumes significantly lower action.
The technical portion of Sive's analysis owes a great deal to Joe DiNapoli's methods, and uses a number of Joe's proprietary indicators. Please note that Sive's analysis is his own view of the market and is not endorsed by Joe DiNapoli or any related companies.
Just we were happy with downward breakout of the flag two weeks ago, but our happiness was not very long as market has stopped move down due FOMC meeting protocol, that contains voting and major points of discussion and shows that many OMC members do not support fast and aggressive QE closing. Actually this information is not new and right after FOMC meeting, when markets have shown furius reaction Bernanker was hurry to put on back-pedal and chill out markets a bit. But one thing is Bernanke post-comments and quite another one – official FOMC meeting protocol. In long term perspective markets will probably try to understand whether this bounce is something long-play issue or just short-term reaction.
Previously we said that on monthy time frames nearest tendency will be determined by flag breakout direction. Depending on breakout direction – further action will follow.Two weeks ago we’ve got significant bearish pattern – bullish trap or fake upward flag breakout. By classical school of technical analysis this should lead to oposite real breakout, i.e. downside. But now we see the same oposite picture. Also market is stuck in yearly pivot point and 50% support area again. Still there is significant difference still exists. Why bullish trap has been confirmed already, current fake breakout is not confirmed yet, since July candle is still in progress. It could happened that by the close of the month, the downward breakout will be real. As we can see, monthly chart can’t help us much by far in our short-term trading.
In long-term perspective, now we can start to watch over bearish dynamic pressure here, on monthly chart. Now it can be signed much easier than before. Take a look that although trend holds bullish, price action mostly develops oppositely.
Targets to the downside remain the same – minimum target stands the same area around Yearly Pivot support 1 and preavious lows 1.2150-1.23. Potentially this probably will trigger downward action by huge AB=CD pattern that has minor 0.618 target and will challenge 1.1875 lows around all time major 50% support. Dynamic pressure itself suggests taking out of previous lows around 1.2050.
But on coming week our major focus will be on weekly and daily time frames.
Weekly
Here is guys the foundation for whole our work on coming week. This is bearish stop grabber pattern, and I have big hopes with it. If you will take a careful look at this chart, then you’ll see that despite how drastical this bounce was – it has not shown anything outstanding for bearish trend here. What in really it has happened – market has hit significant support of neckline, MPS1 and what is most important – 0.618 target of H&S AB=CD pattern. And we know that even after 0.618 target some retracement could follow, but this retracement should not be too deep. And our retracement is not deep at all – just 5/8 from small CD leg. MPP has been tested and market has returned right below it. That’s being said, right now I do not see the break of previous bearish setup, at least by far. So our working range for coming week is a range of stop grabber. Invalidation point at top and minimum target at bottom.
Daily
Here is few that we can add. Friday was an inside trading session and upward furious action we’ve discussed already many times. Currently our B&B setup interestingly coincides with bearish stop grabber on weekly chart and hardly this has happened just occasionally. Unfortunately, there are too small time has passed and we can’t understand yet – whether this upward splash was mostly emotional or not. If yes, than it should not last too long. Technically if you remember, we many times have said that market looks overextended to the downside. This is as pushed spring – when it releases, it happens fast. This is what we’ve seen on previous week. Now our major task is control overall action here. We need to get signs of starting downward move on Monday to get a confidence with as B&B as stop grabber.
4-hour
Here market stands in a bit tricky moment. At the first glance, B&B has started nice, but on Friday market has stopped a bit. And now it is not quite clear – whether we will get deeper move up, or this is just shallow retracement, because price has hit an agreement of AB-CD minor 0.618 target and 3/8 Fib support. Butterfly “Sell” is impossible here, since current low stands slightly lower than initial AB swing. But we have a hint on potential bullish dynamic pressure – trend has turned bearish, but price action has shown upward action. So, as market has hit just minor support level, we do not want to get too extended bounce, especially we do not want to see exceeding of previous high, since there is invalidation point of weekly stop grabber pattern. Thus, all that we can do here is protect shorts that we have with breakeven and if market will continue move up – sit on the hands and wait clarification, because we can’t enter long since market at overbought at Fib resistance.
60-min
On hourly chart market has accomplished our DRPO “Sell” by nice AB=CD pattern right at K-support area. One thing why I’m not absolutely sure with upward continuation is current action up, it does not look like thrusting action and more as retracement after move down.
Anyway, analysis of short-term charts does not give us possibility to create clear trading plan right now, since market is showing sideways consolidation by far. But we need that current retracement was not too extended and we need that market re-establish move down as soon as possible.
Conclusion:
On longer time frames we still have bearish patterns and bearish setup is still valid, since even upward price action on Thursday couldn’t break it. Since we can’t enter long due overbought and resistance on daily, all that we can do in the beginning of the week – is to monitor whether market will confirm our expectations or not. Particularly speaking, we need to see downward reversal as soon as possible and get confidence that market is continuing move down. In fact, daily B&B could become just a triggering pattern, since weekly bearish stop grabber assumes significantly lower action.
The technical portion of Sive's analysis owes a great deal to Joe DiNapoli's methods, and uses a number of Joe's proprietary indicators. Please note that Sive's analysis is his own view of the market and is not endorsed by Joe DiNapoli or any related companies.