Sive Morten
Special Consultant to the FPA
- Messages
- 18,699
Monthly
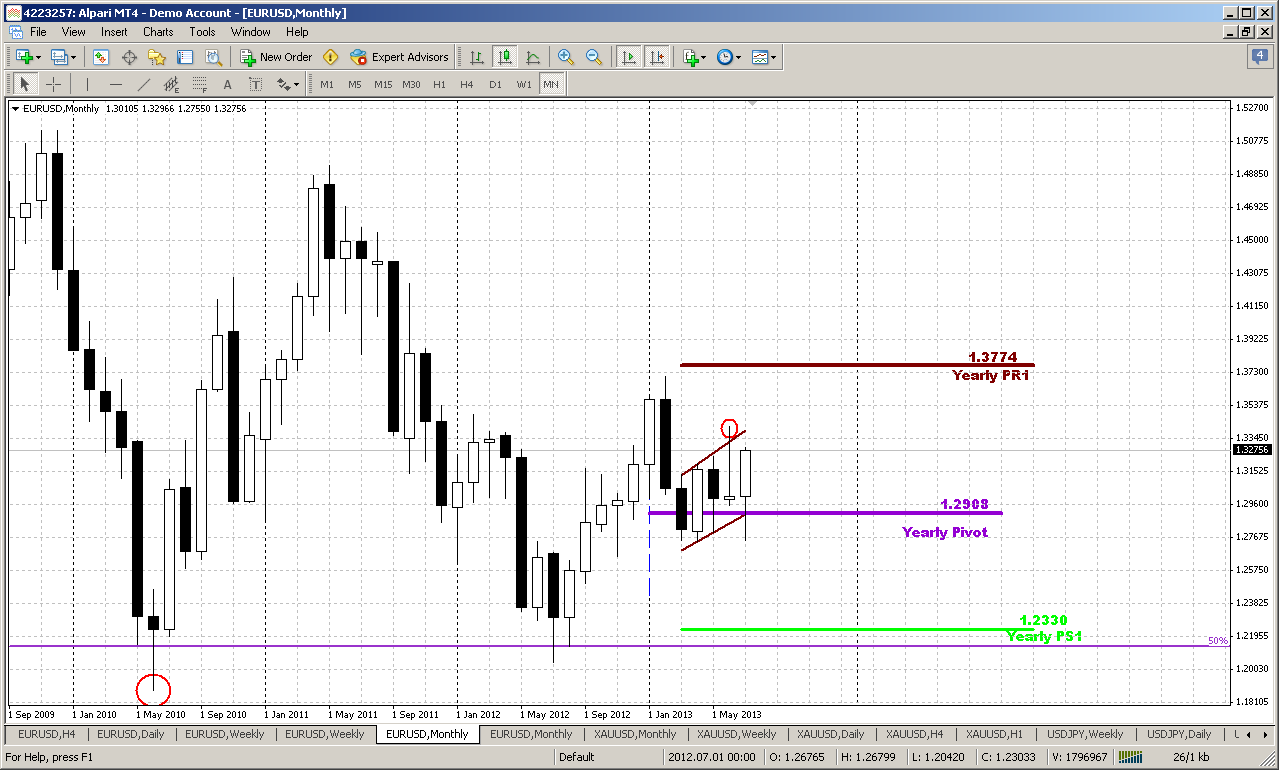
We so many times have discussed this time frame that it is really the challenge to find something new and interesting here. At first glance it could be seen that here is nothing special and no big deal around, but in reality the oposite is true – it is a big deal around current level. Direction of real breakout of the flag pattern could set the direction of the market in long-term perspective. Partially we’ve talked about it in yesterday’s video. But here are some more details. It is probably rather milestone sign that market is forming indecision pattern right around breakeven point of long-term sentiment, I mean yearly pivot point. It is very simbolical at current moment. Speaking about flag pattern itself, we already can find a lot of covert signs. For example, usually when price shows bullish trap action, i.e. fake upward breakout, in 90% of cases oposite real breakout follows. But what we see here? We see double failure. First it was bullish trap and then it was cancelled by bearish trap, since breakout down was also false and now is the question will real breakout up follow or not. We could think that as market has vanished bearish pattern – it must be strong bullish moment and may be this is true, especially because market still hold above yearly pivot. But we can ask – why this can’t happen again? Now let’s take a look at next picture and you will understand, why this flag is cornerstone.
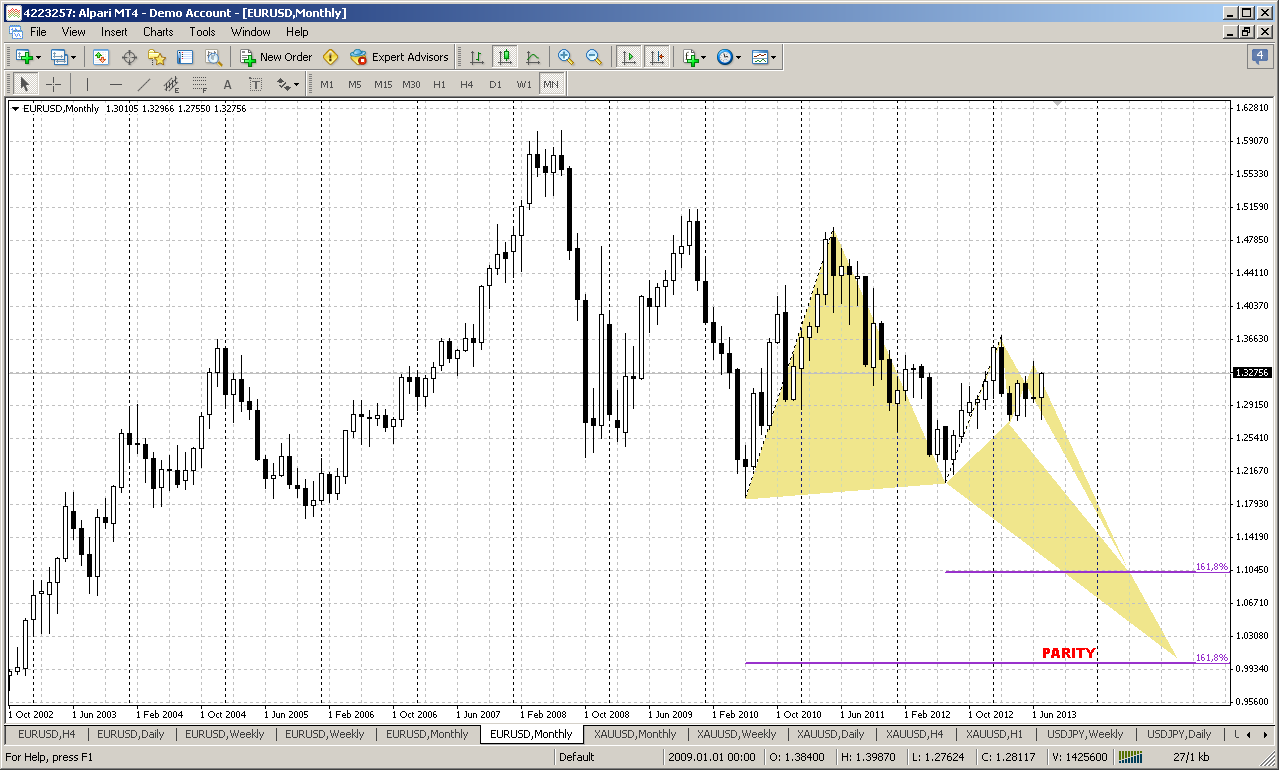
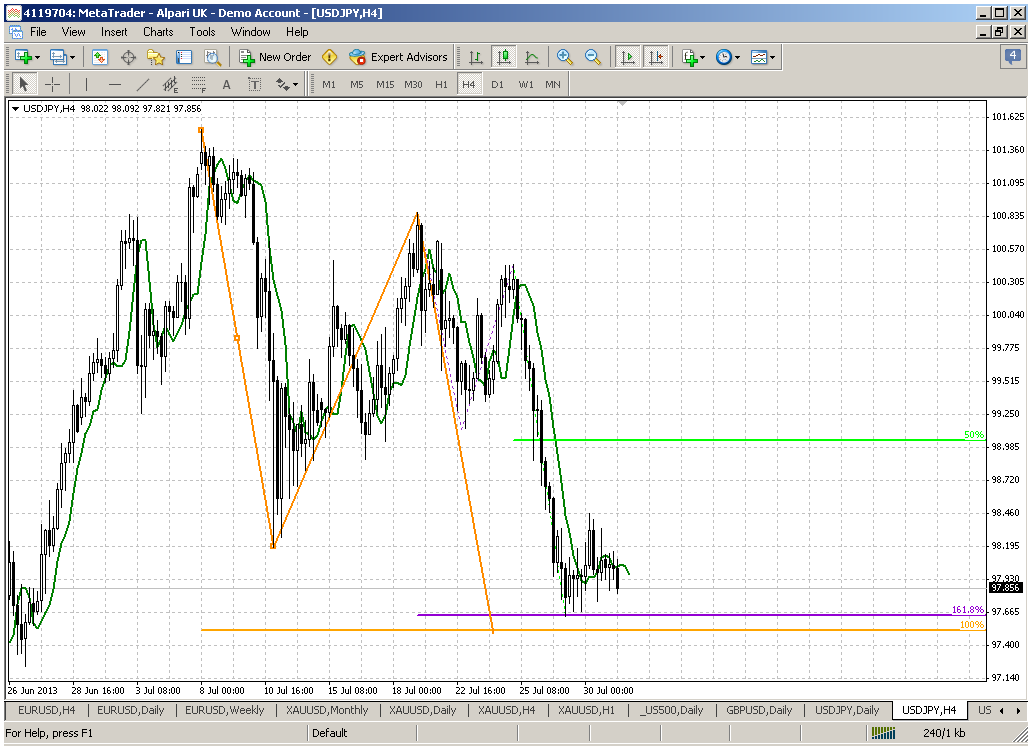
Here is what could happen, if we will get downward breakout:
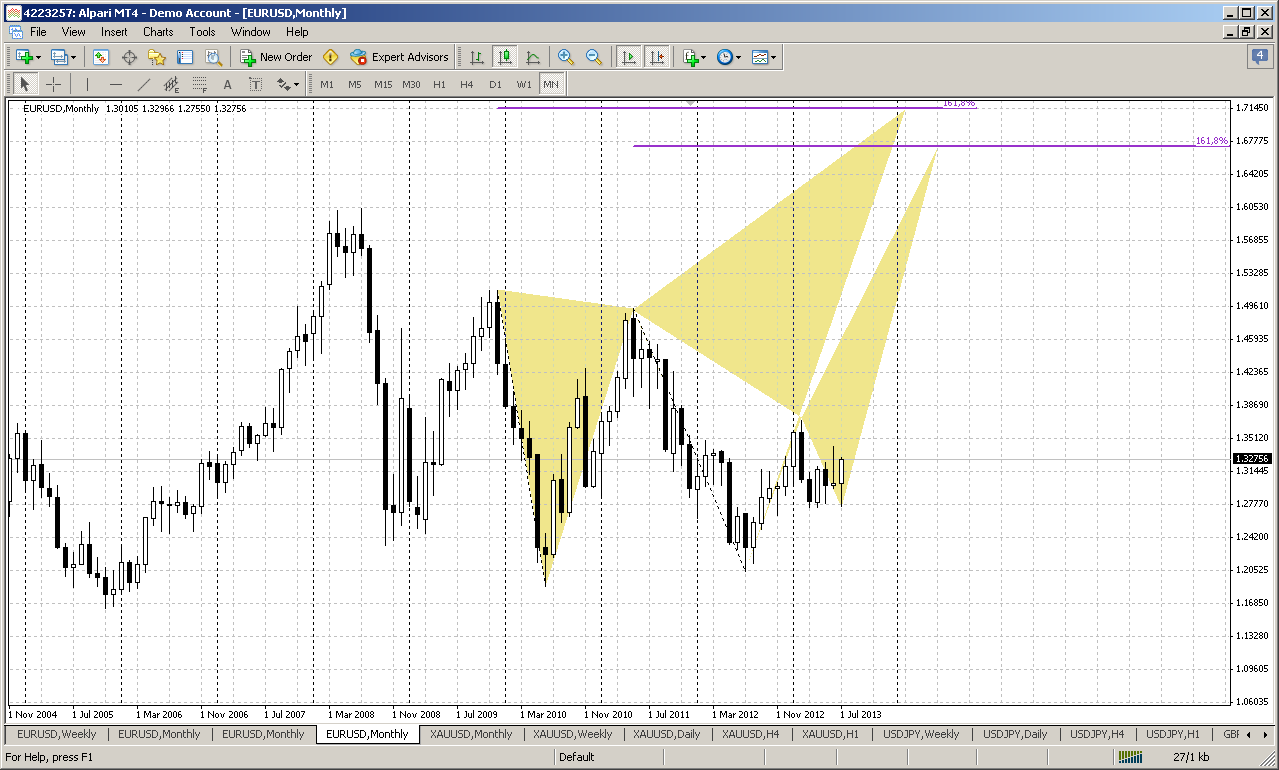
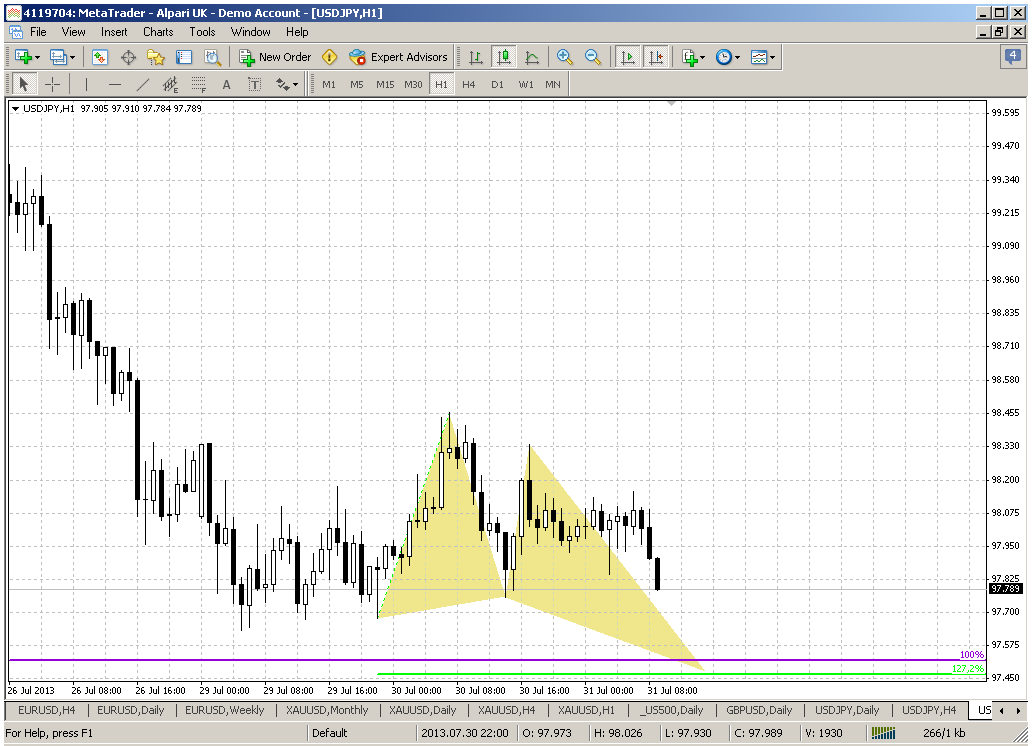
Upward scenarios are also impressive:
Still understand me correctly, I’ve drawn 1.618 butterflies, but may be they will be 1.27, may be there will be some other patterns. Other words, we should not treat these scenarios as something definite. What we have to understand is that current moment could become a defining one for long-term perspective. We do not trade monthly charts (although may be someone of you do), but when we understand what is going on in big picture – we know major direction of the market, hence we know in what direction to trade on lower time frames and you can do this for extended period of time. Market now still stands in tight range and may be we will not get direction on coming week and even during next month, but when it will happen, the action could become really fast. Usually such moments coincide with some significant future fundamental events and changes. Sometimes we scare of large scales and we can’t believe in such significant moves and tell “hardly it will happen, this is too great”. But imagine that this is hourly chart – and picture becomes absolutely objective.
That’s why when market in general stands indecision, it is very difficult to trade pure trend action on lower time frames, when you do not have clear patterns. If market still has not chosen the direction, how you can trade it with confidence? In such moments it is better either switch to another asset, or trade clear patterns that market will form in short-term context.
Weekly
The first picture of weekly chart at my hesitate opinion has more bullish signs rather than bearish. This conclusion mostly comes from the way of market’s respect on 1.2750 support area. You probably remember that this level was a neckline of H&S pattern, 0.618 extension of AB-CD pattern, some fib level – in short it was solid support. Normal bearish development didn’t forbid a bounce from that area, but later market should return right back and pass through this support area. Bounce should not be too extended. But what do we see know? Market almost has reached the top of former right shoulder, price has erased bearish stop grabber pattern, that could not have come at a better time. Now trend has turned bearish, market stadily stands above MPP and very close to MPR1. Other words, market has vanished all bearish signs that were formed previously. That’s why something put me to think that bullish development is more probable here in nearest future, although technically we do have nothing except bullish engulfing pattern and bull trend. At least chances are exist that market will reach previous highs or even reach upper border of widening triangle.
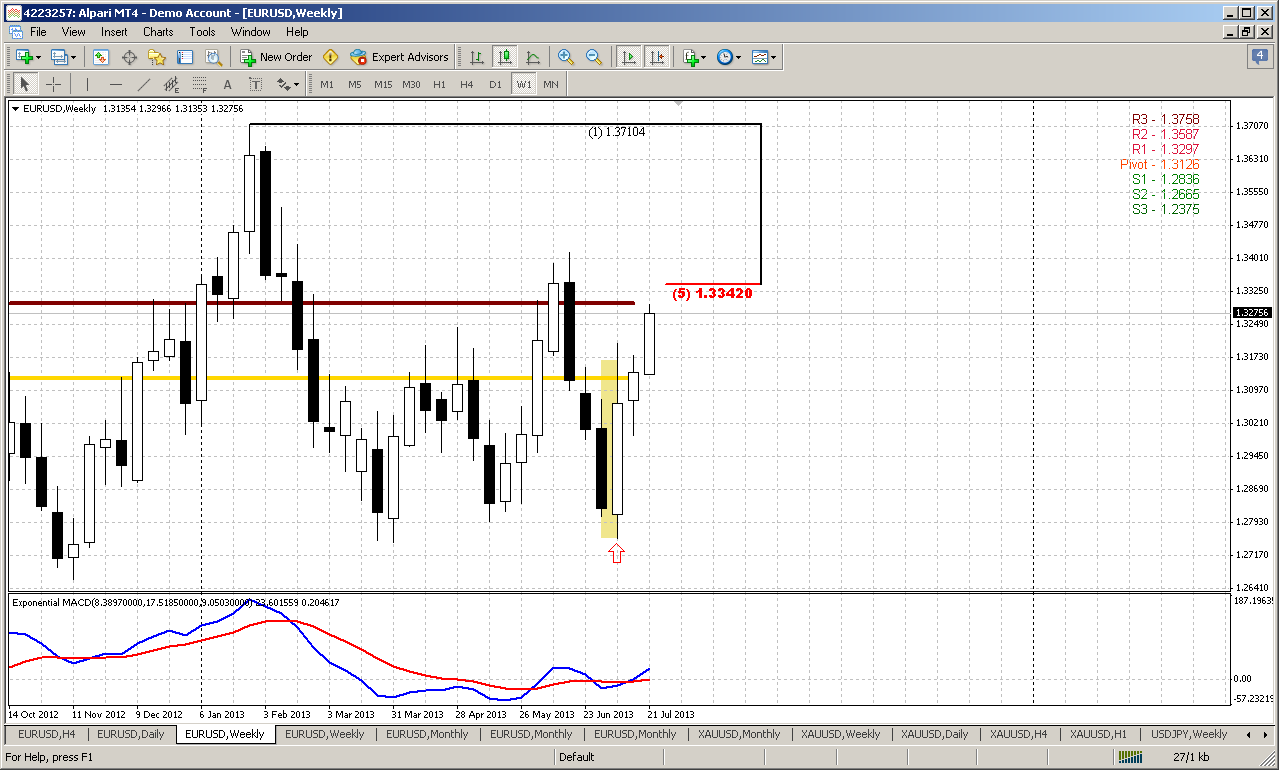
On previous week we also have taken a look at this chart and here you can see how it could be significant the direction of breakout of widening triangle:
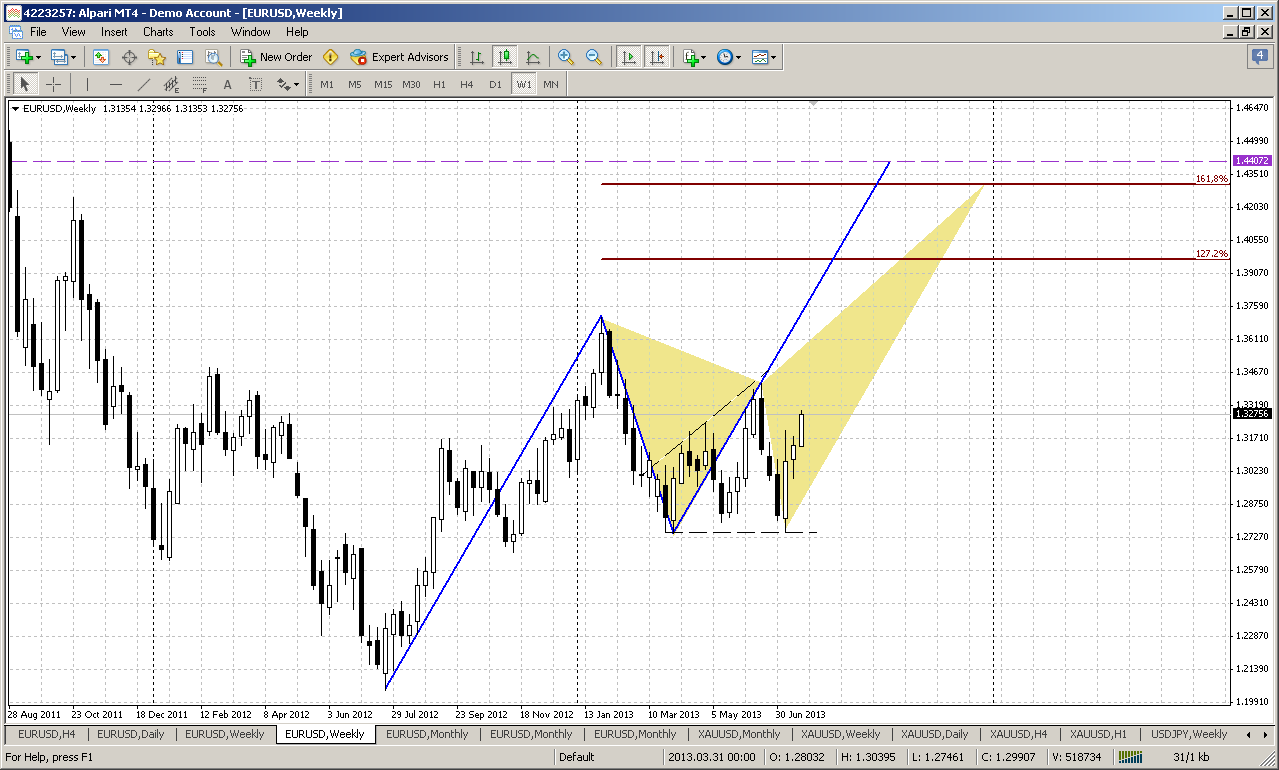
Now price stands with 5th wave inside of it. Sometimes flat exit from triangles happens, but in most cases market will either show breakout to the upside or fail to reach previous top and turn to the downside. Current low stands slightly higher than previous one and this keeps road open for appearing of butterfly “sell” with ultimate target round 1.43 area. Somewhere around stands objective point of AB=CD pattern either. What is significant that this possible scenario ergonomically links with monthly perspectives of possible upward action, especially close above MPP and hit over obviousness of H&S pattern by shifting it to H&S failure. That is also logical, since obvious patterns rare works. Will see, but this significantly renovate overall action on EUR and gives absolutely different picture. Now we just have to educe signs of this potential move and control it’s normal development.
Perspectives to the downside we have discussed already on Friday and they could be seen on monthly chart – that could be butterfly “Buy”.
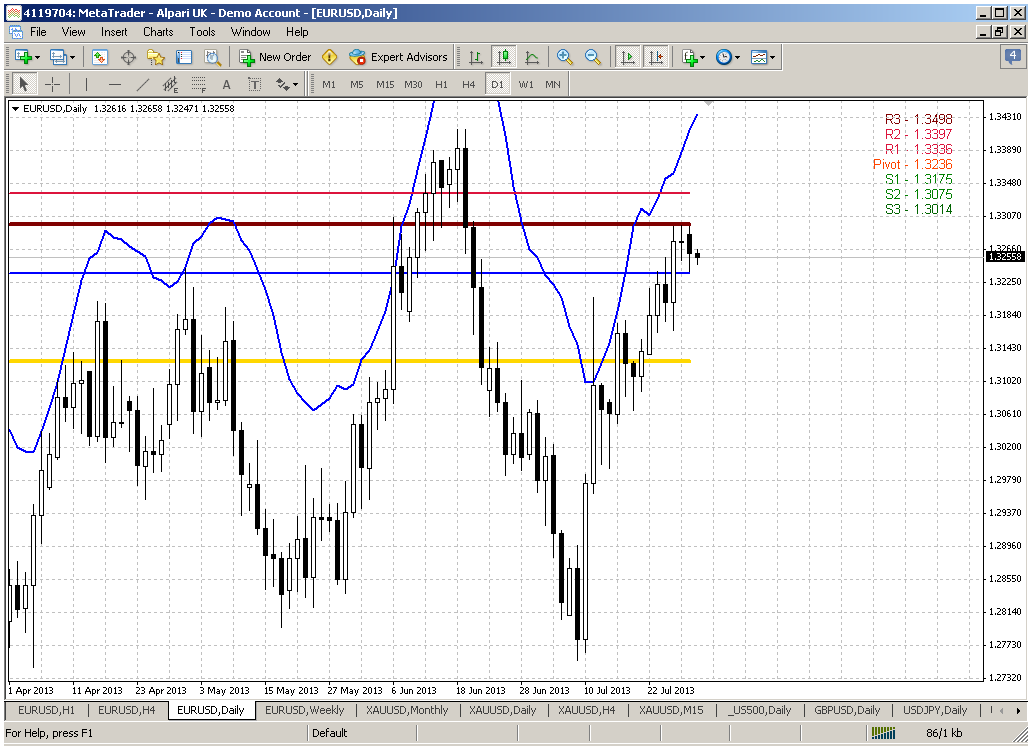
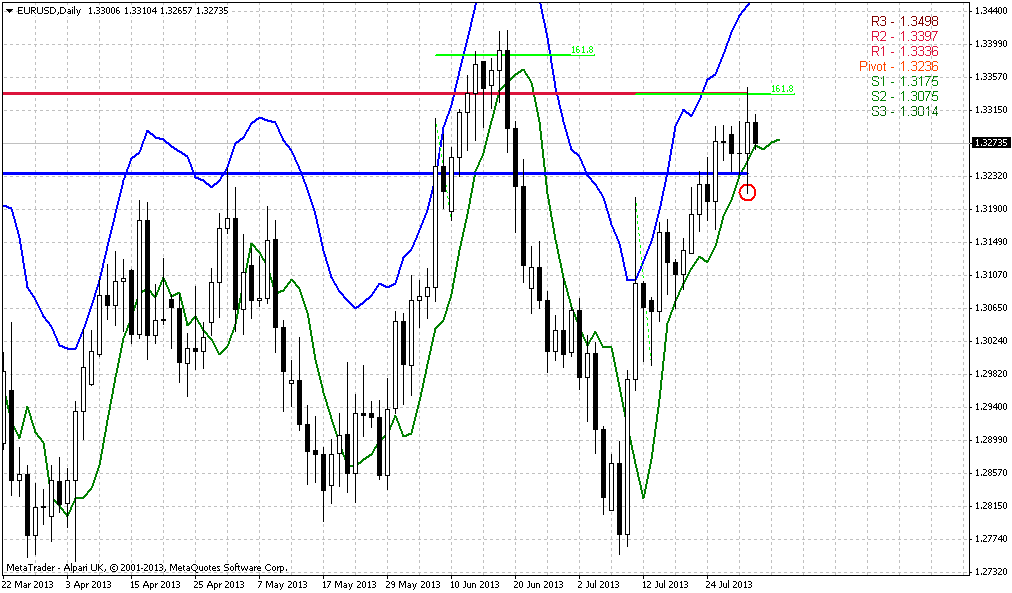
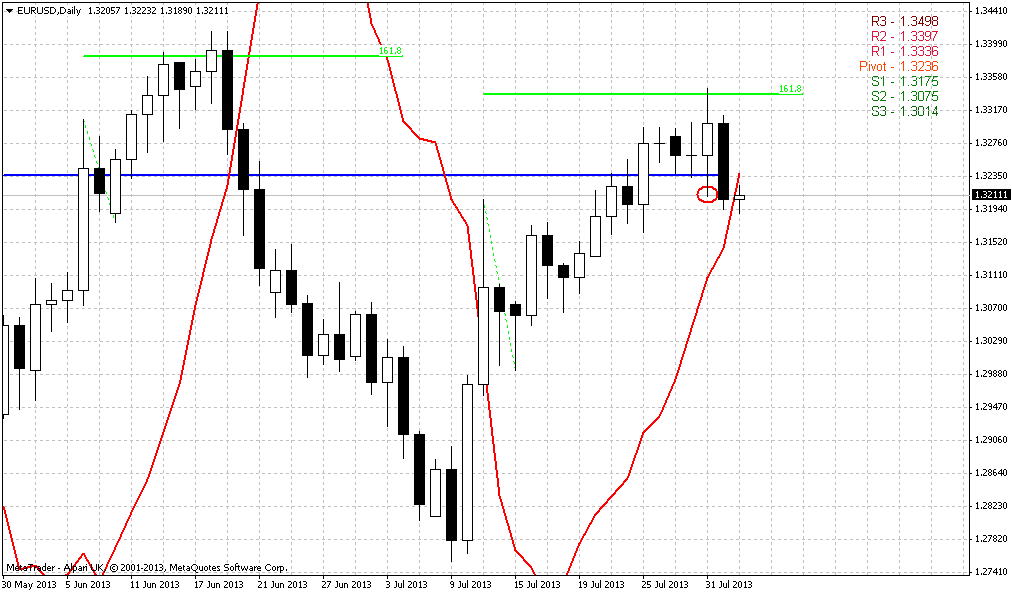
Daily
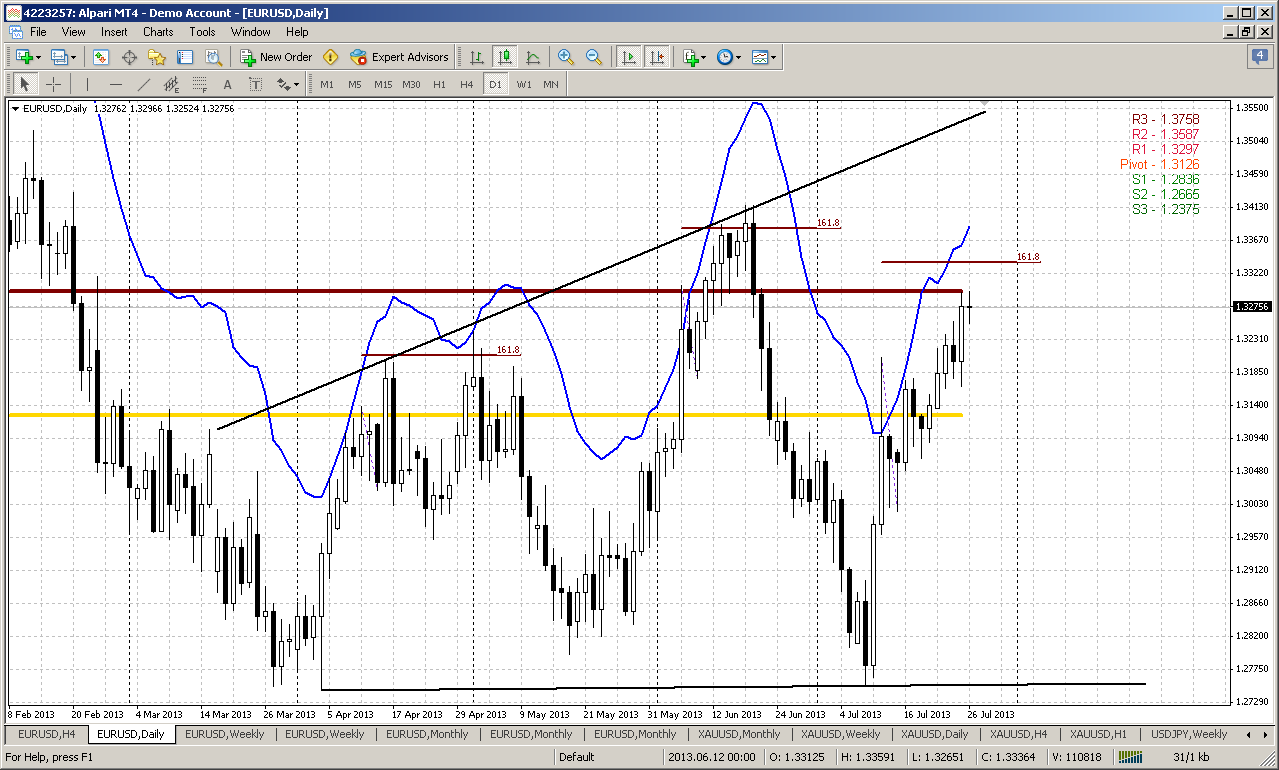
Well, guys, here I can’t add anything new. We have small Friday indecision candle and all that we’ve said on Friday is still valid. Trend is bullish here and market is still approaching to significant area. As we’ve noted EUR very often shows 1.618 extension after hitting of overbought level before any significant changes happen and this level stands around 1.3350. Simultaneously somewhere around (in relation to widening triangle) usually happens the failure moment, if price will not be able to pretend on upward breakout of megaphone pattern. As a rule, if price does not reach the upper border of triangle and turns down – this might become early sign of possible downward breakout.
And finally, market is showing some stable bullish pressure. Price has not turned down after initial spike, but gradually moving and moving higher. Very often this leads to fast upward acceleration and I can’t exclude that coming week could become defining moment. Still, as this area stands slightly higher, in the beginning of the week we can’t do much, because this will be mostly look like gambling risk, rather than reasonable trading.
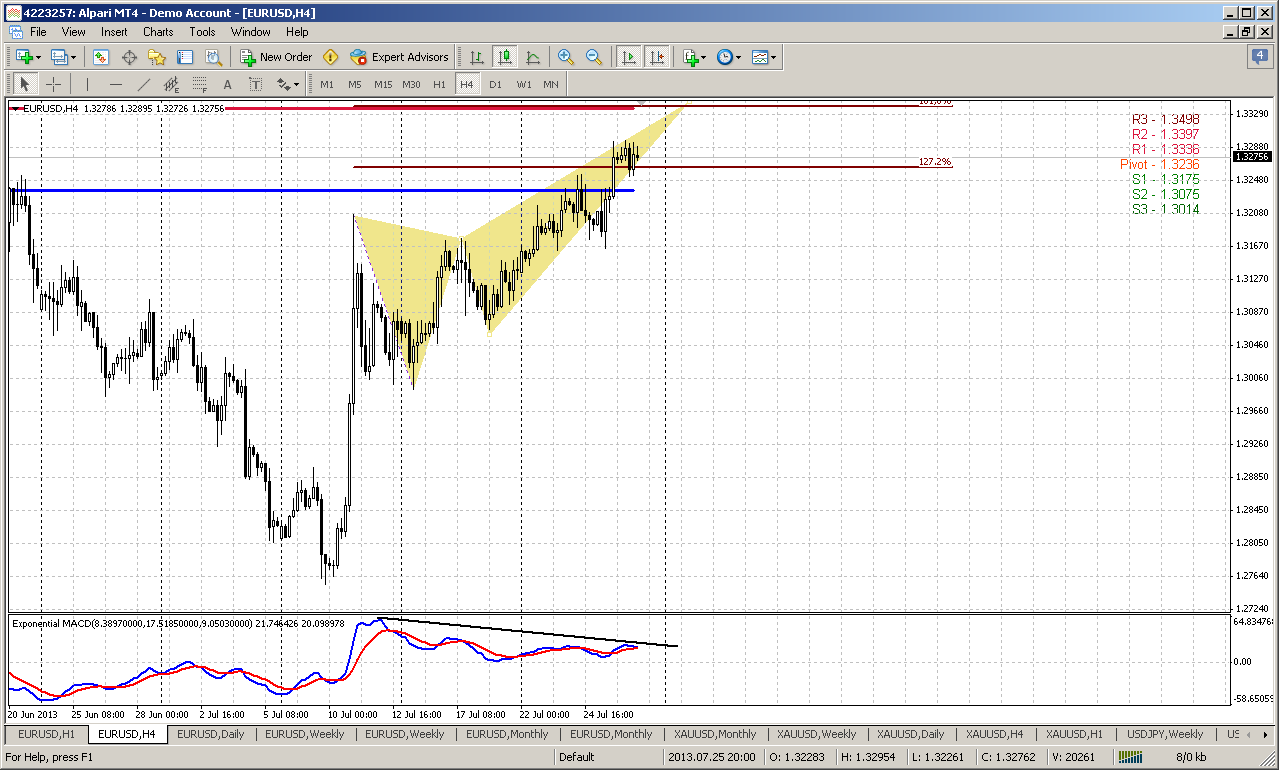
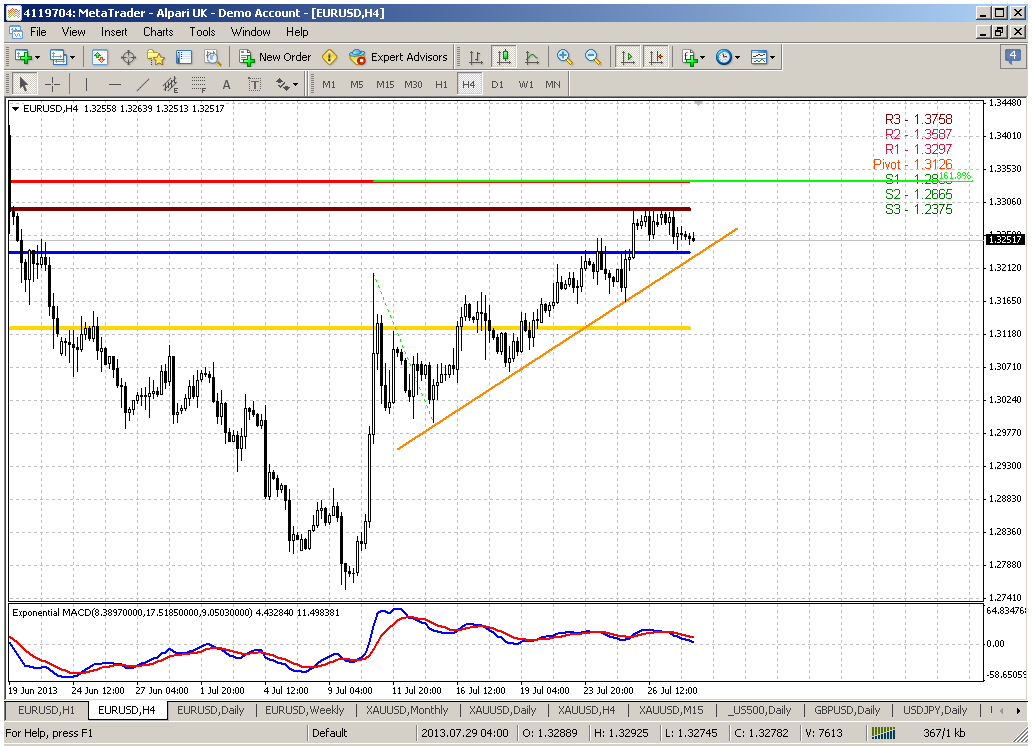
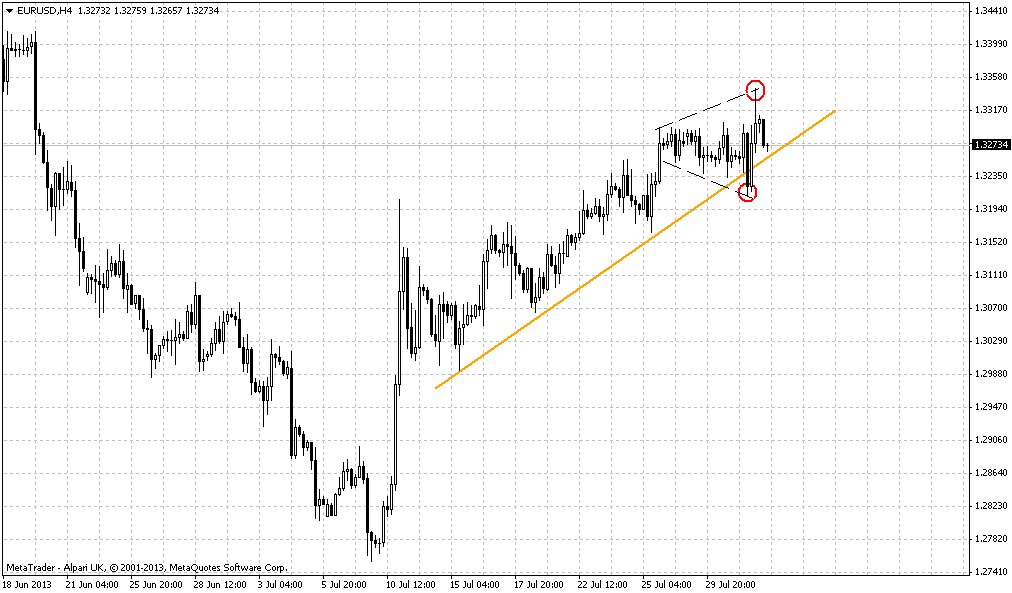
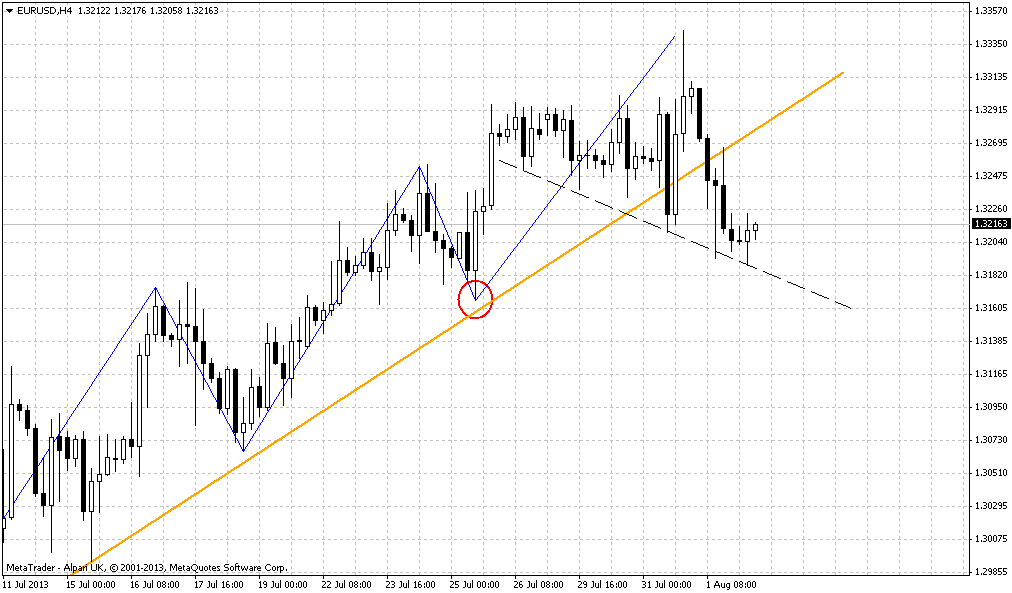
4-hour
Here is we see the same picture as on Friday, since market has not shown any solid action yesterday. Now we see that 1.3350 area will be not only MPR1 and target of butterfly pattern but also a WPR1 on coming. In the beginning of the week we can’t exclude that market will show retracement to WPP, but neccesary condition here is to see that market will remain above it. Usually market shows fast acceleration up, when market shows initial splash, then gradual and choppy but upward action. Thus, on Monday first we will monitor price behavior around WPP and later, what is more interesting – how market will response on 1.3350. I have some feeling that we could see fast and furious upward breakout, but do not treat it as a call to take long position right on Monday. Our view here the same – get breakout first and enter on retracement second. We do not call you for gambling and taking position in advance of breakout, because this is too risky.
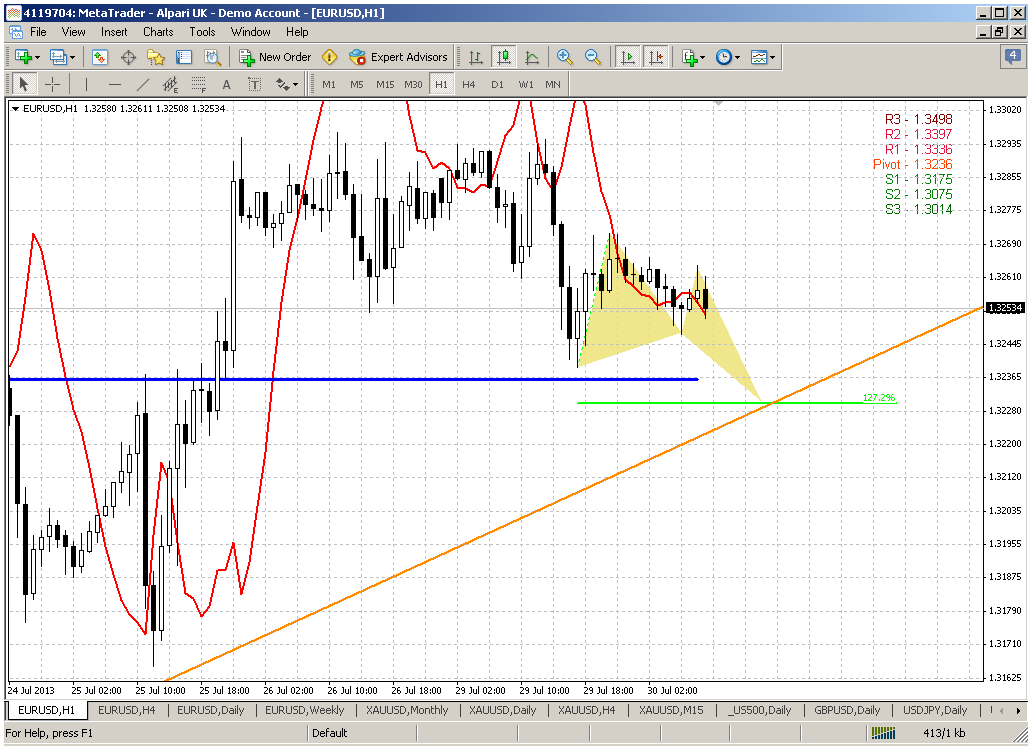
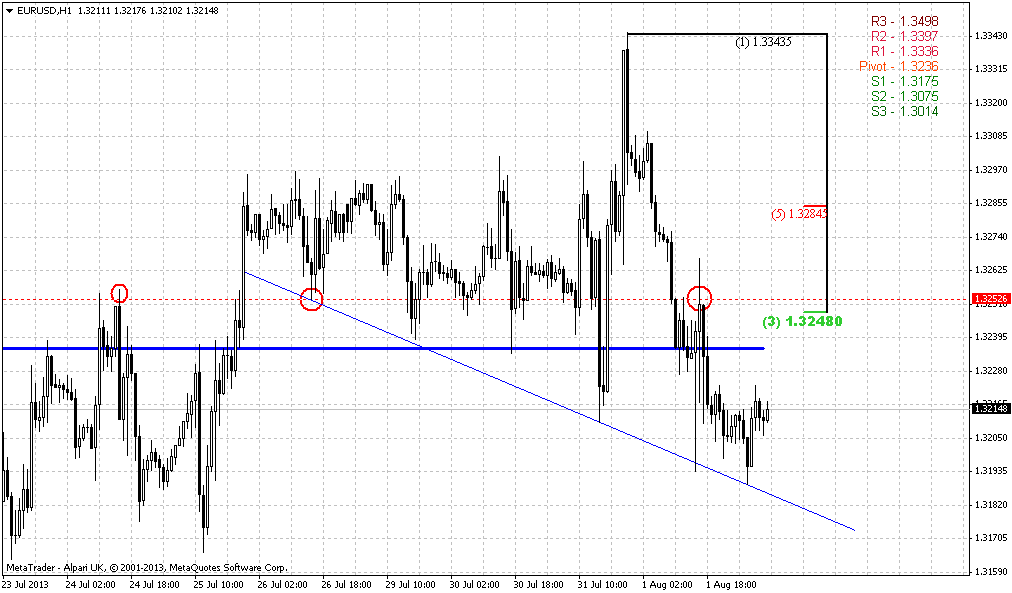
On hourly chart we have the same upward channel and market stands near the upper border, thus, short retracement to WPP is logical and possible, but most interesting things should happen after that, as we’ve said.
Conclusion:
Currently on different time frames across the board some bullish hints are started to appear. They are blur and not obvious but they are visible. We probably stand at the eve of clarification moment that could happen very soon.
Very probable that price action will become clearer and stronger after current period of choppy behavior.
The technical portion of Sive's analysis owes a great deal to Joe DiNapoli's methods, and uses a number of Joe's proprietary indicators. Please note that Sive's analysis is his own view of the market and is not endorsed by Joe DiNapoli or any related companies.
We so many times have discussed this time frame that it is really the challenge to find something new and interesting here. At first glance it could be seen that here is nothing special and no big deal around, but in reality the oposite is true – it is a big deal around current level. Direction of real breakout of the flag pattern could set the direction of the market in long-term perspective. Partially we’ve talked about it in yesterday’s video. But here are some more details. It is probably rather milestone sign that market is forming indecision pattern right around breakeven point of long-term sentiment, I mean yearly pivot point. It is very simbolical at current moment. Speaking about flag pattern itself, we already can find a lot of covert signs. For example, usually when price shows bullish trap action, i.e. fake upward breakout, in 90% of cases oposite real breakout follows. But what we see here? We see double failure. First it was bullish trap and then it was cancelled by bearish trap, since breakout down was also false and now is the question will real breakout up follow or not. We could think that as market has vanished bearish pattern – it must be strong bullish moment and may be this is true, especially because market still hold above yearly pivot. But we can ask – why this can’t happen again? Now let’s take a look at next picture and you will understand, why this flag is cornerstone.
Here is what could happen, if we will get downward breakout:
Upward scenarios are also impressive:
Still understand me correctly, I’ve drawn 1.618 butterflies, but may be they will be 1.27, may be there will be some other patterns. Other words, we should not treat these scenarios as something definite. What we have to understand is that current moment could become a defining one for long-term perspective. We do not trade monthly charts (although may be someone of you do), but when we understand what is going on in big picture – we know major direction of the market, hence we know in what direction to trade on lower time frames and you can do this for extended period of time. Market now still stands in tight range and may be we will not get direction on coming week and even during next month, but when it will happen, the action could become really fast. Usually such moments coincide with some significant future fundamental events and changes. Sometimes we scare of large scales and we can’t believe in such significant moves and tell “hardly it will happen, this is too great”. But imagine that this is hourly chart – and picture becomes absolutely objective.
That’s why when market in general stands indecision, it is very difficult to trade pure trend action on lower time frames, when you do not have clear patterns. If market still has not chosen the direction, how you can trade it with confidence? In such moments it is better either switch to another asset, or trade clear patterns that market will form in short-term context.
Weekly
The first picture of weekly chart at my hesitate opinion has more bullish signs rather than bearish. This conclusion mostly comes from the way of market’s respect on 1.2750 support area. You probably remember that this level was a neckline of H&S pattern, 0.618 extension of AB-CD pattern, some fib level – in short it was solid support. Normal bearish development didn’t forbid a bounce from that area, but later market should return right back and pass through this support area. Bounce should not be too extended. But what do we see know? Market almost has reached the top of former right shoulder, price has erased bearish stop grabber pattern, that could not have come at a better time. Now trend has turned bearish, market stadily stands above MPP and very close to MPR1. Other words, market has vanished all bearish signs that were formed previously. That’s why something put me to think that bullish development is more probable here in nearest future, although technically we do have nothing except bullish engulfing pattern and bull trend. At least chances are exist that market will reach previous highs or even reach upper border of widening triangle.
On previous week we also have taken a look at this chart and here you can see how it could be significant the direction of breakout of widening triangle:
Now price stands with 5th wave inside of it. Sometimes flat exit from triangles happens, but in most cases market will either show breakout to the upside or fail to reach previous top and turn to the downside. Current low stands slightly higher than previous one and this keeps road open for appearing of butterfly “sell” with ultimate target round 1.43 area. Somewhere around stands objective point of AB=CD pattern either. What is significant that this possible scenario ergonomically links with monthly perspectives of possible upward action, especially close above MPP and hit over obviousness of H&S pattern by shifting it to H&S failure. That is also logical, since obvious patterns rare works. Will see, but this significantly renovate overall action on EUR and gives absolutely different picture. Now we just have to educe signs of this potential move and control it’s normal development.
Perspectives to the downside we have discussed already on Friday and they could be seen on monthly chart – that could be butterfly “Buy”.
Daily
Well, guys, here I can’t add anything new. We have small Friday indecision candle and all that we’ve said on Friday is still valid. Trend is bullish here and market is still approaching to significant area. As we’ve noted EUR very often shows 1.618 extension after hitting of overbought level before any significant changes happen and this level stands around 1.3350. Simultaneously somewhere around (in relation to widening triangle) usually happens the failure moment, if price will not be able to pretend on upward breakout of megaphone pattern. As a rule, if price does not reach the upper border of triangle and turns down – this might become early sign of possible downward breakout.
And finally, market is showing some stable bullish pressure. Price has not turned down after initial spike, but gradually moving and moving higher. Very often this leads to fast upward acceleration and I can’t exclude that coming week could become defining moment. Still, as this area stands slightly higher, in the beginning of the week we can’t do much, because this will be mostly look like gambling risk, rather than reasonable trading.
4-hour
Here is we see the same picture as on Friday, since market has not shown any solid action yesterday. Now we see that 1.3350 area will be not only MPR1 and target of butterfly pattern but also a WPR1 on coming. In the beginning of the week we can’t exclude that market will show retracement to WPP, but neccesary condition here is to see that market will remain above it. Usually market shows fast acceleration up, when market shows initial splash, then gradual and choppy but upward action. Thus, on Monday first we will monitor price behavior around WPP and later, what is more interesting – how market will response on 1.3350. I have some feeling that we could see fast and furious upward breakout, but do not treat it as a call to take long position right on Monday. Our view here the same – get breakout first and enter on retracement second. We do not call you for gambling and taking position in advance of breakout, because this is too risky.
On hourly chart we have the same upward channel and market stands near the upper border, thus, short retracement to WPP is logical and possible, but most interesting things should happen after that, as we’ve said.
Conclusion:
Currently on different time frames across the board some bullish hints are started to appear. They are blur and not obvious but they are visible. We probably stand at the eve of clarification moment that could happen very soon.
Very probable that price action will become clearer and stronger after current period of choppy behavior.
The technical portion of Sive's analysis owes a great deal to Joe DiNapoli's methods, and uses a number of Joe's proprietary indicators. Please note that Sive's analysis is his own view of the market and is not endorsed by Joe DiNapoli or any related companies.
")