Sive Morten
Special Consultant to the FPA
- Messages
- 18,732
Fundamentals
Reuters reports dollar was mixed on Friday with month-end selling after a recent rally, as traders saw little in weak first-quarter U.S. gross domestic product data to discourage bets the Federal Reserve will start raising interest rates in 2015.
"Underlying sentiment remains positive but the dollar is seeing some profit taking and month-end, book-balancing catch-up after its recent advance," said Joe Manimbo, senior market analyst at Western Union Business Solutions in Washington.
The U.S. government reported that the American economy contracted during January, February and March because of heavy snowfalls, a resurgent dollar and disruptions at West Coast ports.
The government slashed its gross domestic product estimate to show GDP shrinking at a 0.7 percent annual rate instead of the 0.2 percent growth pace it estimated last month.
Economists point to bad weather and other unusual circumstances in early 2015 and caution against reading too much into the slump, which could oblige Fed policymakers to delay ending an era of near-zero U.S. rates.
More recent data, particularly upbeat home sales, reinforced the view the economy was recovering from the weather-related problems and the Fed was still on track to raise rates.
"The GDP data was largely in line, slightly better than what the market expected," said Thierry Albert Wizman, global interest rates and currencies strategist at Macquarie Ltd in New York.
A spokesman for Greece's government said it intends to reach an agreement with lenders on a cash-for-reforms deal by Sunday, after euro zone officials suggested a deal was far from imminent.
Traders cited a warning from Japanese Finance Minister Taro Aso as a factor behind the dollar's move away from Thursday's high of 124.46 yen . That was a 12-1/2 year peak for the dollar which was last trading up 0.10 percent at 124.
CFTC data shows gradual contraction of short position all way CAD down and right now position has turned to net long rising $0.2bn to $0.6bn. Data shows that open interest also has increased, although its growth is not very significant. Overall long-to-short ratio stands around 55% and lets market to move in both directions. Still, shy increasing of long positions lets us to suggest that retracement on CAD could take last for some time yet.


Technicals
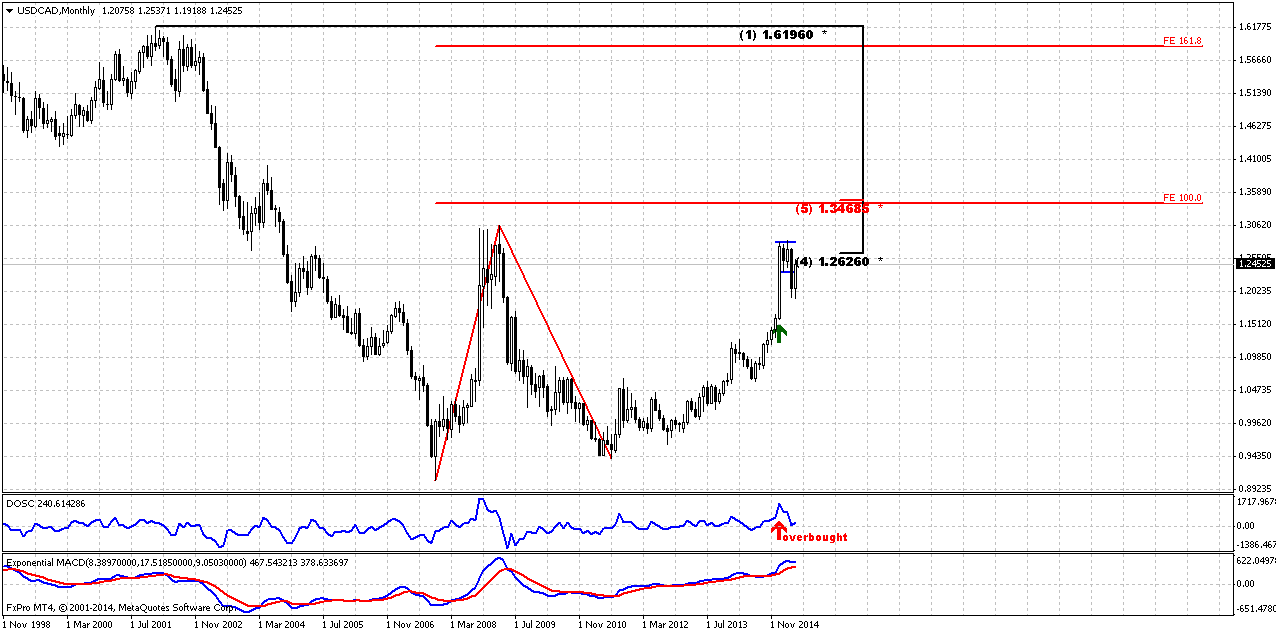
Monthly
We haven’t taken a look at CAD almost for 2 months and right now the first part of our former analysis has come to an end and we need to update our view. First, we remind you our previous thoughts. IT will help you to see whole picture.
CAD trend is bullish. We do not have any yearly pivots here because CAD has passed through all of them, even YPR2 at 1.23 area. Last time we’ve discussed big AB-CD pattern in progress that already has passed above 0.618 target and has major destination point at 1.3420 that creates Agreement with major Fib resistance. This pattern is still valid and stands as cornerstone of our analysis.
Last time the question was: “Whether market will continue higher or turn down right from here, since bearish positions on CAD were contracted significantly?
As market right now stands at 50% Fib level and has reached monthly overbought – this creates Stretch pattern and CAD almost whole month stands in tight range. All these moments lead us to conclusion that upward action probably should continue. Here are our arguments:
- Market has not reached major AB=CD target and odds suggest that market never shows reliable bearish reversal until this target will not be hit;
- We see acceleration candle that increase chances on upside continuation. It seems that market has stopped mostly due overbought and Fib resistance;
- Market stands very tight right under resistance and forms the shape of bullish flag.
All these moments point on doubts of possible downward reversal, especially taking into consideration CFTC data.”
Thus, previous analysis has led us to conclusion that market probably will show bounce down to respect resistance and overbought, but this should not be reversal, but retracement that was triggered by perfect weekly DRPO “Sell”. Now this setup has been finished. So, what’s next?
Market is not at overbought any more, but trend is still bullish here. If you will take a look at DOSC indicator you’ll see that it is coiling around zero. It means that Stretch pattern mostly has reached its target. Market was able to show retracement to the half of thrusting candle and this suggests possible further upside continuation as well as return back in the body of the flag pattern. So, monthly picture mostly stands in favor of upside continuation to our major long-term target 1.3470 – Agreement with major Fib resistance level.
But action could develop differently and our task here is to estimate how precisely it will happen, or at least, catch the markings that could help us identify one or another scenario.
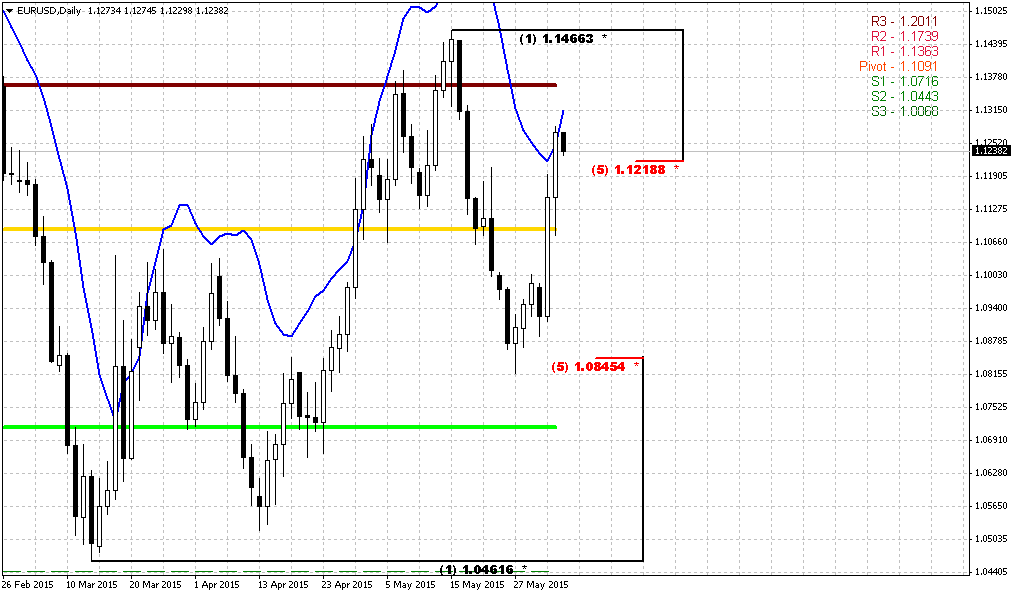
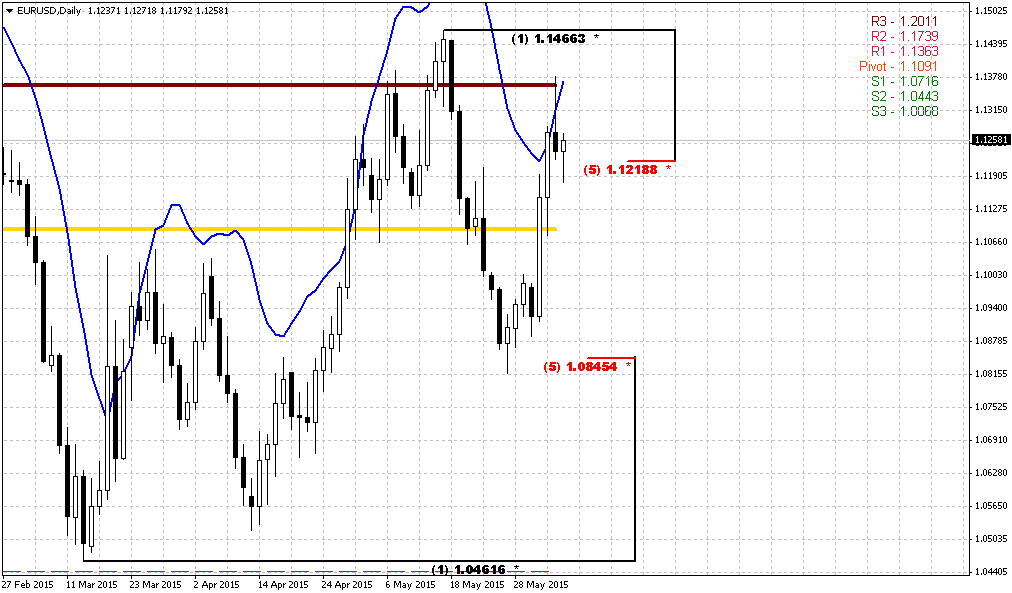
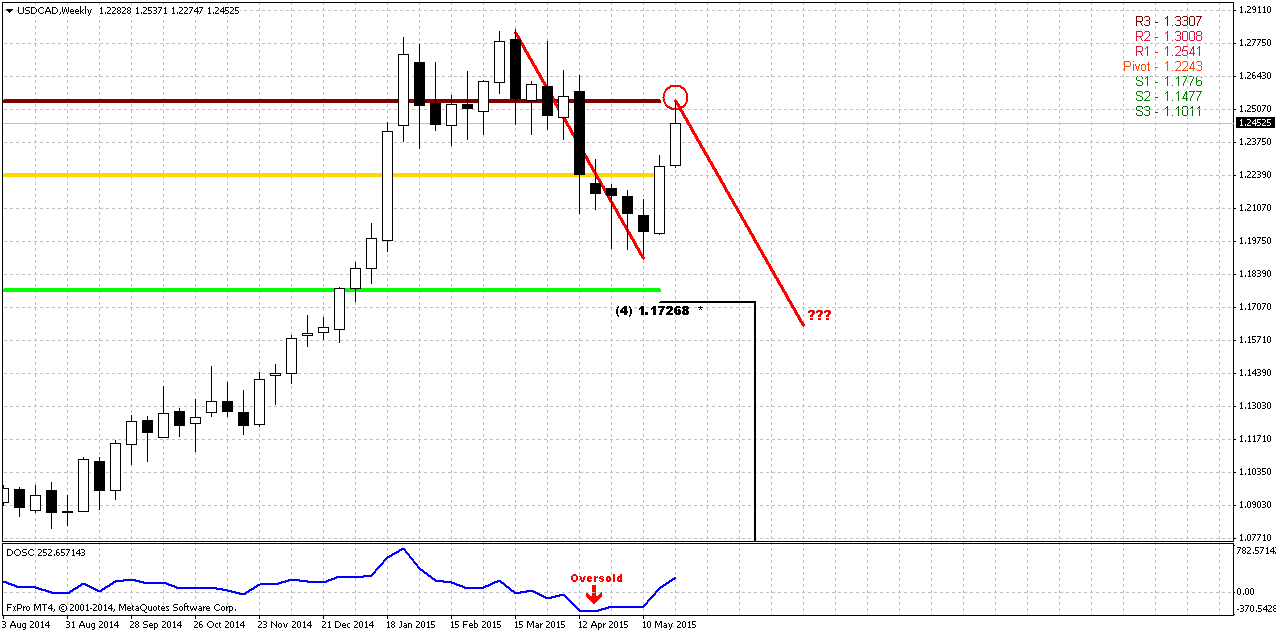
Weekly
Weekly chart shows very important moment. Trend is bearish here. I do not have 3x3 DMA here, but you probably remember our perfect DRPO “Sell” pattern that we have traded since mid of March. But somehow this DRPO pattern has not reached its target, that is 50% Fib support of its thrust and it stands at 1.1726. But why it has happened? Mostly because CAD was strongly oversold during last 3 weeks and this oversold condition prevented downward continuation. Here I keep May pivots. You can see that DOSC stands near zero and market stopped upward action right at MPR1. And we now that if PR1 holds upside retracement then bearish trend is still valid. Now is right time to recall CFTC report – long positions on CAD slightly but has increased. It means that DRPO still could reach its target but this could happen if action will take a shape of AB-CD down. If this will happen at all, of cause.
So, currently the major riddle is what was recent two weeks upside action – retracement or reversal? It could easily be explained as retracements – CFTC, oversold, upside action was held by MPR1. That’s why DRPO has not quite reached its target. And where is the edge between reversal and retracement? Where it will stop to be just retracement? Let’s try to find out it below…
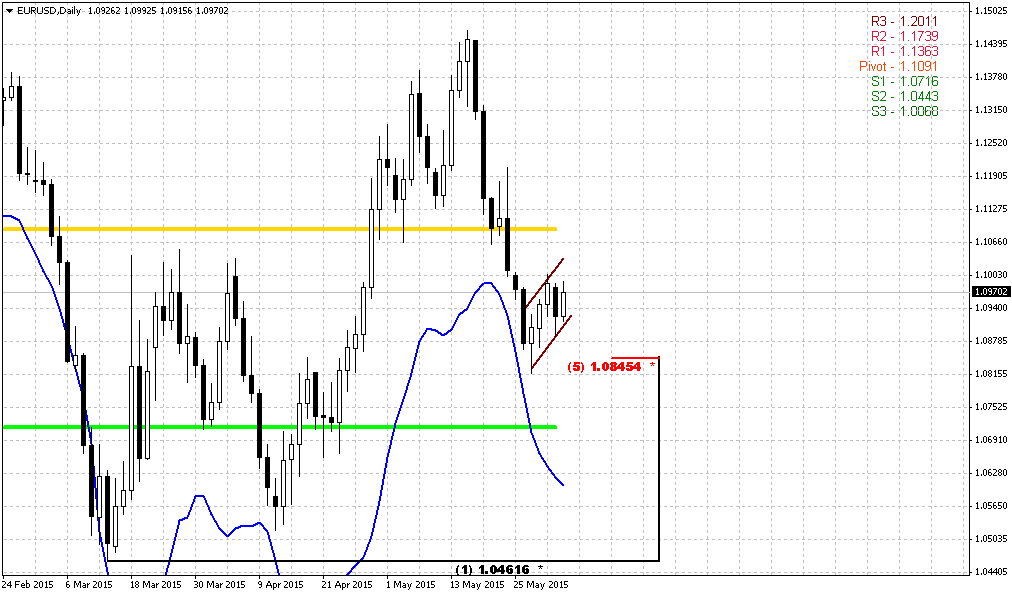
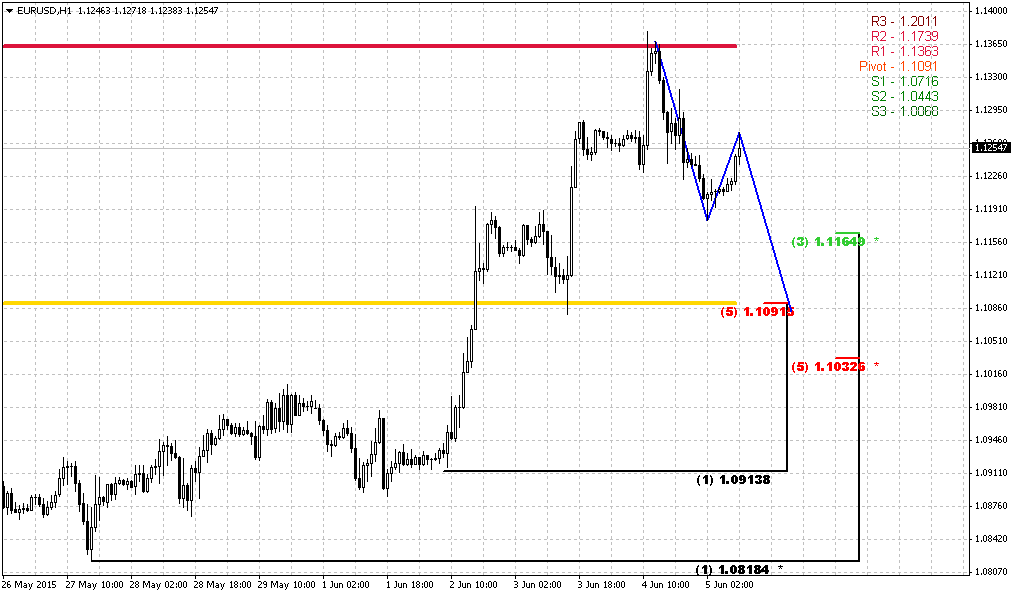
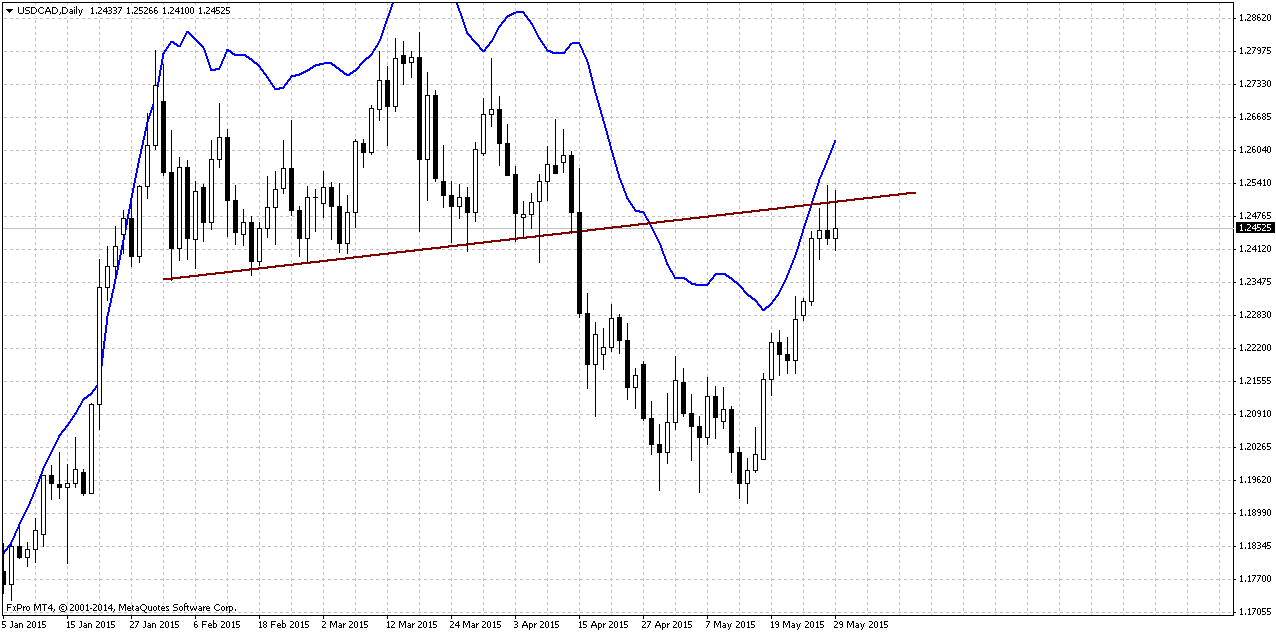
Daily
Trend is bullish here. Simple trend line is all that we need to understand the quality of recent upside action. But first, let’s understand the major difference between reversal and retracement. When market usually turns to retracement? Right, when it appears in “uncomfortable” situation – either at oversold/overbought or at some support/resistance. Hence, retracement happens when market technically feels some discomfort, while major sentiment supports existing direction. Now let’s take a look at CAD. Does it feel some discomfort as it was two weeks ago? Probably not – it is not at oversold anymore, and not at Fib support. Thus, currently CAD should not have any reasons for upside continuation from retracement point of view and should move down to complete DRPO target and form AB=CD pattern. By the way, this AB-CD has the same target as DRPO is.
CAD will protect DRPO top consolidation from market’s return back in there. This protection line is trend that we’ve drawn here. In fact CAD has no reasons to pass through it, but reversal. When sentiment is changing on the market, it becomes driving factor that breaks “sufficiency” of retracement conditions. As a result, the quality of upside action will change. And right now market stands at this point – the barrier between retracement and reversal. Hence, this is our clue. If market will continue upside action – we should be ready for gradual continuation to our major target on monthly chart, while failure at this trend line will launch downward AB-CD action.
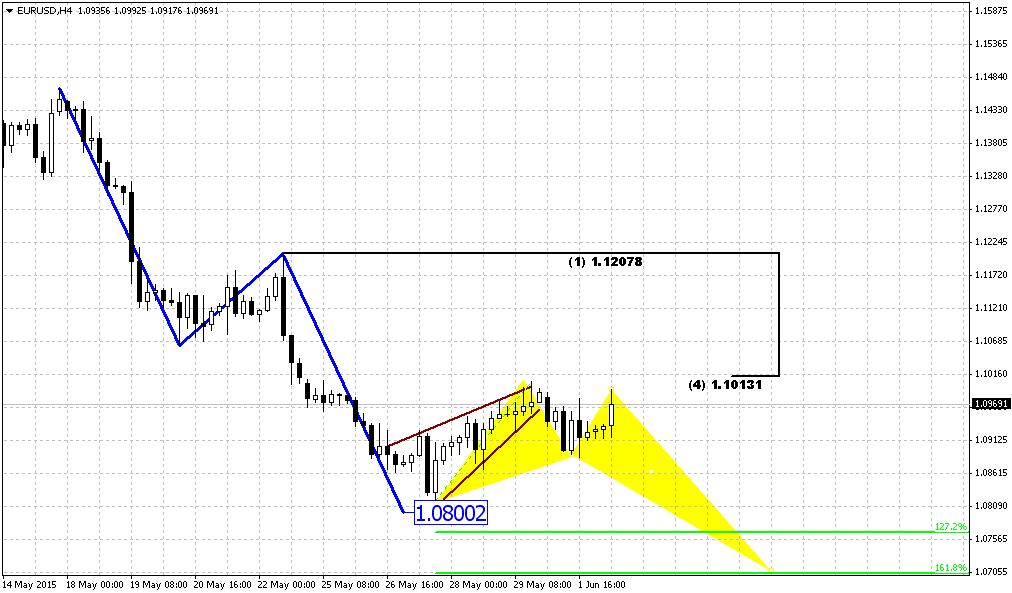
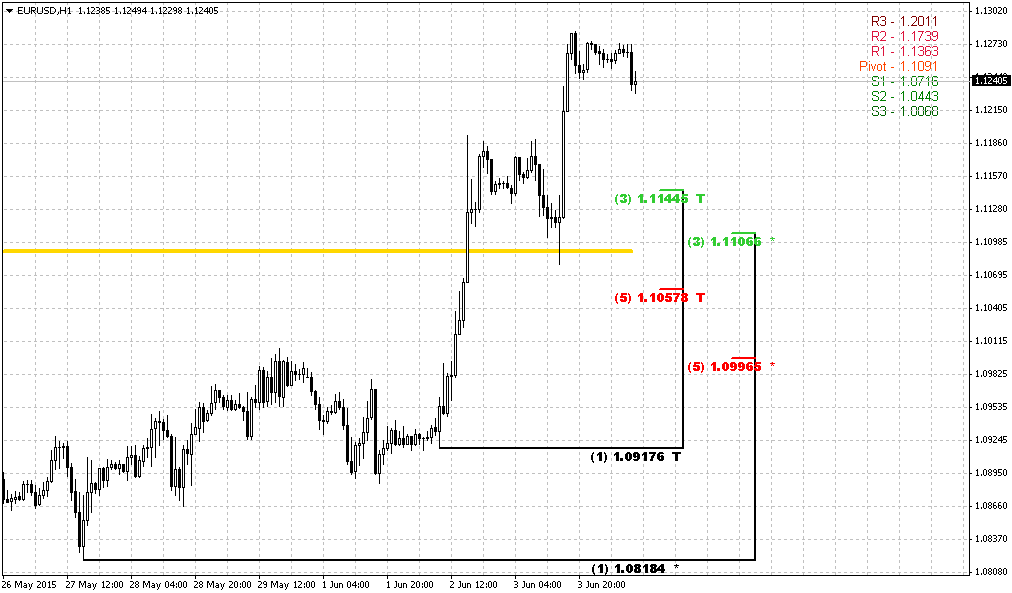
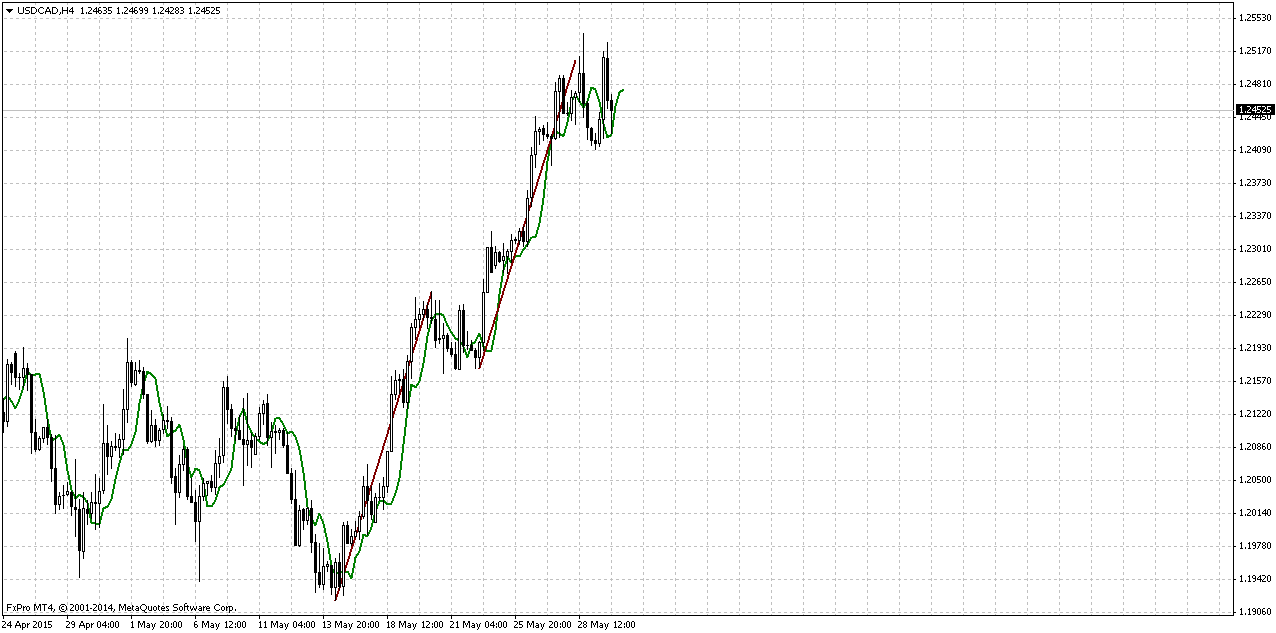
4-Hour
On 4-hour chart we do not have many signs yet. Trend is bearish here. All that we have is just steep AB-CD. This is poor AB-CD, of cause, since BC leg is too small, but this is all that will have right now. It is difficult to say what action we will get right at top, but overall dynamic could give us DRPO “Sell” pattern here. Thrust a bit choppy but no 3/8 retracement has happened during it develops.
Conclusion:
As CAD has completed respect of monthly resistance around 50% area, perspective of upside continuation has appeared again in long-term perspective. Our major target here stands at 5/8 Agreement level around 1.3470.
Meantime in short-term perspective, CFTC data, Oil prices rebounding tell that it is not impossible AB-CD action down before it will over and market turn finally upside. Thus, we have to closely watch for action around daily trend line that in fact, is an edge between both scenarios – upside continuation and deeper retracement.
The technical portion of Sive's analysis owes a great deal to Joe DiNapoli's methods, and uses a number of Joe's proprietary indicators. Please note that Sive's analysis is his own view of the market and is not endorsed by Joe DiNapoli or any related companies.
Reuters reports dollar was mixed on Friday with month-end selling after a recent rally, as traders saw little in weak first-quarter U.S. gross domestic product data to discourage bets the Federal Reserve will start raising interest rates in 2015.
"Underlying sentiment remains positive but the dollar is seeing some profit taking and month-end, book-balancing catch-up after its recent advance," said Joe Manimbo, senior market analyst at Western Union Business Solutions in Washington.
The U.S. government reported that the American economy contracted during January, February and March because of heavy snowfalls, a resurgent dollar and disruptions at West Coast ports.
The government slashed its gross domestic product estimate to show GDP shrinking at a 0.7 percent annual rate instead of the 0.2 percent growth pace it estimated last month.
Economists point to bad weather and other unusual circumstances in early 2015 and caution against reading too much into the slump, which could oblige Fed policymakers to delay ending an era of near-zero U.S. rates.
More recent data, particularly upbeat home sales, reinforced the view the economy was recovering from the weather-related problems and the Fed was still on track to raise rates.
"The GDP data was largely in line, slightly better than what the market expected," said Thierry Albert Wizman, global interest rates and currencies strategist at Macquarie Ltd in New York.
A spokesman for Greece's government said it intends to reach an agreement with lenders on a cash-for-reforms deal by Sunday, after euro zone officials suggested a deal was far from imminent.
Traders cited a warning from Japanese Finance Minister Taro Aso as a factor behind the dollar's move away from Thursday's high of 124.46 yen . That was a 12-1/2 year peak for the dollar which was last trading up 0.10 percent at 124.
CFTC data shows gradual contraction of short position all way CAD down and right now position has turned to net long rising $0.2bn to $0.6bn. Data shows that open interest also has increased, although its growth is not very significant. Overall long-to-short ratio stands around 55% and lets market to move in both directions. Still, shy increasing of long positions lets us to suggest that retracement on CAD could take last for some time yet.
Technicals
Monthly
We haven’t taken a look at CAD almost for 2 months and right now the first part of our former analysis has come to an end and we need to update our view. First, we remind you our previous thoughts. IT will help you to see whole picture.
CAD trend is bullish. We do not have any yearly pivots here because CAD has passed through all of them, even YPR2 at 1.23 area. Last time we’ve discussed big AB-CD pattern in progress that already has passed above 0.618 target and has major destination point at 1.3420 that creates Agreement with major Fib resistance. This pattern is still valid and stands as cornerstone of our analysis.
Last time the question was: “Whether market will continue higher or turn down right from here, since bearish positions on CAD were contracted significantly?
As market right now stands at 50% Fib level and has reached monthly overbought – this creates Stretch pattern and CAD almost whole month stands in tight range. All these moments lead us to conclusion that upward action probably should continue. Here are our arguments:
- Market has not reached major AB=CD target and odds suggest that market never shows reliable bearish reversal until this target will not be hit;
- We see acceleration candle that increase chances on upside continuation. It seems that market has stopped mostly due overbought and Fib resistance;
- Market stands very tight right under resistance and forms the shape of bullish flag.
All these moments point on doubts of possible downward reversal, especially taking into consideration CFTC data.”
Thus, previous analysis has led us to conclusion that market probably will show bounce down to respect resistance and overbought, but this should not be reversal, but retracement that was triggered by perfect weekly DRPO “Sell”. Now this setup has been finished. So, what’s next?
Market is not at overbought any more, but trend is still bullish here. If you will take a look at DOSC indicator you’ll see that it is coiling around zero. It means that Stretch pattern mostly has reached its target. Market was able to show retracement to the half of thrusting candle and this suggests possible further upside continuation as well as return back in the body of the flag pattern. So, monthly picture mostly stands in favor of upside continuation to our major long-term target 1.3470 – Agreement with major Fib resistance level.
But action could develop differently and our task here is to estimate how precisely it will happen, or at least, catch the markings that could help us identify one or another scenario.
Weekly
Weekly chart shows very important moment. Trend is bearish here. I do not have 3x3 DMA here, but you probably remember our perfect DRPO “Sell” pattern that we have traded since mid of March. But somehow this DRPO pattern has not reached its target, that is 50% Fib support of its thrust and it stands at 1.1726. But why it has happened? Mostly because CAD was strongly oversold during last 3 weeks and this oversold condition prevented downward continuation. Here I keep May pivots. You can see that DOSC stands near zero and market stopped upward action right at MPR1. And we now that if PR1 holds upside retracement then bearish trend is still valid. Now is right time to recall CFTC report – long positions on CAD slightly but has increased. It means that DRPO still could reach its target but this could happen if action will take a shape of AB-CD down. If this will happen at all, of cause.
So, currently the major riddle is what was recent two weeks upside action – retracement or reversal? It could easily be explained as retracements – CFTC, oversold, upside action was held by MPR1. That’s why DRPO has not quite reached its target. And where is the edge between reversal and retracement? Where it will stop to be just retracement? Let’s try to find out it below…
Daily
Trend is bullish here. Simple trend line is all that we need to understand the quality of recent upside action. But first, let’s understand the major difference between reversal and retracement. When market usually turns to retracement? Right, when it appears in “uncomfortable” situation – either at oversold/overbought or at some support/resistance. Hence, retracement happens when market technically feels some discomfort, while major sentiment supports existing direction. Now let’s take a look at CAD. Does it feel some discomfort as it was two weeks ago? Probably not – it is not at oversold anymore, and not at Fib support. Thus, currently CAD should not have any reasons for upside continuation from retracement point of view and should move down to complete DRPO target and form AB=CD pattern. By the way, this AB-CD has the same target as DRPO is.
CAD will protect DRPO top consolidation from market’s return back in there. This protection line is trend that we’ve drawn here. In fact CAD has no reasons to pass through it, but reversal. When sentiment is changing on the market, it becomes driving factor that breaks “sufficiency” of retracement conditions. As a result, the quality of upside action will change. And right now market stands at this point – the barrier between retracement and reversal. Hence, this is our clue. If market will continue upside action – we should be ready for gradual continuation to our major target on monthly chart, while failure at this trend line will launch downward AB-CD action.
4-Hour
On 4-hour chart we do not have many signs yet. Trend is bearish here. All that we have is just steep AB-CD. This is poor AB-CD, of cause, since BC leg is too small, but this is all that will have right now. It is difficult to say what action we will get right at top, but overall dynamic could give us DRPO “Sell” pattern here. Thrust a bit choppy but no 3/8 retracement has happened during it develops.
Conclusion:
As CAD has completed respect of monthly resistance around 50% area, perspective of upside continuation has appeared again in long-term perspective. Our major target here stands at 5/8 Agreement level around 1.3470.
Meantime in short-term perspective, CFTC data, Oil prices rebounding tell that it is not impossible AB-CD action down before it will over and market turn finally upside. Thus, we have to closely watch for action around daily trend line that in fact, is an edge between both scenarios – upside continuation and deeper retracement.
The technical portion of Sive's analysis owes a great deal to Joe DiNapoli's methods, and uses a number of Joe's proprietary indicators. Please note that Sive's analysis is his own view of the market and is not endorsed by Joe DiNapoli or any related companies.