Sive Morten
Special Consultant to the FPA
- Messages
- 18,699
Fundamentals
Reuters reports dollar rallied to a 13-year peak against the yen and rose sharply against the euro on Friday after data showing U.S. job growth accelerated in May, bolstering the case for a Federal Reserve interest rate hike as early as September.
Nonfarm payrolls increased 280,000 last month, the largest gain since December, the Labor Department said. Economists polled by Reuters had forecast payrolls rising 225,000.
The increase in average hourly earnings took the year-on-year gain to 2.3 percent, the largest rise since August 2013. The wage growth indicated that U.S. inflation was moving closer to the Fed's 2 percent target, analysts said.
After the release of the data, interest rate futures traders bet on a rate hike in October. A Reuters survey Friday, however, showed Wall Street's top banks expect the Fed to begin raising interest rates in September, followed by another before the end of the year.
"If (U.S. economic) growth looks okay, there will be enough evidence by September that the Fed wants to raise rates by then," said Jens Nordvig, global head of currency strategy at Nomura in New York, on the U.S. jobs data. He said the euro would hit $1.05 by September.
The dollar rose more than 1 percent against the euro, yen, and Swiss franc. The greenback hit 125.860 yen, its highest level in roughly 13 years. The euro hit a session low of $1.10490.
The dollar index, which measures the greenback against a basket of six major currencies, was still on track for its first weekly loss in three after the euro posted its biggest two-day gain against the greenback in six years earlier this week.
The increased expectations for a 2015 Fed rate hike boosted the dollar since rate increases are expected to lift the greenback by driving investment flows into the United States.
"The nonfarm payroll was a big reassurance today for the dollar, and for I think the view of the U.S. economy as a whole," said Joseph Trevisani, chief market strategist at WorldWideMarkets in Woodcliff Lake, New Jersey.
CFTC data shows Speculators boosted bullish bets on the U.S. dollar for a second straight week to the largest in more than a month, according to Reuters calculations and data from the Commodity Futures Trading Commission released on Friday. The value of the dollar's net long position rose to $34.15 billion in the week ended June 2, from $29.94 billion the previous week. It was the first time in four weeks that net dollar longs came in above $30 billion.
Although on previous week CAD had net long position for about 5K contracts, currently it’s position has changed the direction and shows 1025 contracts of net short. Data shows that speculators significantly have increased short positions. That in general supports an idea of upside continuation of USD/CAD rather than deeper retracement down that we’ve discussed recently. At the same time, reaction on positive NFP data was mild on Crude Oil prices and it even has risen slightly by the end of the session. That’s why we again will try to understand what will happen on CAD.

Technicals
Monthly
Last week we’ve continued CAD discussion. June candle is still rather small and does not change monthly picture. Thus, our thoughts on monthly chart mostly stand the same.
Here we remind you our previous thoughts. It will help you to see whole picture.
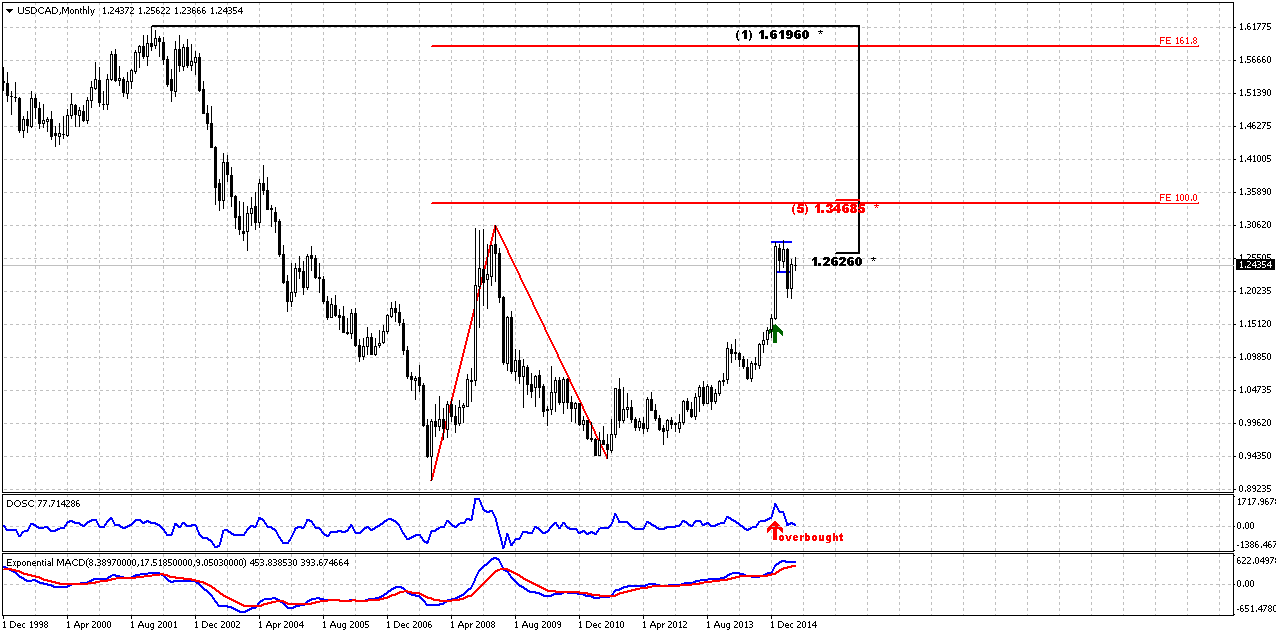
CAD trend is bullish. We do not have any yearly pivots here because CAD has passed through all of them, even YPR2 at 1.23 area. Last time we’ve discussed big AB-CD pattern in progress that already has passed above 0.618 target and has major destination point at 1.3420 that creates Agreement with major Fib resistance. This pattern is still valid and stands as cornerstone of our analysis.
Last time the question was: “Whether market will continue higher or turn down right from here, since bearish positions on CAD were contracted significantly?
As market right now stands at 50% Fib level and has reached monthly overbought – this creates Stretch pattern and CAD almost whole month stands in tight range. All these moments lead us to conclusion that upward action probably should continue. Here are our arguments:
- Market has not reached major AB=CD target and odds suggest that market never shows reliable bearish reversal until this target will not be hit;
- We see acceleration candle that increase chances on upside continuation. It seems that market has stopped mostly due overbought and Fib resistance;
- Market stands very tight right under resistance and forms the shape of bullish flag.
All these moments point on doubts of possible downward reversal, especially taking into consideration CFTC data.”
Thus, previous analysis has led us to conclusion that market probably will show bounce down to respect resistance and overbought, but this should not be reversal, but retracement that was triggered by perfect weekly DRPO “Sell”. Now this setup has been finished. So, what’s next?
Market is not at overbought any more, but trend is still bullish here. If you will take a look at DOSC indicator you’ll see that it is coiling around zero. It means that Stretch pattern mostly has reached its target and worked out. Market was able to show retracement to the half of thrusting candle and this suggests possible further upside continuation as well as return back in the body of the flag pattern. So, monthly picture mostly stands in favor of upside continuation in long-term perspective to our major long-term target 1.3470 – Agreement with major Fib resistance level.
Today the major question is - what about deeper downward retracement that we’ve discussed last week? Is this assumption still valid or not?
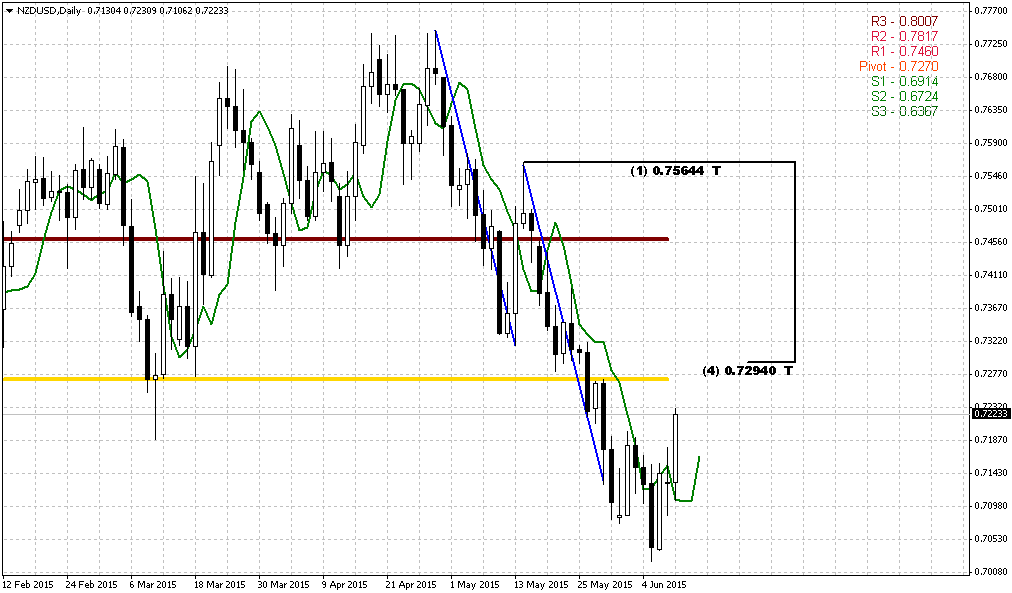
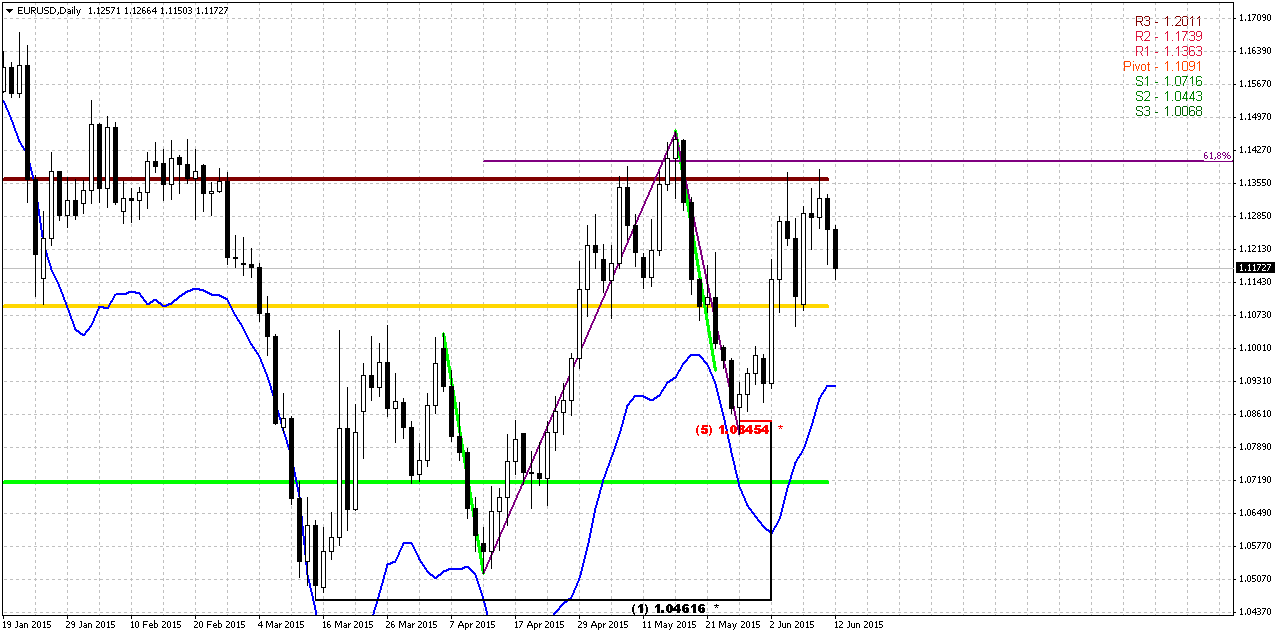
Weekly
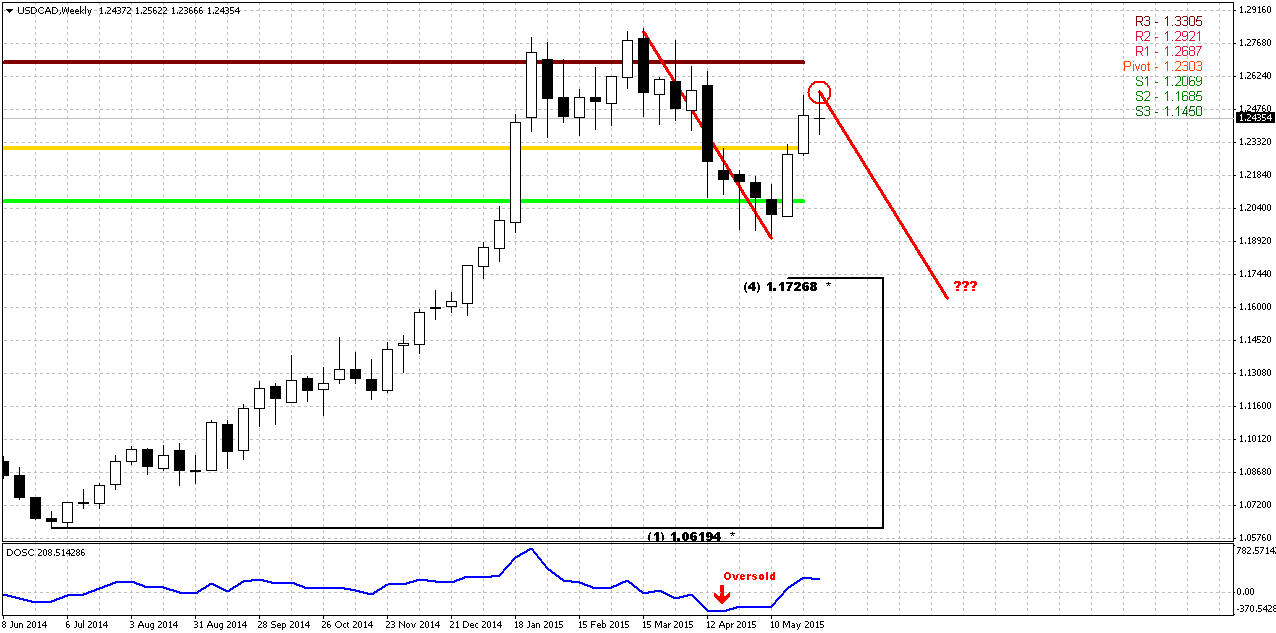
Last week mostly was flat action. CAD has formed indecision doji here but trend is still bearish here. I do not have 3x3 DMA here, but you probably remember our perfect DRPO “Sell” pattern that we have traded since mid of March. But somehow this DRPO pattern has not reached its target, that is 50% Fib support of its thrust and it stands at 1.1726. But why it has happened? Mostly because CAD was strongly oversold during last 3 weeks around MPS1 and this oversold condition prevented downward continuation. You can see that DOSC stands near zero and market stopped upward action last week right at May MPR1. And we know that if PR1 holds upside retracement then bearish trend is still valid. Although CFTC data shows some increasing of short positions, but CAD, as well as Crude Oil have not shown any solid reaction on NFP data. In fact, reaction was mostly opposite. It means that DRPO still could reach its target but this could happen if action will take a shape of AB-CD down. This part of analysis still stands valid.
So, currently the major riddle is what was recent two weeks upside action – retracement or reversal? It could easily be explained as retracements – CFTC, oversold, upside action was held by MPR1. That’s why DRPO has not quite reached its target. And where is the edge between reversal and retracement? Where it will stop to be just retracement? Let’s try to find out it below…
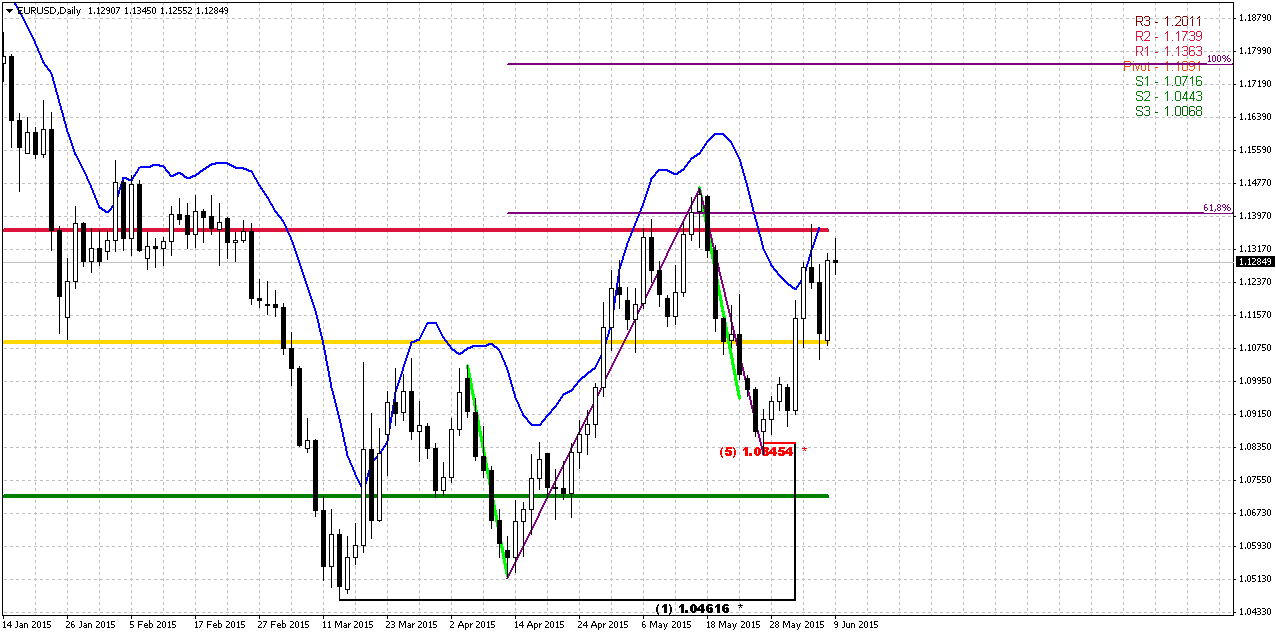
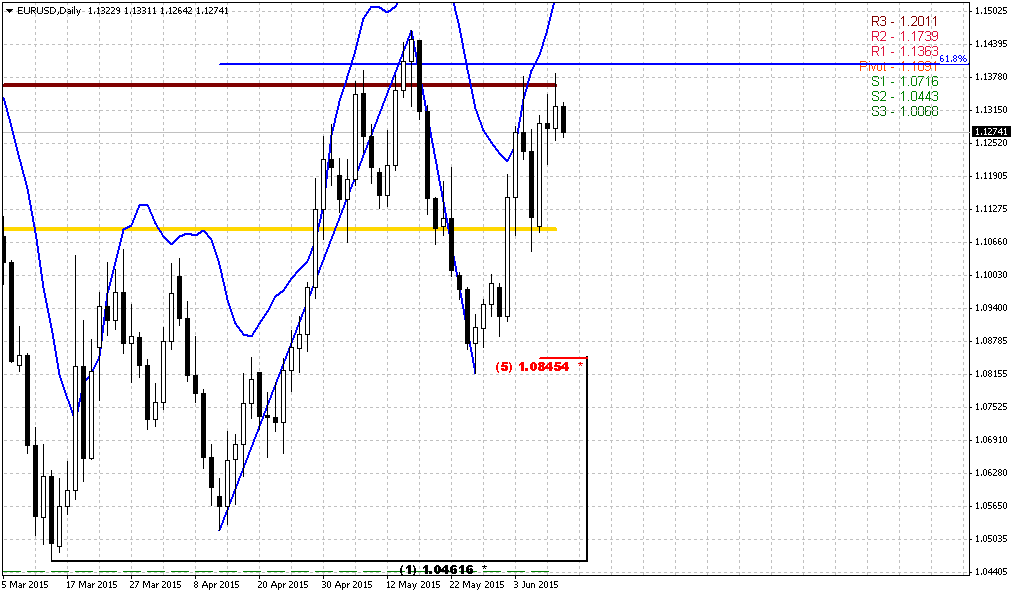
Daily
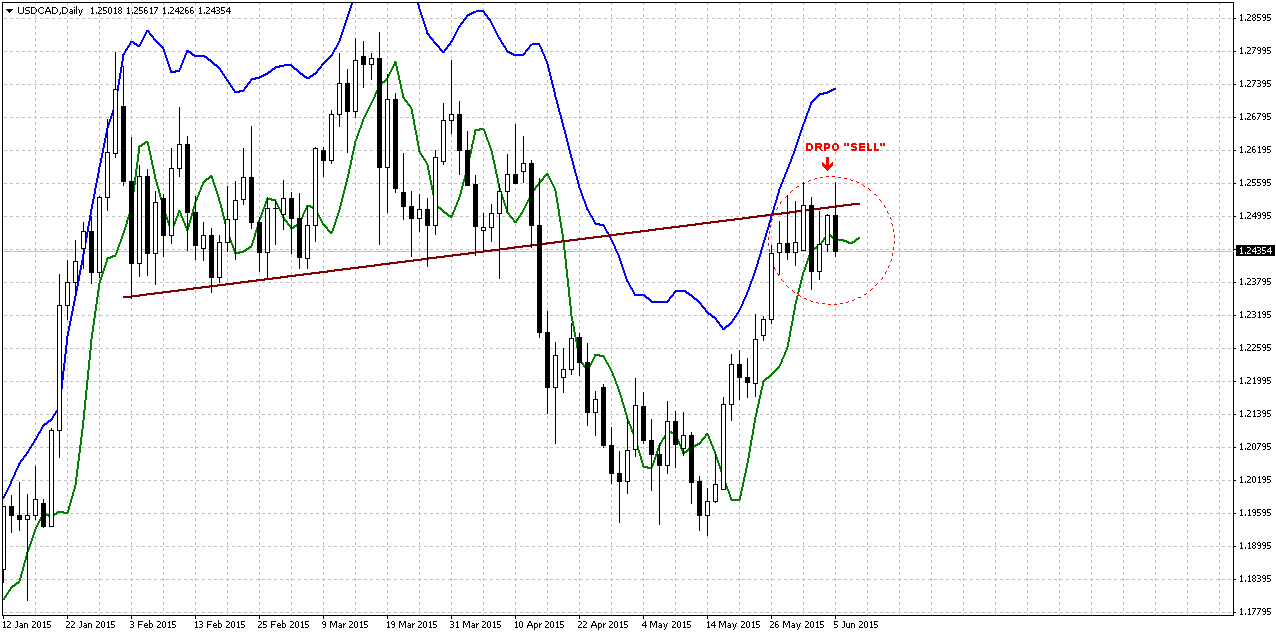
Trend is bullish here. As we’ve said on previous week - Simple trend line is all that we need to understand the quality of recent upside action. But first, let’s understand the major difference between reversal and retracement. When market usually turns to retracement? Right, when it appears in “uncomfortable” situation – either at oversold/overbought or at some support/resistance. Hence, retracement happens when market technically feels some discomfort, while major sentiment supports existing direction. Now let’s take a look at CAD. Does it feel some discomfort as it was two weeks ago? Probably not – it is not at oversold anymore, and not at Fib support. Thus, currently CAD should not have any reasons for upside continuation from retracement point of view and should move down to complete DRPO target and form AB=CD pattern. By the way, this AB-CD has the same target as DRPO is.
CAD will protect weekly DRPO top consolidation from market’s return back in there. This protection line is trend that we’ve drawn here. In fact CAD has no reasons to pass through it, but reversal. When sentiment is changing on the market, it becomes driving factor that breaks “sufficiency” of retracement conditions. As a result, the quality of upside action will change. And right now market stands at this point – the barrier between retracement and reversal. Hence, this is our clue. If market will continue upside action – we should be ready for gradual continuation to our major target on monthly chart, while failure at this trend line will launch downward AB-CD action.
Right now we have another indicator here that is DRPO “Sell” pattern. Theoretically we should say that this significantly increases chances of weekly downward AB=CD, but as DRPO fails very often, we better would say that this will be some kind of indicator. DRPO failure – will trigger upside continuation, while it’s correct functioning will completed weekly AB=CD down.
Still, taking into consideration that bearish DPRO is formed simultaneously with bullish NFP release significantly increases chances on downward USD/CAD action and correct direction of DRPO “Sell” pattern.
It’s needless to say that this pattern is suitable for trading per se, even those traders who do not treat it as a part of higher time frame analysis.
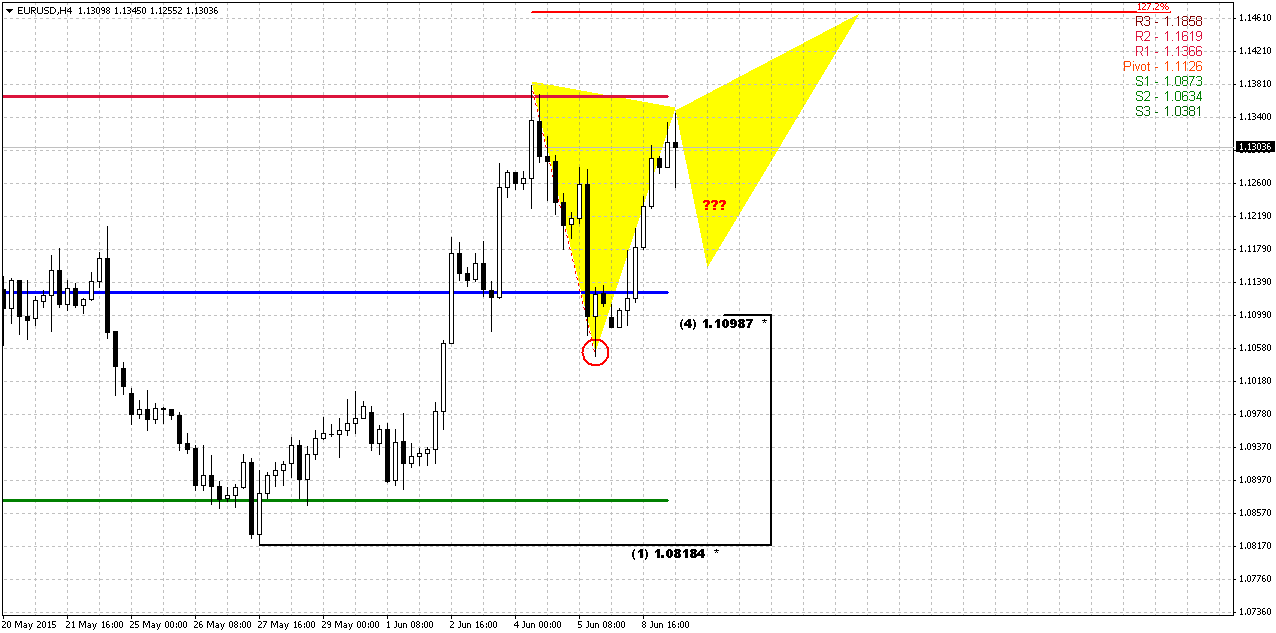
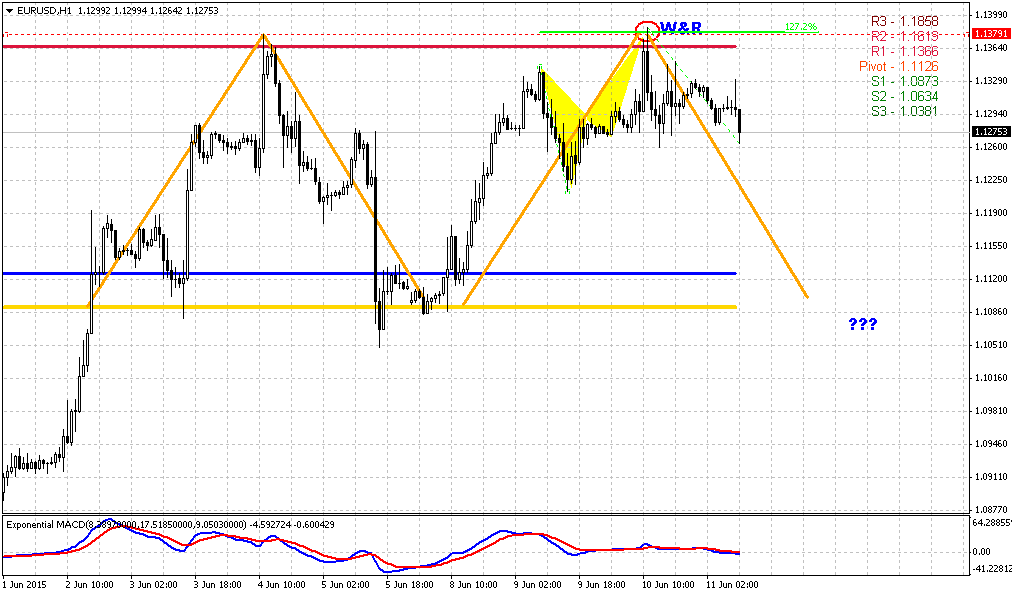
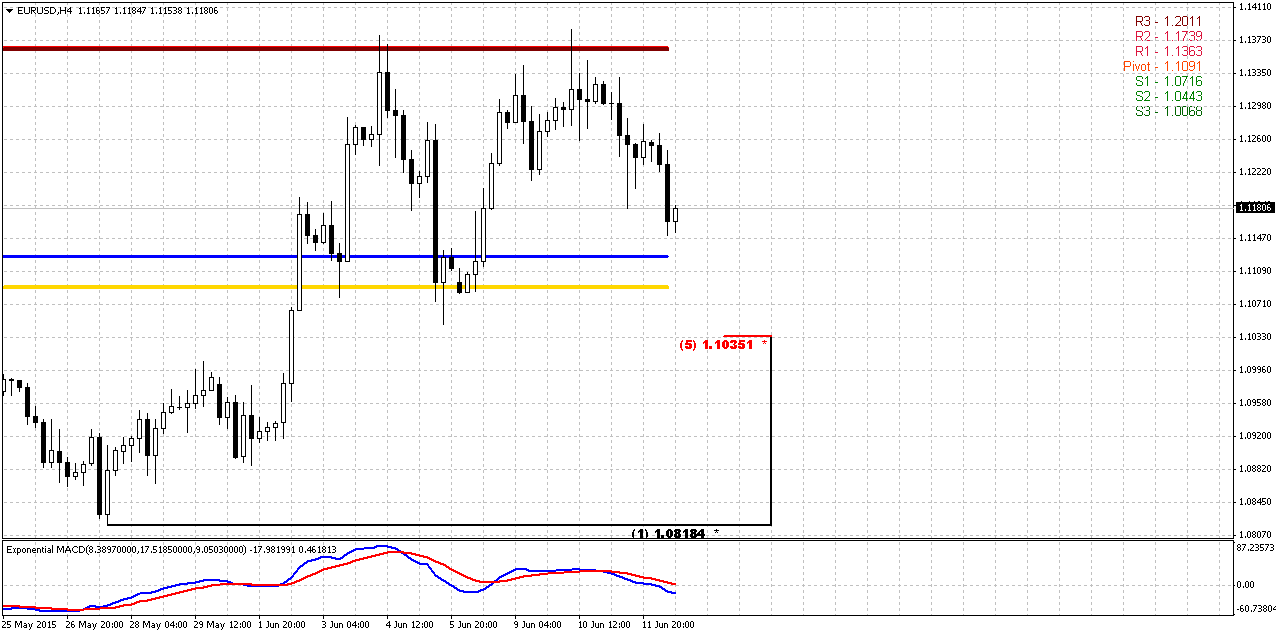
4-Hour
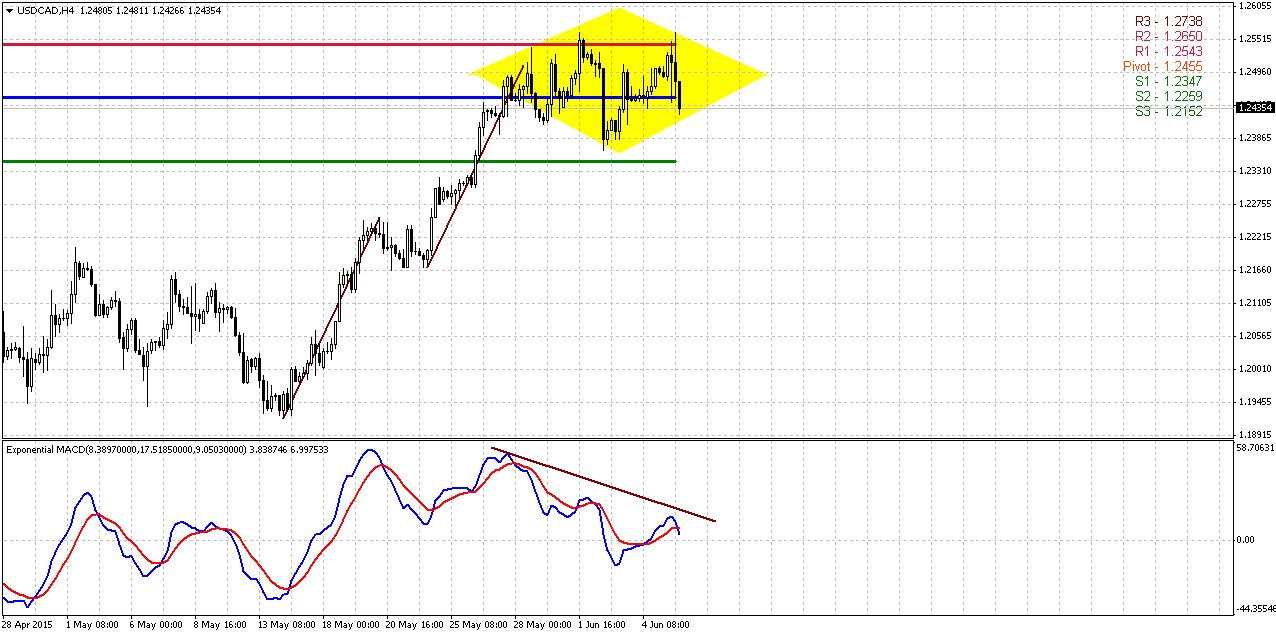
I hope, guys, you will forgive me my weakness, but I like how diamond pattern looks. This is rather rare pattern, and it fails even often than works, but looks cool (lol). Besides, currently I can’t recognize here, at top, anything else, and in general in corresponds other patterns that are formed right here.
Also guys, we have bearish divergence right at very important resistance and trend line on daily chart. Anyway this gathering of different patterns is called for resolving major riddle – direction. Failure of these patterns will lead to upside continuation, while if they will work properly we will get finalizing weekly DRPO “Sell” at 1.1730 area.
Conclusion:
As CAD has completed respect of monthly resistance around 50% area, perspective of upside continuation has appeared again in long-term perspective. Our major target here stands at 5/8 Agreement level around 1.3470.
Meantime in short-term perspective, CFTC data, Oil prices rebounding tell that it is not impossible AB-CD action down before it will over and market turn finally upside. Thus, we have to closely watch for action around daily trend line that in fact, is an edge between both scenarios – upside continuation and deeper retracement. Our additional pattern that should provide more assistance is DRPO “Sell” on daily chart right below key trend line.
The technical portion of Sive's analysis owes a great deal to Joe DiNapoli's methods, and uses a number of Joe's proprietary indicators. Please note that Sive's analysis is his own view of the market and is not endorsed by Joe DiNapoli or any related companies.
Reuters reports dollar rallied to a 13-year peak against the yen and rose sharply against the euro on Friday after data showing U.S. job growth accelerated in May, bolstering the case for a Federal Reserve interest rate hike as early as September.
Nonfarm payrolls increased 280,000 last month, the largest gain since December, the Labor Department said. Economists polled by Reuters had forecast payrolls rising 225,000.
The increase in average hourly earnings took the year-on-year gain to 2.3 percent, the largest rise since August 2013. The wage growth indicated that U.S. inflation was moving closer to the Fed's 2 percent target, analysts said.
After the release of the data, interest rate futures traders bet on a rate hike in October. A Reuters survey Friday, however, showed Wall Street's top banks expect the Fed to begin raising interest rates in September, followed by another before the end of the year.
"If (U.S. economic) growth looks okay, there will be enough evidence by September that the Fed wants to raise rates by then," said Jens Nordvig, global head of currency strategy at Nomura in New York, on the U.S. jobs data. He said the euro would hit $1.05 by September.
The dollar rose more than 1 percent against the euro, yen, and Swiss franc. The greenback hit 125.860 yen, its highest level in roughly 13 years. The euro hit a session low of $1.10490.
The dollar index, which measures the greenback against a basket of six major currencies, was still on track for its first weekly loss in three after the euro posted its biggest two-day gain against the greenback in six years earlier this week.
The increased expectations for a 2015 Fed rate hike boosted the dollar since rate increases are expected to lift the greenback by driving investment flows into the United States.
"The nonfarm payroll was a big reassurance today for the dollar, and for I think the view of the U.S. economy as a whole," said Joseph Trevisani, chief market strategist at WorldWideMarkets in Woodcliff Lake, New Jersey.
CFTC data shows Speculators boosted bullish bets on the U.S. dollar for a second straight week to the largest in more than a month, according to Reuters calculations and data from the Commodity Futures Trading Commission released on Friday. The value of the dollar's net long position rose to $34.15 billion in the week ended June 2, from $29.94 billion the previous week. It was the first time in four weeks that net dollar longs came in above $30 billion.
Although on previous week CAD had net long position for about 5K contracts, currently it’s position has changed the direction and shows 1025 contracts of net short. Data shows that speculators significantly have increased short positions. That in general supports an idea of upside continuation of USD/CAD rather than deeper retracement down that we’ve discussed recently. At the same time, reaction on positive NFP data was mild on Crude Oil prices and it even has risen slightly by the end of the session. That’s why we again will try to understand what will happen on CAD.
Technicals
Monthly
Last week we’ve continued CAD discussion. June candle is still rather small and does not change monthly picture. Thus, our thoughts on monthly chart mostly stand the same.
Here we remind you our previous thoughts. It will help you to see whole picture.
CAD trend is bullish. We do not have any yearly pivots here because CAD has passed through all of them, even YPR2 at 1.23 area. Last time we’ve discussed big AB-CD pattern in progress that already has passed above 0.618 target and has major destination point at 1.3420 that creates Agreement with major Fib resistance. This pattern is still valid and stands as cornerstone of our analysis.
Last time the question was: “Whether market will continue higher or turn down right from here, since bearish positions on CAD were contracted significantly?
As market right now stands at 50% Fib level and has reached monthly overbought – this creates Stretch pattern and CAD almost whole month stands in tight range. All these moments lead us to conclusion that upward action probably should continue. Here are our arguments:
- Market has not reached major AB=CD target and odds suggest that market never shows reliable bearish reversal until this target will not be hit;
- We see acceleration candle that increase chances on upside continuation. It seems that market has stopped mostly due overbought and Fib resistance;
- Market stands very tight right under resistance and forms the shape of bullish flag.
All these moments point on doubts of possible downward reversal, especially taking into consideration CFTC data.”
Thus, previous analysis has led us to conclusion that market probably will show bounce down to respect resistance and overbought, but this should not be reversal, but retracement that was triggered by perfect weekly DRPO “Sell”. Now this setup has been finished. So, what’s next?
Market is not at overbought any more, but trend is still bullish here. If you will take a look at DOSC indicator you’ll see that it is coiling around zero. It means that Stretch pattern mostly has reached its target and worked out. Market was able to show retracement to the half of thrusting candle and this suggests possible further upside continuation as well as return back in the body of the flag pattern. So, monthly picture mostly stands in favor of upside continuation in long-term perspective to our major long-term target 1.3470 – Agreement with major Fib resistance level.
Today the major question is - what about deeper downward retracement that we’ve discussed last week? Is this assumption still valid or not?
Weekly
Last week mostly was flat action. CAD has formed indecision doji here but trend is still bearish here. I do not have 3x3 DMA here, but you probably remember our perfect DRPO “Sell” pattern that we have traded since mid of March. But somehow this DRPO pattern has not reached its target, that is 50% Fib support of its thrust and it stands at 1.1726. But why it has happened? Mostly because CAD was strongly oversold during last 3 weeks around MPS1 and this oversold condition prevented downward continuation. You can see that DOSC stands near zero and market stopped upward action last week right at May MPR1. And we know that if PR1 holds upside retracement then bearish trend is still valid. Although CFTC data shows some increasing of short positions, but CAD, as well as Crude Oil have not shown any solid reaction on NFP data. In fact, reaction was mostly opposite. It means that DRPO still could reach its target but this could happen if action will take a shape of AB-CD down. This part of analysis still stands valid.
So, currently the major riddle is what was recent two weeks upside action – retracement or reversal? It could easily be explained as retracements – CFTC, oversold, upside action was held by MPR1. That’s why DRPO has not quite reached its target. And where is the edge between reversal and retracement? Where it will stop to be just retracement? Let’s try to find out it below…
Daily
Trend is bullish here. As we’ve said on previous week - Simple trend line is all that we need to understand the quality of recent upside action. But first, let’s understand the major difference between reversal and retracement. When market usually turns to retracement? Right, when it appears in “uncomfortable” situation – either at oversold/overbought or at some support/resistance. Hence, retracement happens when market technically feels some discomfort, while major sentiment supports existing direction. Now let’s take a look at CAD. Does it feel some discomfort as it was two weeks ago? Probably not – it is not at oversold anymore, and not at Fib support. Thus, currently CAD should not have any reasons for upside continuation from retracement point of view and should move down to complete DRPO target and form AB=CD pattern. By the way, this AB-CD has the same target as DRPO is.
CAD will protect weekly DRPO top consolidation from market’s return back in there. This protection line is trend that we’ve drawn here. In fact CAD has no reasons to pass through it, but reversal. When sentiment is changing on the market, it becomes driving factor that breaks “sufficiency” of retracement conditions. As a result, the quality of upside action will change. And right now market stands at this point – the barrier between retracement and reversal. Hence, this is our clue. If market will continue upside action – we should be ready for gradual continuation to our major target on monthly chart, while failure at this trend line will launch downward AB-CD action.
Right now we have another indicator here that is DRPO “Sell” pattern. Theoretically we should say that this significantly increases chances of weekly downward AB=CD, but as DRPO fails very often, we better would say that this will be some kind of indicator. DRPO failure – will trigger upside continuation, while it’s correct functioning will completed weekly AB=CD down.
Still, taking into consideration that bearish DPRO is formed simultaneously with bullish NFP release significantly increases chances on downward USD/CAD action and correct direction of DRPO “Sell” pattern.
It’s needless to say that this pattern is suitable for trading per se, even those traders who do not treat it as a part of higher time frame analysis.
4-Hour
I hope, guys, you will forgive me my weakness, but I like how diamond pattern looks. This is rather rare pattern, and it fails even often than works, but looks cool (lol). Besides, currently I can’t recognize here, at top, anything else, and in general in corresponds other patterns that are formed right here.
Also guys, we have bearish divergence right at very important resistance and trend line on daily chart. Anyway this gathering of different patterns is called for resolving major riddle – direction. Failure of these patterns will lead to upside continuation, while if they will work properly we will get finalizing weekly DRPO “Sell” at 1.1730 area.
Conclusion:
As CAD has completed respect of monthly resistance around 50% area, perspective of upside continuation has appeared again in long-term perspective. Our major target here stands at 5/8 Agreement level around 1.3470.
Meantime in short-term perspective, CFTC data, Oil prices rebounding tell that it is not impossible AB-CD action down before it will over and market turn finally upside. Thus, we have to closely watch for action around daily trend line that in fact, is an edge between both scenarios – upside continuation and deeper retracement. Our additional pattern that should provide more assistance is DRPO “Sell” on daily chart right below key trend line.
The technical portion of Sive's analysis owes a great deal to Joe DiNapoli's methods, and uses a number of Joe's proprietary indicators. Please note that Sive's analysis is his own view of the market and is not endorsed by Joe DiNapoli or any related companies.

")
