FOREX PRO Weekly June 13 - 17, 2011

hi Sive , as always thanks for your free time .....a general question .....the forward market is currently around 30/35 pips lower than the spot market i think ? so just to be clear ...we need to add on that sort of difference to get a true reading of your calculations and level and charts , is this correct please ?

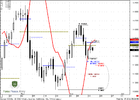
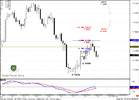
If you draw the areas corresponding to the same timing on your chart you should be able to have it right there for you.

Hi Dharma,
Joshnix is right, think about my charts in terms of areas, that I've marked rather than quotes.
This is not correct to add just fix number of pips, because it becomes lower when contract comes closer to expiration In fact, futures price lower due difference in % rates between EUR and USD till the expiration date (~3 month). Since time reduce till expiration, this difference also will become less.
 
Sive before you break today we have broken out to the area of 1.4443 on the 6e. When do we talk about the upside possibility or take profit possibility? I would like to hold but not as I currently see a possible MACDP failure today and after that a 3x3 DMA failure as well
 
Pattern ??

Hi Sive

did you see the market try to make a butterfly pattern on 1H chart? Or gartley pattern on 4h chart. ??

-Thank you-
 
EUR/USD Daily Update, Wed 15, June 2011

Good morning,
Situation on EUR currently is a bit blur. But this confusion not on daily time frame.

On daily probably we will see Gartley "222" to 1.42. That will not break our medium term expectation of Butterfly pattern.

The major confusion is on intraday charts. From the one point of view, we have Daily B&B with target at 1.4510 roughly. Hence, to reach it, market should show AB=CD on 4-hour chart - current leg down could appear to be just BC move
From the other point of view - market has failed at weekly pivot yesterday, daily trend has turned bearish and market could show AB-CD down on hourly chart.

To resolve these contradictive points we need clear signals around support areas on 5-15 min charts. For instance, if now around 0.618 support on hourly we will see 5-15 min Butterfly Buy - we can enter with tight stop and this tells us, that probably we will see 1.4510.
But until that will happen better to stay flat. Personally, I will not enter in any side till not see some clear pattern, that will allow me to do that.
 

Attachments

  • EUR_D_15_06_11.PNG
    EUR_D_15_06_11.PNG
    45.4 KB · Views: 138
  • EUR_4H_15_06_11.PNG
    EUR_4H_15_06_11.PNG
    40.5 KB · Views: 141
  • EUR_1H_15_06_11.PNG
    EUR_1H_15_06_11.PNG
    44.2 KB · Views: 139
5-min Butterfly "Buy"

Let's see, what will happen...
 

Attachments

  • EUR_5m_15_06_11.PNG
    EUR_5m_15_06_11.PNG
    36.2 KB · Views: 131
Hi Sive
Good morning, maybe we could return into plan your initial on monday ??

Hi Jimmy,
We will (in general we are not stepped out from it), but we need confirmation of further downmove and that it will not turn to upward AB=CD. Since Butterfly has failed, now odds have turned to downward move...
 
weekly pivot calc

Hi Sive thanks again for the great job you do,i am comparing my own analysis to yours on a daily basis and i am learning a lot every day,i don't know if i am using the wrong weekly pivot indicator but it does not compare to yours exactly what is the correct calculation.
Thanks
 
Back
Top