Hi Sipi,
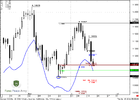
looks like it has failed already ...
Yes, I see now, so I keep my short.
Thanks for your reply, and kind help!
----------------------------------------------
Another question:
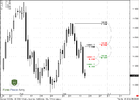
Last week You show us a butterfly pattern on daily chart. As I remember it's right wing bottom is about 1,41, and it's target is ~1,52.
The price looks like building this pattern.
Could it still work, or there are any rules, that cancalled this idea?
Last edited:
")