Sive Morten
Special Consultant to the FPA
- Messages
- 18,669
Fundamentals
Within long period we've pointed that EU has fundamental problems that make difficult to talk and count on positive change in fiscal policy and discussed all major points of our view. We can't see any fundamental factors that could make EUR stronger right now. This is major reason why we keep our long-term bearish view on EUR and do not suggest that it could reverse tendency in 2019 or even in 2020 either.
This Thursday we've got official confirmation of our position from ECB as it has made dovish its look on EU economy in general and interest rates in particular.
As Reuters reports - the euro wallowed close to a 21-month low against the dollar on Friday, hurt by a series of dovish signals from the European Central Bank. The euro’s big hit on Thursday came as the ECB pushed back the timing of its first post-crisis interest rate hike to 2020, cut its economic forecasts and launched a new round of cheap bank loans.
The euro slid along with euro zone yields, with the 10-year German bund yield declining to its lowest since October 2016 following Thursday’s ECB meeting.
The ECB’s decision to tweak its forward guidance on rates was a surprise for many investors. The central bank also cut its growth and inflation forecasts through 2021.
“Whilst such an announcement was expected at some point in the coming years, the market is welcoming this proactivity,” said Karen Ward, chief market strategist for EMEA at JP Morgan Asset Management, referring to the ECB moves.
Investors have been hoping for a trigger to shake the euro/dollar out of its current narrow trading range.
The currency pair has experienced a quiet start to 2019 as central banks have put off tightening monetary policy as economic momentum slows. That has left investors struggling to decide on direction.
Thu Lan Nguyen, a currencies analyst at Commerzbank, said before the ECB announcement that should the central bank tweak its guidance then the risks for the euro were “to the downside.”
“The ECB has no choice,” said Joseph Trevisani, senior analyst at FX Street in New York. “There are a lot of internal problems which are impediments to growth.”
Anemic domestic demand and political tensions will unlikely be resolved by an easy ECB policy stance and would keep downward pressure on the euro, analysts said.
Currencies of European countries not part of the euro zone, such as the Swedish crown and Hungarian forint, fell hard after the ECB’s decision, which is aimed at battling deteriorating regional business and consumer activities, analysts said.
The single currency recorded its biggest one-day loss against the greenback since June 14, 2018 when the ECB pushed back plans for a rate hike into the summer of 2019.
The euro is at risk of falling to $1.10 in the coming weeks, analysts said.
On the other hand, the greenback reached a new 2019 high against a basket of currencies that includes the euro as traders bet the United States would fare better than Europe in the coming months despite some soft patches in the U.S. economy.
At the same time, the dollar should slip over the coming year because U.S. economic growth is slowing and any boost from a resolution in the U.S.-China trade conflict is already priced in, according to a Reuters poll of strategists.
On Friday, the dollar fell against most major currencies as data showed U.S. employers hired far fewer workers than forecast in February.
Measly 20,000-job increase in domestic payrolls last month, far fewer than 180,000 forecast among analysts polled by Reuters. But traders were encouraged by the unemployment rate falling back below 4 percent and average hourly earnings accelerating by 0.4 percent.
“The dollar sold off mildly. It doesn’t look that bad when you look at the details,” said Peter Ng, senior currency trader at Silicon Valley Bank in Santa Clara, California.
As we've talked previously, guys - job market in US is highly saturated already and it is almost no free space there. So, the drop in NFP numbers doesn't mean that US economy has some problems. The major indicators on economy here is wage inflation and unemployment rate. Both indicators shows improvement.
It means that Friday sell-off on Dollar was temporal, but impact of earnings inflation has to provide long-lasting effect, accompanied by recent ECB statement. Mostly because it puts foundation of possible rate increase by Fed in summer. This is another our "hidden" factor that we count on but which widely ignored by
the market and barely priced-in right now in EUR/USD rate.
That's being said we have bearish fundamental background for coming week and probably for following few weeks as well. It makes possible downside continuation on EUR.
COT report shows that net speculative position has become a bit more bearish as traders added net ~4K shorts:

source: cftc.gov
Charting by Investing.com
Next topic that was a bit muted recently as investors were shocked by ECB statement - is Brexit. Silently but end of March is coming and chances on hard Brexit are increasing.
Recent Fathom Consulting report tells that Brexit uncertainty hurts business climate in UK.
Fathom’s UK Economic Sentiment Indicator fell to 0.2% in January, driven primarily by weaker business confidence, with measures of consumer confidence largely unchanged on the month. Aside from the period immediately following the EU referendum, the latest reading is the weakest since early 2013, when the UK economy was on the verge of a double-dip recession. Continued uncertainty over both the nature and timing of the UK’s departure from the EU has had measurable consequences for economic activity. Based on a statistical model estimated up to 2016 Q2, our analysis suggests the level of UK business investment during the final quarter of last year was some 10% lower than it ought to have been given the evolution of the marginal product of capital, and the real cost of finance. One interpretation is that this shortfall represents the impact of heightened economic uncertainty following the June 2016 vote – and if it does, then it is broadly equivalent to a 300 basis point increase in the risk premium. Except in the event that the UK leaves the EU on 29 March with no deal, there may be little clarity regarding the nature of the UK’s trading relationship with the rest of the union for some years to come.

This is serious statement, guys. I'm not brainly analyst and can't operate freely by all kind of fundamental statistics to provide proving of my personal view. But I try to use simple conclusions, based on common sense. UK economy mostly is based on colonialist type of economy. This is just as historically happens. UK major advantage and source of income is based not on heavy industries and production but on developed financial and insurance systems that provides services in global banking and finance systems. UK needs big money flows and turnover through its banking system.
Brexit (especially in hard way), accompanied by big political and economy scandals trigger process of narrowing of financial cash flows with UK banking and insurance system and historical ally with US keeps UK out from big shifts in global trade. EU now сrack markets of Russia by building common economic space, Middle East, Iran in particular, have good chances to enter Latin America and Venezuela, avoiding tough talks and blind support of US "democracy" policy across the globe, Africa through mediation of Russia and China. UK is deprived all of this and on the eve of breaking relation with closest neighbor.
IMO guys, it will be much worse very soon and GBP turns to nose dip... I will not be surprised by parity within 1-2 years with USD... It makes me wait for acceleration of long-term bearish trend on GBP/USD pair in nearest 1-2 months.
Technicals
Monthly
Monthly time frame usually is driven by long-term economic or political process, but not short-term technical fluctuations. Our long-term view we've put above, so here, on monthly chart we tilt toward idea of re-establishing downside trend. Here is drop to 1.12 area looks small, but as we've said above, big fundamental factors stand beyond it and this is just a beginning, I suppose.
In general our analysis here still stands the same. We mostly wait for clarity - either downside breakout and start action to 1.08 and later to 1.03 or ability of the EUR to hold above 1.12 and turning up. Market stands at support area around major 5/8 Fib level. In case of upside action, YPP will be important target , because, as a rule, market tends to touch YPP through the year. But after recent events chances on rally stand phantom.
As Fathom consulting expects first rate change by Fed in June, but market is not ready for this step (as wee see from Fed watch tool by CME) - this is the first moment when EUR could show big action. By our view this should happen somewhere in summer.
As we said this many times previously - indirect technical factors point on market's weakness, at least in long-term perspectives, as EUR can't jump out from strong support within more than 5-6 months and just lays upon it. Trend stands bearish here.
Monthly situation shortly could be described as indecision with light gravitation to the downside. In fact, long standing around Yearly Pivot confirms things that we've discussed above. MACD trend stands bearish here.
Thus we keep valid our downside COP target around 1.03 by far.
Just by using of common sense, guys, in nowadays it is difficult to expect something positive as in global economy as in politics. Hence, any bad new triggers demand for safe haven assets and US dollar. Just by this simple logic odds stand in favor of downside trend rather than sharp upside reversal.
So, although on technical picture we see just light and indirect signs of EUR weakness, political background stands negative. This is the major reason why I do not believe in resurrection of bull trend on EUR in this year.

Weekly
This is most difficult chart for understanding guys. If we follow the process of its creating it is seemed like first part is formed on expectation of upside continuation while second part is on destruction of this hope.
Indeed, potentially we have bullish story - rally and long-term bullish wedge with slow down of downside action around major 5/8 Fib support. It is easy to imagine second leg of upside rally.
But until now, this picture was forming on different background - Brexit was far in the future, investors were waiting for closing of ECB QE programme. EU sentiment and economy statistics was positive. But we have absolutely different background right now.
Despite that we have bullish MACD divergence, recent action start to remind bearish dynamic pressure while upside pullbacks from trend line become smaller.
It means that market stands at the moment of truth. Downside breakout, if it will happen - will be fast, as it usually happens with opposite wedge breakouts. In current circumstance it is very dangerous to follow bullish signs here.
The compromise here is to not ignore bullish setups on daily chart, as we still stand at major weekly support, but not to count on extended upside targets.

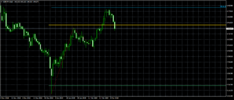
Daily
On daily chart we follow short-term technical setup. Due ECB statement market is overextended down and needs some technical relief. As we've mentioned yesterday, we have bullish Stretch pattern here by DiNapoli framework. As a result, upside pullback has happened, triggered by NFP data.
Drop on Thursday was really fast. Although Stretch still has some more upside potential - DOSC has not reached "0" area yet, but overall situation doesn't encourage to go long here.
If we take a look at more extended picture, we could recognize butterfly with ~1.1120 target. Downside harmonic swing also points at this area. This action doesn't break weekly Fib support as it is long-term and wide, mostly represents and area of 1.11-1.12. If still we will get any upside reaction on weekly Fib level, it could be triggered by this butterfly pattern.

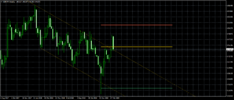
Intraday
As we're mostly focused on 1.1120-1.1130 area - we should keep an eye on bearish continuation patterns. First one is "222" sell, that we've discussed yesterday. EUR has shown healthy upside retracement and if we will get AB=CD action, "222" could start somewhere around K-resistance on 4H chart.
Another pattern is butterfly, if market will not be able to continue upside action.
Then it should be clear whether any reaction will follow on weekly support. Or... we will get the breakout.

Conclusion:
Fundamental background is changing rapidly. It seems that strong action stands on horizon. When market will done with technical retracement, most interesting things should start...
The technical portion of Sive's analysis owes a great deal to Joe DiNapoli's methods, and uses a number of Joe's proprietary indicators. Please note that Sive's analysis is his own view of the market and is not endorsed by Joe DiNapoli or any related companies.
Within long period we've pointed that EU has fundamental problems that make difficult to talk and count on positive change in fiscal policy and discussed all major points of our view. We can't see any fundamental factors that could make EUR stronger right now. This is major reason why we keep our long-term bearish view on EUR and do not suggest that it could reverse tendency in 2019 or even in 2020 either.
This Thursday we've got official confirmation of our position from ECB as it has made dovish its look on EU economy in general and interest rates in particular.
As Reuters reports - the euro wallowed close to a 21-month low against the dollar on Friday, hurt by a series of dovish signals from the European Central Bank. The euro’s big hit on Thursday came as the ECB pushed back the timing of its first post-crisis interest rate hike to 2020, cut its economic forecasts and launched a new round of cheap bank loans.
The euro slid along with euro zone yields, with the 10-year German bund yield declining to its lowest since October 2016 following Thursday’s ECB meeting.
The ECB’s decision to tweak its forward guidance on rates was a surprise for many investors. The central bank also cut its growth and inflation forecasts through 2021.
“Whilst such an announcement was expected at some point in the coming years, the market is welcoming this proactivity,” said Karen Ward, chief market strategist for EMEA at JP Morgan Asset Management, referring to the ECB moves.
Investors have been hoping for a trigger to shake the euro/dollar out of its current narrow trading range.
The currency pair has experienced a quiet start to 2019 as central banks have put off tightening monetary policy as economic momentum slows. That has left investors struggling to decide on direction.
Thu Lan Nguyen, a currencies analyst at Commerzbank, said before the ECB announcement that should the central bank tweak its guidance then the risks for the euro were “to the downside.”
“The ECB has no choice,” said Joseph Trevisani, senior analyst at FX Street in New York. “There are a lot of internal problems which are impediments to growth.”
Anemic domestic demand and political tensions will unlikely be resolved by an easy ECB policy stance and would keep downward pressure on the euro, analysts said.
Currencies of European countries not part of the euro zone, such as the Swedish crown and Hungarian forint, fell hard after the ECB’s decision, which is aimed at battling deteriorating regional business and consumer activities, analysts said.
The single currency recorded its biggest one-day loss against the greenback since June 14, 2018 when the ECB pushed back plans for a rate hike into the summer of 2019.
The euro is at risk of falling to $1.10 in the coming weeks, analysts said.
On the other hand, the greenback reached a new 2019 high against a basket of currencies that includes the euro as traders bet the United States would fare better than Europe in the coming months despite some soft patches in the U.S. economy.
At the same time, the dollar should slip over the coming year because U.S. economic growth is slowing and any boost from a resolution in the U.S.-China trade conflict is already priced in, according to a Reuters poll of strategists.
On Friday, the dollar fell against most major currencies as data showed U.S. employers hired far fewer workers than forecast in February.
Measly 20,000-job increase in domestic payrolls last month, far fewer than 180,000 forecast among analysts polled by Reuters. But traders were encouraged by the unemployment rate falling back below 4 percent and average hourly earnings accelerating by 0.4 percent.
“The dollar sold off mildly. It doesn’t look that bad when you look at the details,” said Peter Ng, senior currency trader at Silicon Valley Bank in Santa Clara, California.
As we've talked previously, guys - job market in US is highly saturated already and it is almost no free space there. So, the drop in NFP numbers doesn't mean that US economy has some problems. The major indicators on economy here is wage inflation and unemployment rate. Both indicators shows improvement.
It means that Friday sell-off on Dollar was temporal, but impact of earnings inflation has to provide long-lasting effect, accompanied by recent ECB statement. Mostly because it puts foundation of possible rate increase by Fed in summer. This is another our "hidden" factor that we count on but which widely ignored by
the market and barely priced-in right now in EUR/USD rate.
That's being said we have bearish fundamental background for coming week and probably for following few weeks as well. It makes possible downside continuation on EUR.
COT report shows that net speculative position has become a bit more bearish as traders added net ~4K shorts:
source: cftc.gov
Charting by Investing.com
Next topic that was a bit muted recently as investors were shocked by ECB statement - is Brexit. Silently but end of March is coming and chances on hard Brexit are increasing.
Recent Fathom Consulting report tells that Brexit uncertainty hurts business climate in UK.
Fathom’s UK Economic Sentiment Indicator fell to 0.2% in January, driven primarily by weaker business confidence, with measures of consumer confidence largely unchanged on the month. Aside from the period immediately following the EU referendum, the latest reading is the weakest since early 2013, when the UK economy was on the verge of a double-dip recession. Continued uncertainty over both the nature and timing of the UK’s departure from the EU has had measurable consequences for economic activity. Based on a statistical model estimated up to 2016 Q2, our analysis suggests the level of UK business investment during the final quarter of last year was some 10% lower than it ought to have been given the evolution of the marginal product of capital, and the real cost of finance. One interpretation is that this shortfall represents the impact of heightened economic uncertainty following the June 2016 vote – and if it does, then it is broadly equivalent to a 300 basis point increase in the risk premium. Except in the event that the UK leaves the EU on 29 March with no deal, there may be little clarity regarding the nature of the UK’s trading relationship with the rest of the union for some years to come.
This is serious statement, guys. I'm not brainly analyst and can't operate freely by all kind of fundamental statistics to provide proving of my personal view. But I try to use simple conclusions, based on common sense. UK economy mostly is based on colonialist type of economy. This is just as historically happens. UK major advantage and source of income is based not on heavy industries and production but on developed financial and insurance systems that provides services in global banking and finance systems. UK needs big money flows and turnover through its banking system.
Brexit (especially in hard way), accompanied by big political and economy scandals trigger process of narrowing of financial cash flows with UK banking and insurance system and historical ally with US keeps UK out from big shifts in global trade. EU now сrack markets of Russia by building common economic space, Middle East, Iran in particular, have good chances to enter Latin America and Venezuela, avoiding tough talks and blind support of US "democracy" policy across the globe, Africa through mediation of Russia and China. UK is deprived all of this and on the eve of breaking relation with closest neighbor.
IMO guys, it will be much worse very soon and GBP turns to nose dip... I will not be surprised by parity within 1-2 years with USD... It makes me wait for acceleration of long-term bearish trend on GBP/USD pair in nearest 1-2 months.
Technicals
Monthly
Monthly time frame usually is driven by long-term economic or political process, but not short-term technical fluctuations. Our long-term view we've put above, so here, on monthly chart we tilt toward idea of re-establishing downside trend. Here is drop to 1.12 area looks small, but as we've said above, big fundamental factors stand beyond it and this is just a beginning, I suppose.
In general our analysis here still stands the same. We mostly wait for clarity - either downside breakout and start action to 1.08 and later to 1.03 or ability of the EUR to hold above 1.12 and turning up. Market stands at support area around major 5/8 Fib level. In case of upside action, YPP will be important target , because, as a rule, market tends to touch YPP through the year. But after recent events chances on rally stand phantom.
As Fathom consulting expects first rate change by Fed in June, but market is not ready for this step (as wee see from Fed watch tool by CME) - this is the first moment when EUR could show big action. By our view this should happen somewhere in summer.
As we said this many times previously - indirect technical factors point on market's weakness, at least in long-term perspectives, as EUR can't jump out from strong support within more than 5-6 months and just lays upon it. Trend stands bearish here.
Monthly situation shortly could be described as indecision with light gravitation to the downside. In fact, long standing around Yearly Pivot confirms things that we've discussed above. MACD trend stands bearish here.
Thus we keep valid our downside COP target around 1.03 by far.
Just by using of common sense, guys, in nowadays it is difficult to expect something positive as in global economy as in politics. Hence, any bad new triggers demand for safe haven assets and US dollar. Just by this simple logic odds stand in favor of downside trend rather than sharp upside reversal.
So, although on technical picture we see just light and indirect signs of EUR weakness, political background stands negative. This is the major reason why I do not believe in resurrection of bull trend on EUR in this year.
Weekly
This is most difficult chart for understanding guys. If we follow the process of its creating it is seemed like first part is formed on expectation of upside continuation while second part is on destruction of this hope.
Indeed, potentially we have bullish story - rally and long-term bullish wedge with slow down of downside action around major 5/8 Fib support. It is easy to imagine second leg of upside rally.
But until now, this picture was forming on different background - Brexit was far in the future, investors were waiting for closing of ECB QE programme. EU sentiment and economy statistics was positive. But we have absolutely different background right now.
Despite that we have bullish MACD divergence, recent action start to remind bearish dynamic pressure while upside pullbacks from trend line become smaller.
It means that market stands at the moment of truth. Downside breakout, if it will happen - will be fast, as it usually happens with opposite wedge breakouts. In current circumstance it is very dangerous to follow bullish signs here.
The compromise here is to not ignore bullish setups on daily chart, as we still stand at major weekly support, but not to count on extended upside targets.
Daily
On daily chart we follow short-term technical setup. Due ECB statement market is overextended down and needs some technical relief. As we've mentioned yesterday, we have bullish Stretch pattern here by DiNapoli framework. As a result, upside pullback has happened, triggered by NFP data.
Drop on Thursday was really fast. Although Stretch still has some more upside potential - DOSC has not reached "0" area yet, but overall situation doesn't encourage to go long here.
If we take a look at more extended picture, we could recognize butterfly with ~1.1120 target. Downside harmonic swing also points at this area. This action doesn't break weekly Fib support as it is long-term and wide, mostly represents and area of 1.11-1.12. If still we will get any upside reaction on weekly Fib level, it could be triggered by this butterfly pattern.
Intraday
As we're mostly focused on 1.1120-1.1130 area - we should keep an eye on bearish continuation patterns. First one is "222" sell, that we've discussed yesterday. EUR has shown healthy upside retracement and if we will get AB=CD action, "222" could start somewhere around K-resistance on 4H chart.
Another pattern is butterfly, if market will not be able to continue upside action.
Then it should be clear whether any reaction will follow on weekly support. Or... we will get the breakout.
Conclusion:
Fundamental background is changing rapidly. It seems that strong action stands on horizon. When market will done with technical retracement, most interesting things should start...
The technical portion of Sive's analysis owes a great deal to Joe DiNapoli's methods, and uses a number of Joe's proprietary indicators. Please note that Sive's analysis is his own view of the market and is not endorsed by Joe DiNapoli or any related companies.