Sive Morten
Special Consultant to the FPA
- Messages
- 18,699
Fundamentals
Reuters reports dollar stumbled on Friday, capping its worst weekly performance against the euro in more than two years, pulled lower by expectations U.S. interest rates will rise more slowly than previously expected.
The greenback also ended the week on a sour note against other currencies, with its largest weekly decline in two months against the Swiss franc and yen, two days after the Federal Reserve downgraded its forecasts for growth, inflation and interest rates. That doused investor expectations of a June tightening.
Jens Nordvig, Nomura's head of global foreign exchange, said
one major reason for the sharp reduction in the Fed's rate forecasts was the strengthening of the dollar since the U.S. central bank's policy meeting in December.
"This shows the Fed is highly sensitive to large moves in the dollar and that further dollar strength has the potential to further delay any tightening," said Nordvig.
Despite the dollar's weakness, market participants say the decline is temporary and the U.S. currency would have pulled back anyway after steep gains over the last six months.
"This is just some counter-trend correction in the dollar and is transitory," said Mark Luschini, chief investment strategist, at Janney Montgomery Scott in Philadelphia.
"I still think the bias for the dollar is to strengthen particularly when you consider it's always against something else. And that something else are other currencies whose central banks are either cutting rates or initiating some form of quantitative easing."
In what could be the first signs of cracks appearing in what had been a united front among major banks, HSBC on Thursday raised its euro forecast to $1.20 by end-2017, arguing that the dollar's explosive rally was nearing its end.
The dollar was down 1.4 percent against the Swiss franc at 0.9772 , for a weekly drop of 2.8 percent. Against the yen, the dollar slipped 0.5 percent to 120.61 , with a weekly decline of nearly 1 percent.
Commodity currencies gained against the dollar. The Australian dollar rose 1.7 percent to US$0.7774 and the New Zealand dollar was up 2.3 percent at US$0.7543 , while the U.S. dollar was down 1 percent versus the Canadian currency at C$1.2588 .
So, guys - today NZD again. Still, we continue to keep an eye on GBP and CAD as well. There are still forming valuable setups but they have not been completed yet. In the beginning we keep chart of NZD and dry milk relation. This is central relation for NZD and it is valid for all times.
 Right now we see significant drop in milk prices and corresponding decreasing of value of NZD. In general analysts expect stagnation milk prices on first half of 2015 or even it slow decreasing, mostly because Russia’s ban on milk import and decreasing of milk consumption in China. At the same time pace of price decreasing becomes slower. Since there was a solid production growth in recent 9 month – it overcomes domestic consumption and significantly increased supply on international market and led to price decreasing in 2014. This has led to increasing of trade volume in diary market for 15%. At the same time it is too early to speak about price growth, but better to speak on some consolidation on current levels. Improving situation in US could trigger additional demand and may be major producers will reduce output because of low prices, but this mostly could lead just to stabilization on current levels but hardly to any significant growth, at least till summer. In General decade perspectives of diary market is not really bad – CAGR 2% growth.
CFTC data shows solid drop in positions as longs as shorts, as speculative as investors’. Speaking on speculative positions, drop in short ones looks greater, while longs has dropped couple of weeks ago – they have not changed significantly on recent week. This does not contradict to our suggestion of a bit higher retracement on NZD.
Open interest:
 Speculative Shorts:
 Speculative Longs:

Technicals
Monthly
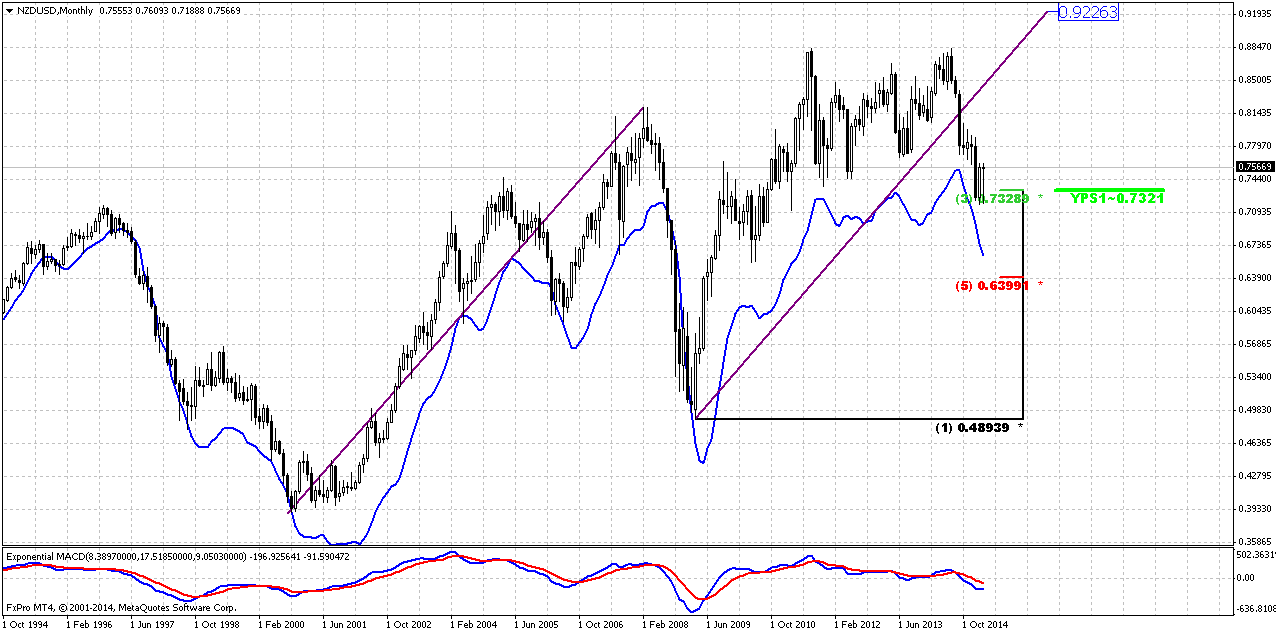
From technical point of view market has a reason for short-term bounce up, since as we can see on monthly chart – NZD stands at major Fib support and oversold. This is also Yearly Pivot support1. Trend stands bearish here. Within previous couple of weeks market has tried to move lower but support has held it. Here guys, we also have huge AB=CD pattern that has not been completed yet. And it means that sooner or later market should show upside action and finally hit its target around 0.9220 area. Meantime fundamental data suggests that we should get sideways consolidation at best scenario or even downward continuation as more probable setup. May be it will be not as fast as it was in 2014 but still recent data does not suggest reversal yet. Hence – current upside action is nothing more but reaction on support.
In general we could suggest here existence of DiNapoli “Stretch” pattern. As a result – retracement could continue right up to 0.80 area, but we do not know yet – how particularly this could happen. We need to get some pattern that will point on this scenario and right now we do not have any of them. So, on coming week we will focus on clear patterns but in future we will continue to monitor whether price action will form any larger pattern that could let us trade on larger scale.
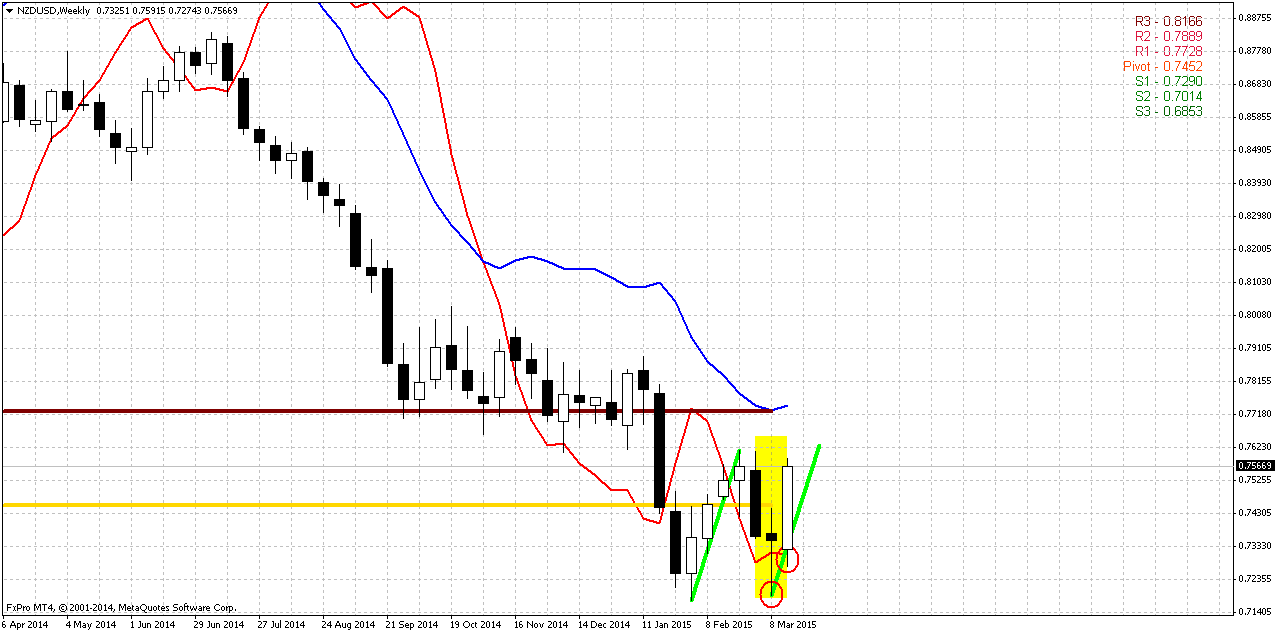
Weekly
First of all, in the beginning we would like to talk on whether market has washed out previous lows on weekly or not and was our bearish grabber completed or not. Our forum member, Nick, has sent me chart (you can find it in weekly thread comments) of FXCM retail broker and it shows that low was washed out. Hence, grabber was completed. While FX Pro shows that market has not reached it:
This is the problem of retail brokers. As we’ve recommended in our Forex Military School – you need to look at exchange traded market. This will give you correct answer. And this answer is “yes” lows were renewed. Here is CME NZD futures Chart:

It means that our former setup has been completed and bearish grabber has reached target.
Now let’s turn to modern chart. It is very informative. Here we have two different patterns. In addition to grabber on previous week, we’ve got another one, although potential of them is very small – just previous tops. In fact market could take the shape of AB=CD here.
Second pattern that we have – morning star and it has a bit greater potential. Let’s focus on combination of MPR1, weekly oversold and former consolidation resistance.
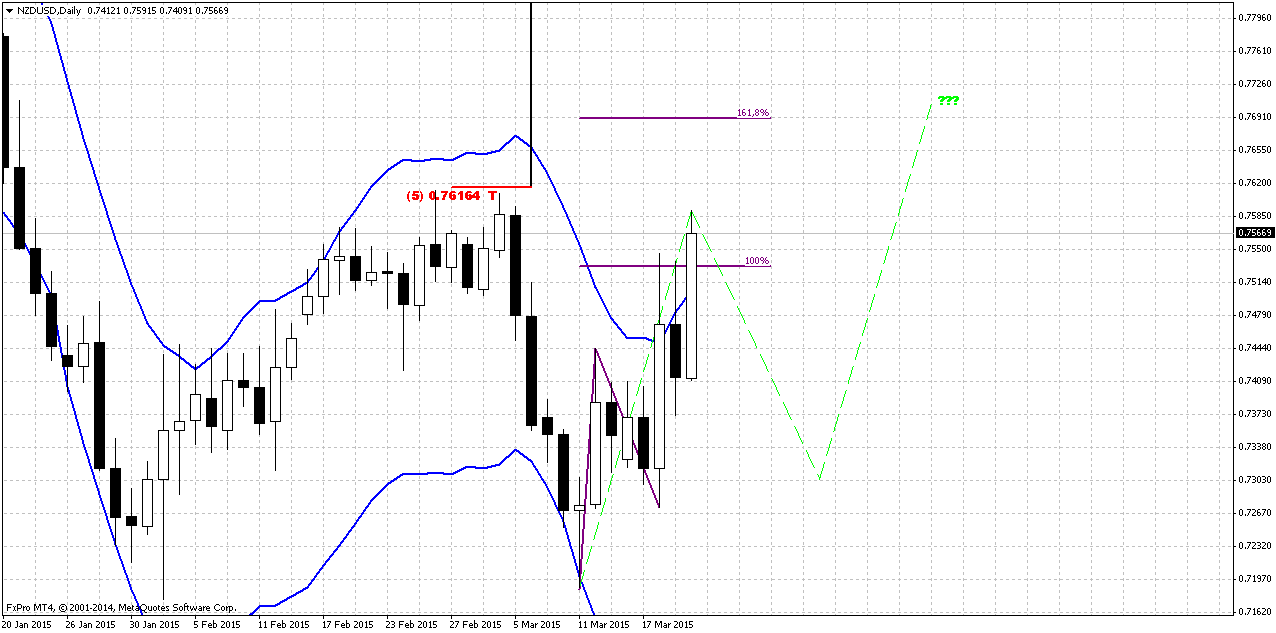
Daily
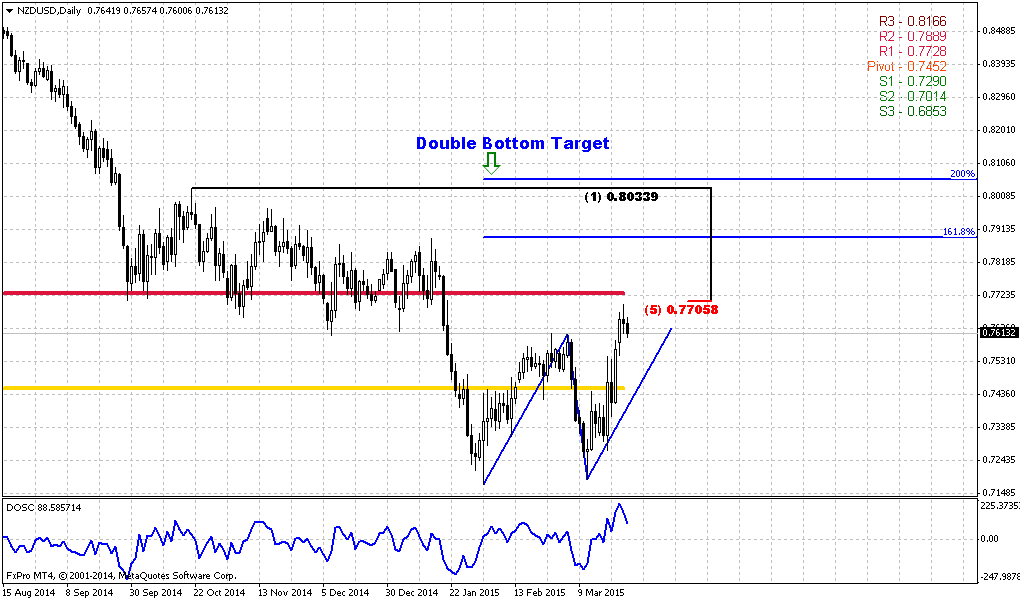
The first moment that we would like to attract your attention to is the strength of upside action. NZD has moved very deep above daily overbought. This is very rare for financial markets that are very sensitive to overbought/oversold conditions. If market has done this, it means that this is not just some technical reasons for that but something else. Whatever it was – it significantly increases upside continuation… but not right now.
Actually this move deep in oversold mystically corresponds to weekly morning star pattern. As it was completed – some downward retracement should happen inside the body of this pattern. And oversold here is very suitable. It lets us to suggest that we could get large AB-CD pattern and current upside action could be AB leg. In this case next target will be 1.618 extension of initial AB-CD that we’ve traded on previous week. And this target coincides with weekly target that we’ve discussed – MPR1 and oversold around 0.7720.
Finally, most extended view – could we get, say, double bottom here, guys? Still, we have “Stretch” on monthly chart that makes possible action to 0.80, and this is particularly the target of Double bottom on daily chart… But our business for next week is just AB-CD to 0.7720…
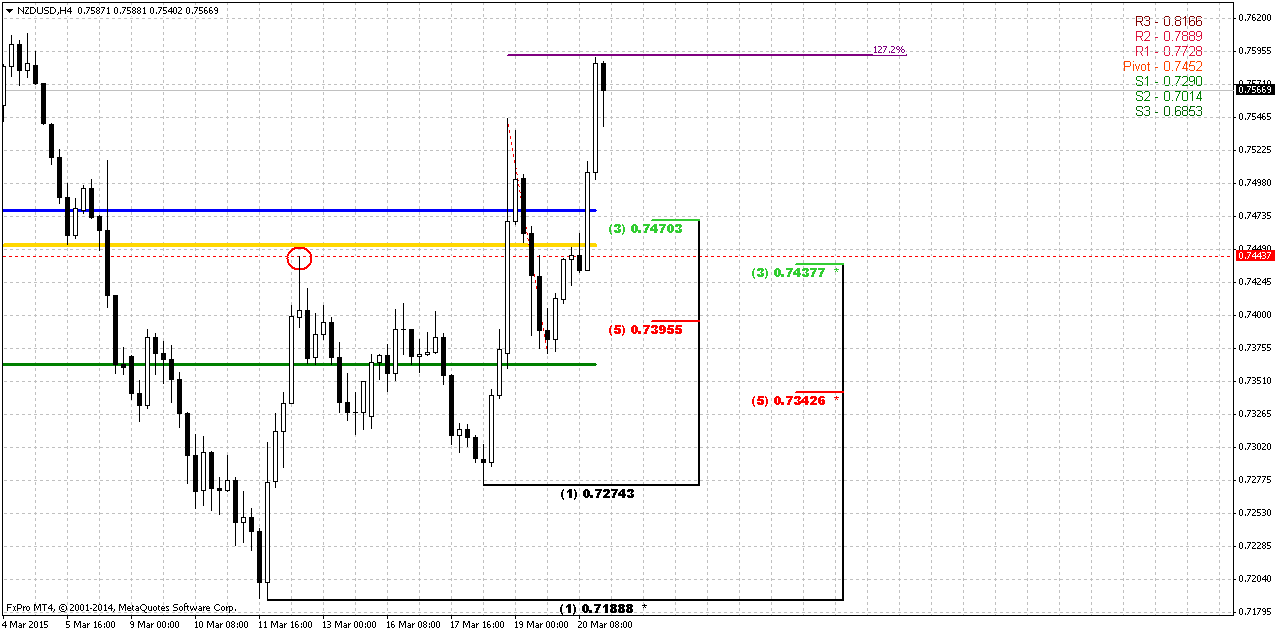
4-Hour
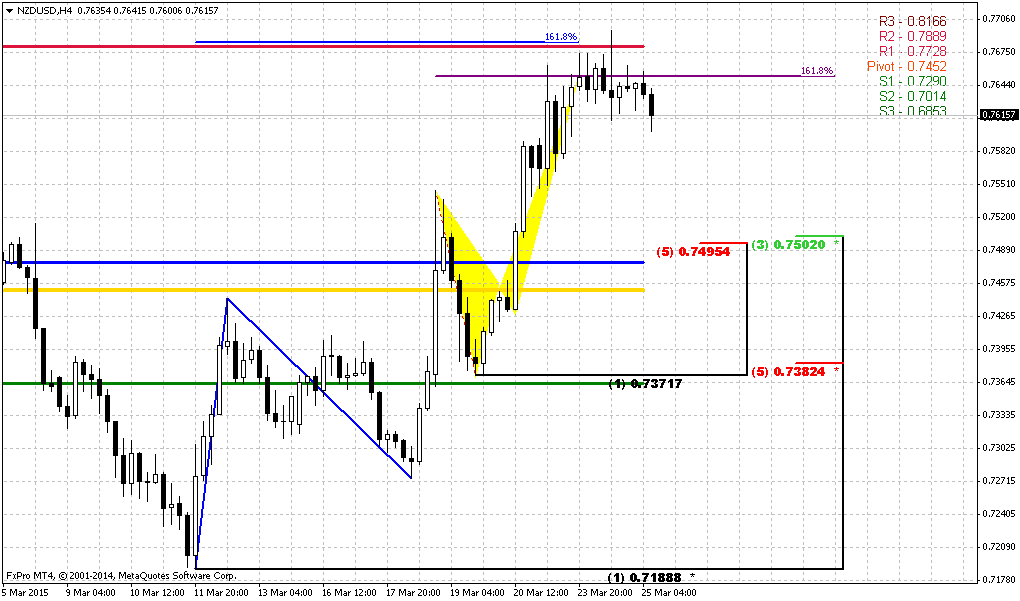
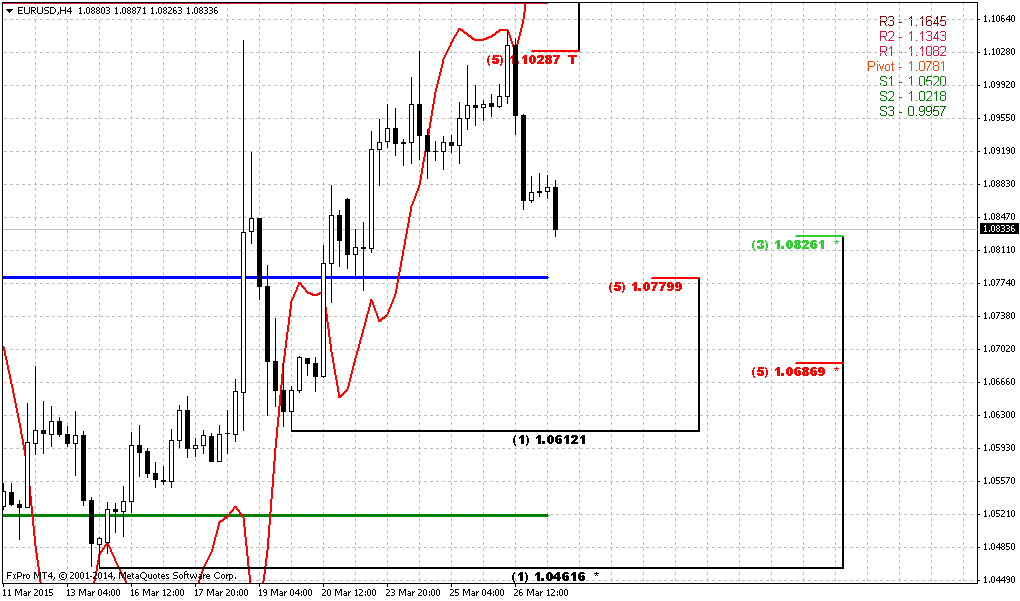
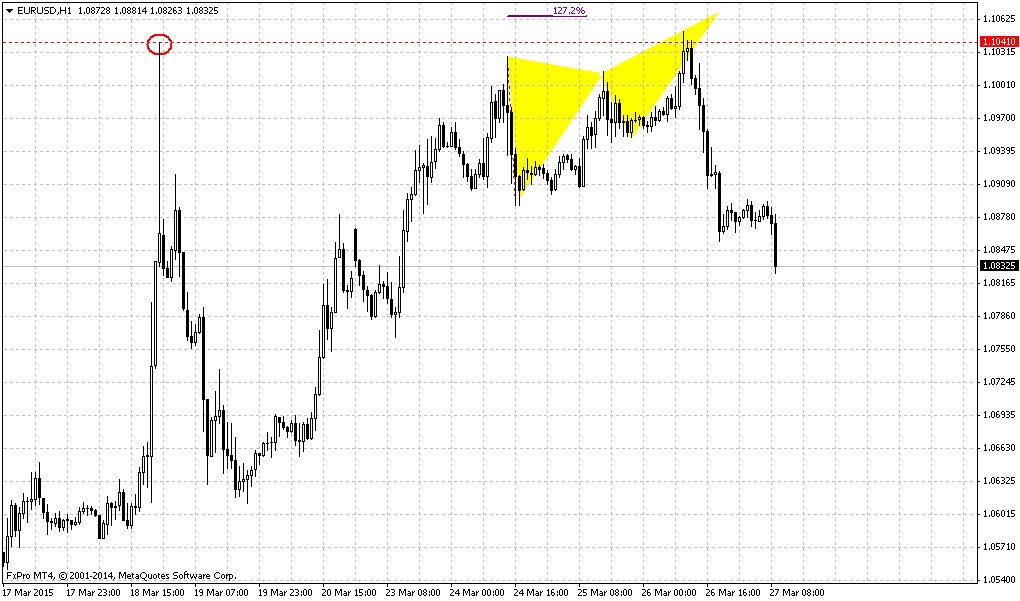
So, our Friday setup has completed perfectly and butterfly “sell” has hit the target. Usually when market shows as fast action as it was on Friday, we wait for action to 1.618, but we should not forget that market at daily overbought. Hence, retracement could start right from here. On hourly chart we also have bearish MACD divergence.
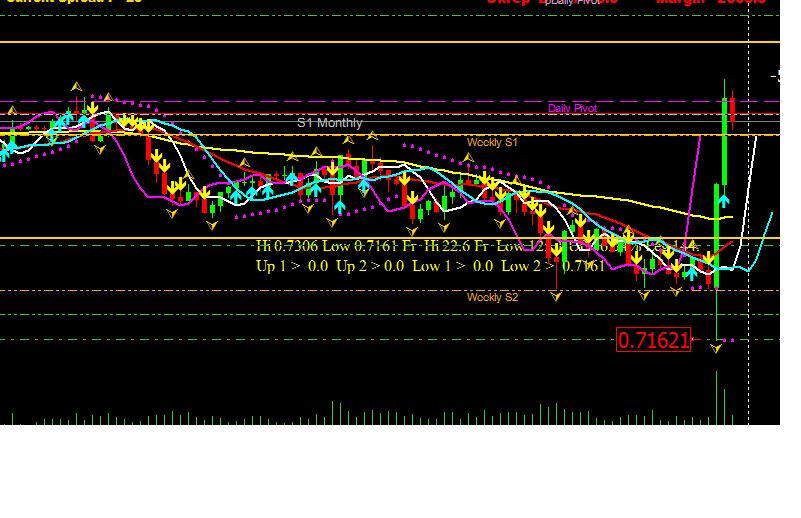
As we mostly deal with weekly pattern – retracement should be significant. Our primary attention will stand at powerful support cluster, including 0.74-0.7435 K-support, WPP, previous top and MPP. There we will be watching for possible bullish patterns that could let us to take long position. Probably it will take couple of sessions.
Conclusion:
That’s being said we can’t count on bullish sentiment on NZD in medium-term perspective as from fundamental as from technical point of view. Current upward action we should treat as retracement. At the same time, as retracement stands on monthly chart, we can’t exclude that market will form some pattern that will lead market to higher retracement, may be even to 0.80 area.
In short-term perspective we continue to ride on upside retracement and try to catch entry in next upside leg.
The technical portion of Sive's analysis owes a great deal to Joe DiNapoli's methods, and uses a number of Joe's proprietary indicators. Please note that Sive's analysis is his own view of the market and is not endorsed by Joe DiNapoli or any related companies.
Reuters reports dollar stumbled on Friday, capping its worst weekly performance against the euro in more than two years, pulled lower by expectations U.S. interest rates will rise more slowly than previously expected.
The greenback also ended the week on a sour note against other currencies, with its largest weekly decline in two months against the Swiss franc and yen, two days after the Federal Reserve downgraded its forecasts for growth, inflation and interest rates. That doused investor expectations of a June tightening.
Jens Nordvig, Nomura's head of global foreign exchange, said
one major reason for the sharp reduction in the Fed's rate forecasts was the strengthening of the dollar since the U.S. central bank's policy meeting in December.
"This shows the Fed is highly sensitive to large moves in the dollar and that further dollar strength has the potential to further delay any tightening," said Nordvig.
Despite the dollar's weakness, market participants say the decline is temporary and the U.S. currency would have pulled back anyway after steep gains over the last six months.
"This is just some counter-trend correction in the dollar and is transitory," said Mark Luschini, chief investment strategist, at Janney Montgomery Scott in Philadelphia.
"I still think the bias for the dollar is to strengthen particularly when you consider it's always against something else. And that something else are other currencies whose central banks are either cutting rates or initiating some form of quantitative easing."
In what could be the first signs of cracks appearing in what had been a united front among major banks, HSBC on Thursday raised its euro forecast to $1.20 by end-2017, arguing that the dollar's explosive rally was nearing its end.
The dollar was down 1.4 percent against the Swiss franc at 0.9772 , for a weekly drop of 2.8 percent. Against the yen, the dollar slipped 0.5 percent to 120.61 , with a weekly decline of nearly 1 percent.
Commodity currencies gained against the dollar. The Australian dollar rose 1.7 percent to US$0.7774 and the New Zealand dollar was up 2.3 percent at US$0.7543 , while the U.S. dollar was down 1 percent versus the Canadian currency at C$1.2588 .
So, guys - today NZD again. Still, we continue to keep an eye on GBP and CAD as well. There are still forming valuable setups but they have not been completed yet. In the beginning we keep chart of NZD and dry milk relation. This is central relation for NZD and it is valid for all times.
CFTC data shows solid drop in positions as longs as shorts, as speculative as investors’. Speaking on speculative positions, drop in short ones looks greater, while longs has dropped couple of weeks ago – they have not changed significantly on recent week. This does not contradict to our suggestion of a bit higher retracement on NZD.
Open interest:
Technicals
Monthly
From technical point of view market has a reason for short-term bounce up, since as we can see on monthly chart – NZD stands at major Fib support and oversold. This is also Yearly Pivot support1. Trend stands bearish here. Within previous couple of weeks market has tried to move lower but support has held it. Here guys, we also have huge AB=CD pattern that has not been completed yet. And it means that sooner or later market should show upside action and finally hit its target around 0.9220 area. Meantime fundamental data suggests that we should get sideways consolidation at best scenario or even downward continuation as more probable setup. May be it will be not as fast as it was in 2014 but still recent data does not suggest reversal yet. Hence – current upside action is nothing more but reaction on support.
In general we could suggest here existence of DiNapoli “Stretch” pattern. As a result – retracement could continue right up to 0.80 area, but we do not know yet – how particularly this could happen. We need to get some pattern that will point on this scenario and right now we do not have any of them. So, on coming week we will focus on clear patterns but in future we will continue to monitor whether price action will form any larger pattern that could let us trade on larger scale.
Weekly
First of all, in the beginning we would like to talk on whether market has washed out previous lows on weekly or not and was our bearish grabber completed or not. Our forum member, Nick, has sent me chart (you can find it in weekly thread comments) of FXCM retail broker and it shows that low was washed out. Hence, grabber was completed. While FX Pro shows that market has not reached it:
This is the problem of retail brokers. As we’ve recommended in our Forex Military School – you need to look at exchange traded market. This will give you correct answer. And this answer is “yes” lows were renewed. Here is CME NZD futures Chart:
It means that our former setup has been completed and bearish grabber has reached target.
Now let’s turn to modern chart. It is very informative. Here we have two different patterns. In addition to grabber on previous week, we’ve got another one, although potential of them is very small – just previous tops. In fact market could take the shape of AB=CD here.
Second pattern that we have – morning star and it has a bit greater potential. Let’s focus on combination of MPR1, weekly oversold and former consolidation resistance.
Daily
The first moment that we would like to attract your attention to is the strength of upside action. NZD has moved very deep above daily overbought. This is very rare for financial markets that are very sensitive to overbought/oversold conditions. If market has done this, it means that this is not just some technical reasons for that but something else. Whatever it was – it significantly increases upside continuation… but not right now.
Actually this move deep in oversold mystically corresponds to weekly morning star pattern. As it was completed – some downward retracement should happen inside the body of this pattern. And oversold here is very suitable. It lets us to suggest that we could get large AB-CD pattern and current upside action could be AB leg. In this case next target will be 1.618 extension of initial AB-CD that we’ve traded on previous week. And this target coincides with weekly target that we’ve discussed – MPR1 and oversold around 0.7720.
Finally, most extended view – could we get, say, double bottom here, guys? Still, we have “Stretch” on monthly chart that makes possible action to 0.80, and this is particularly the target of Double bottom on daily chart… But our business for next week is just AB-CD to 0.7720…
4-Hour
So, our Friday setup has completed perfectly and butterfly “sell” has hit the target. Usually when market shows as fast action as it was on Friday, we wait for action to 1.618, but we should not forget that market at daily overbought. Hence, retracement could start right from here. On hourly chart we also have bearish MACD divergence.
As we mostly deal with weekly pattern – retracement should be significant. Our primary attention will stand at powerful support cluster, including 0.74-0.7435 K-support, WPP, previous top and MPP. There we will be watching for possible bullish patterns that could let us to take long position. Probably it will take couple of sessions.
Conclusion:
That’s being said we can’t count on bullish sentiment on NZD in medium-term perspective as from fundamental as from technical point of view. Current upward action we should treat as retracement. At the same time, as retracement stands on monthly chart, we can’t exclude that market will form some pattern that will lead market to higher retracement, may be even to 0.80 area.
In short-term perspective we continue to ride on upside retracement and try to catch entry in next upside leg.
The technical portion of Sive's analysis owes a great deal to Joe DiNapoli's methods, and uses a number of Joe's proprietary indicators. Please note that Sive's analysis is his own view of the market and is not endorsed by Joe DiNapoli or any related companies.